Abstract
Various overvoltage mitigation schemes were used in literature in suppression of switching overvoltages in wind farms. However, the evaluation of how the effectiveness of these mitigation techniques would vary with the change of the wind farm topology is still un-explored territory. The main aim of this paper is to study the effectiveness of four mitigation schemes while using SF6 circuit breaker namely; R–L smart choke, R–C snubber circuit, surge capacitor and pre-insertion resistor (PIR) were studied in four different wind farm topologies; radial, single-sided ring, double-sided ring and star topologies. The topologies were based on a real wind farm located in Zaafrana, Egypt. The results showed that R–L choke to be the most effective scheme for all topologies followed by PIR, R–C snubber and surge capacitor schemes respectively. Their percentage of reduction of overvoltage ranged from 62 to 84% for R–L choke, 33–67% for PIR, 8–25% for R–C snubber circuits and 4–15% for surge capacitors. Also, it was shown that the change of the wind farm topology didn’t affect the order of effectiveness of the mitigation schemes such that R–L remained the most effective and surge capacitor the least effective for all topologies.
Subject terms: Electrical and electronic engineering, Power distribution, Power stations
Introduction
The dual sided problem arising from the vast scale of the energy market due to the increasing demand for electric power in addition to the diminishing supply for the reserve fossil fuel has led to a fast track reliance on renewable energy sources. One of the main sources that has been utilized globally is wind energy leading to excessive investigation into the performance and protection wind farms. However, the structure of wind farms differs from conventional power stations in employing huge numbers of power transformers, underground cables that extend for long distances and control algorithms that mandate frequent switching operations1. Generally, wind farms constitute of several electrical and mechanical elements such as wind towers, turbines, underground cables, transformers, and protection devices. The connections between these elements could be built in various topologies with four main widely known topologies namely; topologies are Radial topology, Single-Sided Ring (SSR) topology, Double-Sided Ring (DSR) topology, and Star topology2.
The frequent switching induces a transient overvoltage whose destructive effect is amplified by the presence of power transformers and the MV cables which forms a resonant RLC circuit3. This destructive effect has led to insulation failures in wind farms4. The consequent losses due to theses failures have lead researchers to investigate the impact of transient overvoltages in wind farms5–7. The highlights of the literature regarding the study of the impact of overvoltages in wind farms and the suppression measures employed to mitigate the overvoltages are summarized in Table 1. The main focus of the survey was upon recent papers within the last five years. For such reason, the table scans most papers within years 2019 up to 2023 with a total of 18 publications in the recent five years and 3 publications in earlier years.
Table 1.
Highlights in literature investigating the impact of overvoltages in wind farms.
| References | Year | Topic studied in publication | Suppression measures used |
|---|---|---|---|
| 3 | 2021 | Investigated switching overvoltages in different wind farm topologies | Splitting the switching process into two stages |
| 8 | 2022 | Proposed a method for calculating arcing time and probability of reignitions | RC Snubber circuit and phase controlled switching |
| 9,11 | 2021, 2022 | Proposed a method that evaluates the of suppression measures of overvoltages | Surge arrester, RC snubber |
| 10 | 2019 | Analyzed the factors affecting switching transient overvoltage in an offshore wind farm | Not discussed |
| 12 | 2023 | Investigated the arising temporary overvoltage resulting from de-energization conditions, and the Ferro resonance in off shore wind farms | Pre-Insertion Resistor (PIR) |
| 13 | 2020 | Analyzed statistically the overvoltage variations across the step-up transformer during the switching of circuit breaker | Not discussed |
| 14 | 2021 | Investigated the overvoltage caused by switching off shunt reactors in a 35 kV substation, | Phase-controlled VCB, surge arresters, RC snubber, double-break circuit breaker and increasing the cable length |
| 15 | 2020 | Investigated temporary overvoltage arising from switching of the circuit breaker connecting the wind turbine to the feeder | A damping resistor, shunt reactor and surge arrester |
| 16 | 2019 | Performed sensitivity analysis to define the factors affecting transient overvoltages in off-shore wind farms | Not discussed |
| 17 | 2019 | Analyzed the over-voltage formation mechanism in HVDC connected wind farm integration system | Proposed control strategies to suppress the over-voltage |
| 18 | 2019 | Studied the influence of different grinding parameter upon transient overvoltages | Not discussed |
| 19,20 | 2014, 2011 | Switching over-voltages have been simulated in a wind farm to show the effect of changing the topology from radial to star topology in | Not discussed |
| 21 | 2012 | Studied the transient overvoltage in a radial system topology of a real practical wind farm | Not discussed |
| 22 | 2022 | Studied the impact of multiple reignitions during switching off of vacuum circuit breaker in an offshore wind farm | R–C snubber circuit |
| 23 | 2020 | Investigated the impact of switching reignition overvoltage in vacuum circuit breakers when switching off inductive loads | R–C snubber circuit |
| 24 | 2023 | Investigated impact of the parameters of vacuum circuit breaker upon the switching overvoltages | Not discussed |
| 25 | 2021 | Investigated switching transients in off-shore wind farms | R–C snubber circuit |
| 26 | 2023 | Studied the switching overvoltages generated by the breaking of the vacuum circuit breaker in the wind farm | R–C snubber circuit, Choke coil |
| 27 | 2019 | Studied the transient overvoltages in off-shore wind farms | Not discussed |
The table shows the diverse topics studied in literature in regards of the transient analysis within wind farms. However, the impact of selecting the most suitable suppression technique with respect to the wind farm topology was not investigated before. Such topic is highly important as the degree of severity of the switching overvoltages (SOV) depends mainly on the wind farm topology3,19,20. Therefore, the main problem that this paper aims to address is to investigate the most suitable suppression measure for each wind farm topology. Thus, the contributions of this paper will be:
Studying and investigating the impact of different wind farm topologies (radial, DSR, SSR and star) upon the transient SOV. Such comparison was rarely covered in literature with few publications as reference 3 only covering this point.
Performing simulations to reach for the most suitable suppression technique for each wind farm topology with that particular contribution not investigated before in literature.
Presenting conclusions based on the presented results which can be used by researchers for selection the optimal suppression measures based upon network topology. The results showed the R–L choke coil to be the most effective suppression measure in reducing SOV with a percentage of reduction in amplitude of SOV of 62–84%.
The rest of this paper is organized as follows. In “System under study” section presents the system under study. In “Modeling of the system” section discusses the modeling methodologies used for different elements within the system. Simulation results are presented for each wind farm topology in “Simulation results” section. The results of “Discussion and effectivity analysis” section are discussed in “Discussion and effectivity analysis” section showing the main features for selecting the suitable suppression method for each topology. Finally, conclusions are drawn in Sect. Conclusions.
System under study
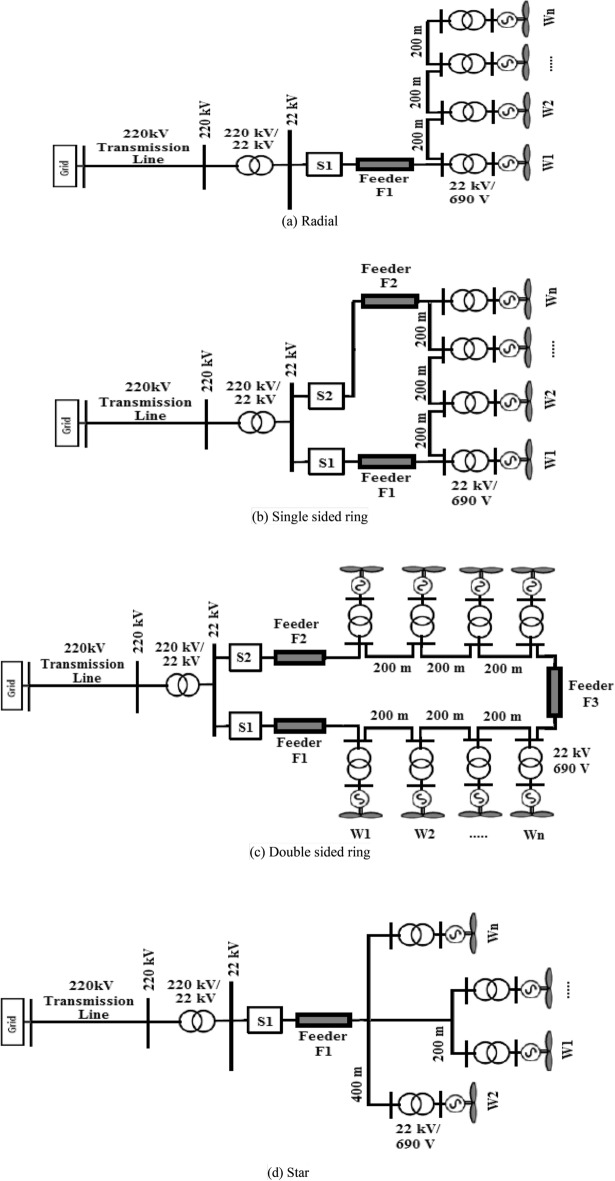
The system selected to be under study is based on a real system located in Zaafrana, Egypt. The system is rated at 550 MW generated from 700 wind turbines that were assumed to have identical characteristics. For each turbine, a 1 MVA 690 V/22 kV-transformer is used. Cables of 200-m length are used to connect each two consecutive series turbines. The wind farm is connected to the grid through a 220/22 kV substation. The basic configuration will be kept unchanged but the connection between the turbines will changed to include four different connection topologies namely; radial, single-sided ring, double-sided ring and star connection that are shown in Fig. 1. The lengths of feeders are as follows: feeder F1 is 8 km for all topologies, feeder F2 is 10.4 km in single-sided ring topology and 6.5 km in double-sided ring topology. The length of feeder F3 is 1 km. the length of the cables between series turbines is 200 m for all topologies except of the star topology. In that particular topology, the length of the cable for each turbine will be 200 m for W1, 400 m for W2, 200 m W3, and 400 m for W4. The modifications done is based upon those presented in3. The modeling of each component of the system is discussed in the next section.
Figure 1.
Topologies of wind farm.
Modeling of the system
Modeling of the circuit breaker
The circuit breakers used in this study are SF6 circuit breakers which could be modeled using several approaches with two most famous modeling blocks used known as Mayr’s and Cassie models. Both models are discussed in the next subsections.
Mayr’s model
The approach used in Mayr’s model depends upon using dynamic analysis for the arc which defines the breakers ability to reach successful opening28. The main variable computed with the arc analysis is the conductance of the arc. During the opening process, the arc goes through four stages that represent the transition process of the breaker from certain state to another. These stages are closed breaker, arcing, arc extinguishing and open stages29,30. For the first stage that represents closed breaker and last stage that represents open breaker, the breaker is represented as a constant resistor of negligibly small value of 1 μΩ and high value of MΩ respectively. For the remaining transition stages, a series connection could be deduced as follows29,31.
- During the arcing stage, an imbalance arises in between the heating power from the arc and the cooling power due to the dissipation of the energy from the arc . The difference between both energies is stored within the arc column Q(t) as given in (1)
1 - The energy stored in arc Q(t) is used to define the conductance as given in (2) where τ is the arc time constant.
2 - The given expression in (1) could re-defined in terms of the arc conductance as given in (3).
3
The modeling of the SF6 interrupter into ATP/EMTP environment is done by the MODELS component. That component allows the user to build a coded program integrates its programming with the simulated electrical system.
Transmission lines, feeders and cables
The modeling of the transmission lines was done by the frequency-dependent model of the transmission lines with their parameters as given in Table 2. While for cables and feeders, the frequency-dependent cable model used with their lengths as given in previous section.
Table 2.
Transmission line parameters.
| Positive and negative sequence parameters | Zero sequence parameters | |
|---|---|---|
| Resistance (Ω/km) | 0.03 | 0.13 |
| Reactance (Ω/km) | 0.306 | 0.83 |
| Susceptance (mS/km) | 3.25 | 2.3 |
Power transformers
The frequency-dependent transformer model is used to account for the nonlinearities when studying the transformer’s energization. For transient analysis, the effect of the stray capacitance is crucial to be considered. For such reason, the stray capacitances between each winding and the ground and the capacitance between the two windings of the main transformers were simulated using capacitive elements connected across transformer component upon ATP3,32.
Wind turbine
The generation system within the wind turbine consists of different devices including the generator, gearbox, rectifier, three-phase inverter, and other components. Since the main focus of this research is the response from the switching circuit breaker, a 5 MW, 690 V synchronous generator model is used. The leakage reactance of the generator is 0.1 H32.
Simulation results
The investigation of the effectiveness of different mitigation techniques with respect to the topology of the wind farm was undergone using ATP/EMTP simulation platform. Different wind farm topologies provided earlier and shown in Fig. 1 were modeled as described in modeling section. For each topology, different mitigation techniques were applied individually one by one to assess their capability in reducing the switching overvoltages. The mitigation techniques studied include four schemes that showed their effectiveness in literature namely; RC snubber circuit8,9,11, Pre-Insertion Resistor (PIR)12 and surge capacitor33. The value of the parameters of each scheme (R and/or C) were set to reach maximum reduction in overvoltages based on defined ranges from literature34. The selected values were 100 Ω for the PIR, R = 50 and C = 1 µF for the RC snubber circuit and the capacitance of the surge capacitor was 1 µF. A fourth technique termed as smart choke is used which was introduced by ABB, which consists of a set of parallel RL filters series connected at the upstream of a protected transformer35. The R–L are integrated in their effect with the phase-to-ground capacitance of the transformer forming a low-pass filter that helps in reducing du/dt, limiting the overvoltage levels. The range of different parameters of the R–L is defined by ranges of 25–50 Ω for the damping resistor and 0.6–1.5 mH for inductor36. For this work, the previous range of the values were tested and the values giving maximum reduction in switching overvoltage were selected which was found to be R of 50 Ω and inductance of 1.5 mH. The results for different mitigation techniques for each topology with R, L and C values were set as defined earlier are present in the following subsections.
Simulation results for radial topology
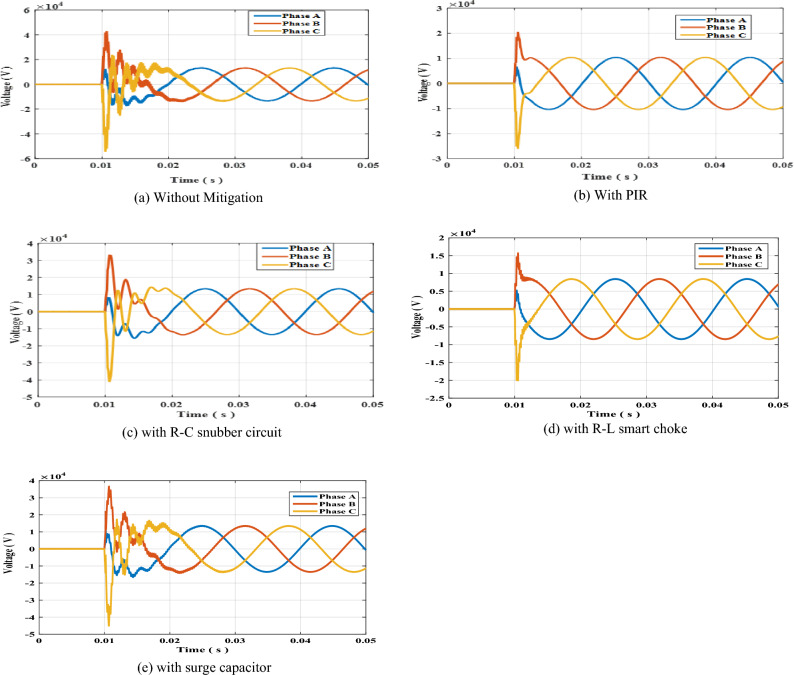
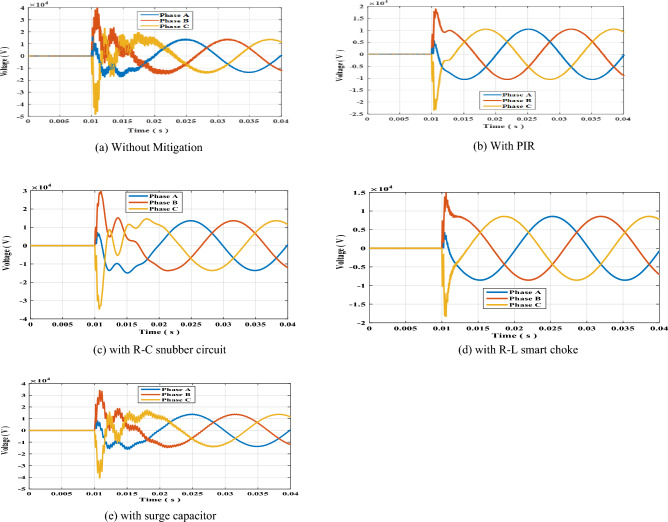
The circuit breaker switch S1 shown in Fig. 1a for radial topology was suddenly opened at t = 10 ms. The results of the arising switching transient overvoltage is shown in Fig. 2a. The PIR was connected in parallel with S1 and effectively reduced the overvoltages as shown in Fig. 2b. Sequentially, the PIR was removed R–C snubber circuit was connected in parallel with resulting transient overvoltages shown in Fig. 2c. The same sequence was done for the smart choke and surge capacitor whose results are shown in Fig. 2d,e respectively. The peak values recorded for each phase in each mitigation scheme are presented in Table 3. The results show that R–L smart choke was the most effective scheme in reducing switching overvoltages. Further discussion and analysis of the results are presented in the next section. To Further elaborate the impact of R–L choke upon the resulting SOV, the values of R and L such that the value of R was increased to 100 Ω while keeping L constant at 1.5 mH, then the value of L was increased to 2 mH while keeping R constant at 50 Ω. The resulting SOV was recorded for each case. The results of SOVs with new R an L are presented in Table 4. The results show that the minimal SOV was for R = 50 Ω and L = 1.5 mH.
Figure 2.
Switching overvoltage across circuit breaker S1 in radial topology.
Table 3.
Peak value of switching overvoltage across circuit breaker S1 in radial topology.
| Mitigation method | Switching overvoltage (kV) | ||
|---|---|---|---|
| Phase A | Phase B | Phase C | |
| Without mitigation | 17.601 | 42.883 | 54.559 |
| With PIR | 6.631 | 20.628 | 26.120 |
| With R–C | 15.451 | 32.238 | 41.117 |
| With choke coil R–L | 5.394 | 15.867 | 20.236 |
| With surge capacitor | 16.675 | 36.756 | 45.332 |
Table 4.
Peak value of switching overvoltage across circuit breaker S1 in radial topology with R–L choke connected.
| R–L values | Switching overvoltage (kV) | ||
|---|---|---|---|
| Phase A | Phase B | Phase C | |
| R = 50 Ω, L = 1.5 mH | 5.394 | 15.867 | 20.236 |
| R = 100 Ω, L = 1.5 mH | 6.801 | 22.120 | 28.317 |
| R = 50 Ω, L = 2 mH | 5.756 | 16.709 | 21.411 |
Simulation results for single-sided ring topology
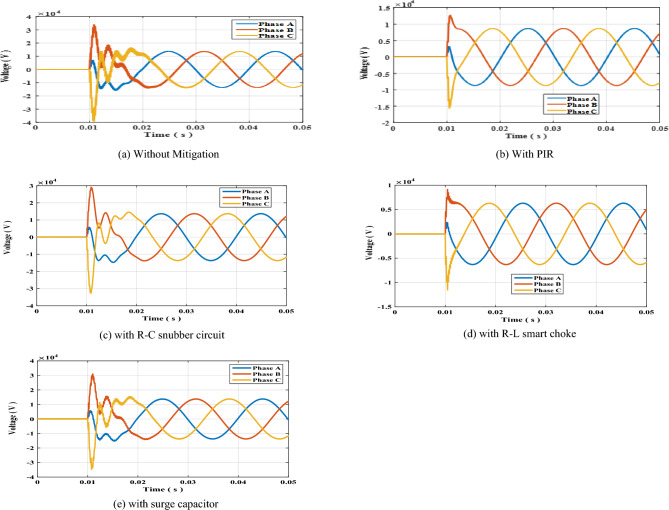
The same sequence of the previous section will be undergone for this section for single sided ring topology such that circuit breaker switch S1 was opened at t = 10 ms. The results of the arising switching transient overvoltage without mitigation, with PIR, RC-snubber, smart choke and surge capacitor shown in Fig. 3a–e respectively. The peak values of the switching transients per phase are presented in Table 5. The results show that R–L smart choke was the most effective scheme in reducing switching overvoltages as in previous case. As in previous topology, the impact of R–L choke upon the resulting SOV was investigated by changing the values of R and L as presented in Table 6. The results show that the minimal SOV was for R = 50 Ω and L = 1.5 mH.
Figure 3.
Switching overvoltage across circuit breaker S1 in single-sided ring topology.
Table 5.
Peak value of switching overvoltage across circuit breaker S1 in single sided ring topology.
| Mitigation method | TRV (kV) | ||
|---|---|---|---|
| Phase A | Phase B | Phase C | |
| Without mitigation | 16.021 | 34.272 | 39.452 |
| With PIR | 3237 | 12,800 | 15,700 |
| With R–C | 14.700 | 29.216 | 32.775 |
| With choke coil R–L | 2.440 | 9.238 | 11.616 |
| With surge capacitor | 15.260 | 31.500 | 34.835 |
Table 6.
Peak value of switching overvoltage across circuit breaker S1 in single sided ring topology with R–L choke connected.
| R–L values | Switching overvoltage (kV) | ||
|---|---|---|---|
| Phase A | Phase B | Phase C | |
| R = 50 Ω, L = 1.5 mH | 2.440 | 9.238 | 11.616 |
| R = 100 Ω, L = 1.5 mH | 3.449 | 13.582 | 16.580 |
| R = 50 Ω, L = 2 mH | 2.613 | 9.707 | 12.237 |
Simulation results for double-sided ring topology
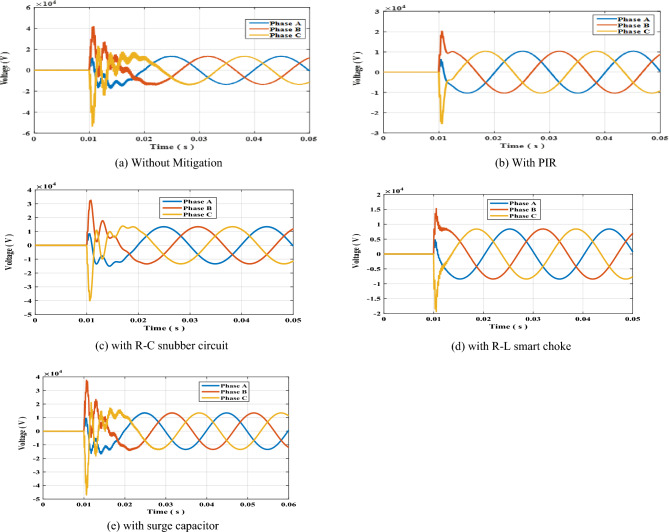
The results of the arising switching transient overvoltage across S1 in double sided ring topology of Fig. 1c in case no mitigation used, with PIR, RC-snubber, smart choke and surge capacitor shown in Fig. 4a–e respectively. The peak values of the switching transients per phase are presented in Table 7. In the same manner as in previous topologies, the values of R and L were changed as presented in Table 8. The results show that the same conclusion as in previous topologies which is the minimal SOV was for R = 50 Ω and L = 1.5 mH.
Figure 4.
Switching overvoltage across circuit breaker S1 in double-sided ring topology.
Table 7.
Peak value of switching overvoltage across circuit breaker S1 in double-sided ring topology.
| Mitigation method | TRV (kV) | ||
|---|---|---|---|
| Phase A | Phase B | Phase C | |
| Without mitigation | 17.550 | 42.330 | 53.850 |
| With PIR | 6.418 | 20.460 | 25.736 |
| With R–C | 15.073 | 32.751 | 40.295 |
| With choke coil R–L | 4.885 | 15.452 | 19.551 |
| With surge capacitor | 16.844 | 37.832 | 47.237 |
Table 8.
Peak value of switching overvoltage across circuit breaker S1 in double sided ring topology with R–L choke connected.
| R–L values | Switching overvoltage (kV) | ||
|---|---|---|---|
| Phase A | Phase B | Phase C | |
| R = 50 Ω, L = 1.5 mH | 4.885 | 15.452 | 19.551 |
| R = 100 Ω, L = 1.5 mH | 6.418 | 21.660 | 27.507 |
| R = 50 Ω, L = 2 mH | 5.237 | 16.231 | 20.610 |
Simulation results for star topology
The results for the switching transient overvoltage across S1 in star topology of Fig. 1d in case no mitigation used, with PIR, RC-snubber, smart choke and surge capacitor shown in Fig. 5a–e respectively. The peak values of the switching transients per phase are presented in Table 9. In the same sequence for R and L testing was done for this topology as in previous topologies as presented in Table 10. The results show that the same conclusion as in previous topologies.
Figure 5.
Switching overvoltage across circuit breaker S1 in star topology.
Table 9.
Peak value of switching overvoltage across circuit breaker S1 in star topology.
| Mitigation method | TRV (kV) | ||
|---|---|---|---|
| Phase A | Phase B | Phase C | |
| Without mitigation | 17.352 | 39.725 | 48.186 |
| With PIR | 5.583 | 18.952 | 23.394 |
| With R–C | 14.913 | 29.883 | 34.816 |
| With choke coil R–L | 4.309 | 14.921 | 18.439 |
| With surge capacitor | 16.135 | 34.132 | 40.941 |
Table 10.
Peak value of switching overvoltage across circuit breaker S1 in star topology with R–L choke connected.
| R–L values | Switching overvoltage (kV) | ||
|---|---|---|---|
| Phase A | Phase B | Phase C | |
| R = 50 Ω, L = 1.5 mH | 4.309 | 14.921 | 18.439 |
| R = 100 Ω, L = 1.5 mH | 5.967 | 20.000 | 24.741 |
| R = 50 Ω, L = 2 mH | 4.543 | 15.744 | 19.544 |
Discussion and effectivity analysis
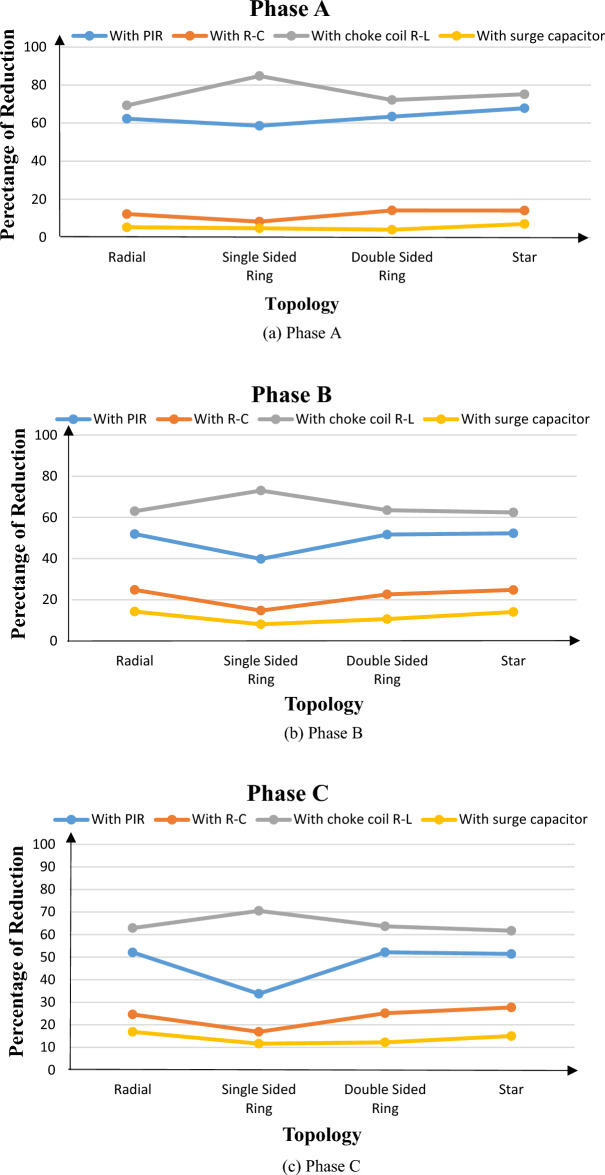
To evaluate the effectivity of each mitigation scheme used, the amount of reduction in switching overvoltages was computed. For radial topology, the transient overvoltage of phase A reached a peak value of 17.6 kV without any mitigation technique used. That value was reduced to 6.6 kV for the same phase when PIR was used. Hence, the percentage of the reduction in the switching overvoltage in this case is 62.32% with respect to the unmitigated original overvoltage of 17.6 kV. The percentage of reduction for phase A for each mitigation scheme and in each topology are shown in Fig. 6a. Similarly, for phases B and C in Fig. 6b,c respectively. The results show that smart choke R–L was the most effective scheme for all topologies. That effectiveness was monitored from the percentage of overvoltage that reached 84.7% in case of single sided ring topology and ranged from 62 to 73% in other topologies. The remaining schemes could be arranged in order of their effectivity as PIR, R–C snubber and surge capacitor respectively. The PIR, R–C snubber and surge capacitor had a percentage reduction ranging from 33 to 67%, 8 to 25% and 4 to 15% respectively. It could be noticed also, that the order of effectiveness of mitigation schemes remained the same for all topologies.
Figure 6.
Percentage of reduction in switching overvoltages due to different mitigation schemes in each topology.
The effect of increasing the feeder length was also investigated by increasing the length of feeder F1 from 8 to 10 km and 12 km. The increase in feeder length did reduce the switching overvoltage but that reduction was very limited as shown in Fig. 7. The figure shows the level of switching overvoltage for each topology for feeder F1 of 8 km, 10 km and 12 km. it could be seen from the figure that the impact of the feeder length was very limited.
Figure 7.
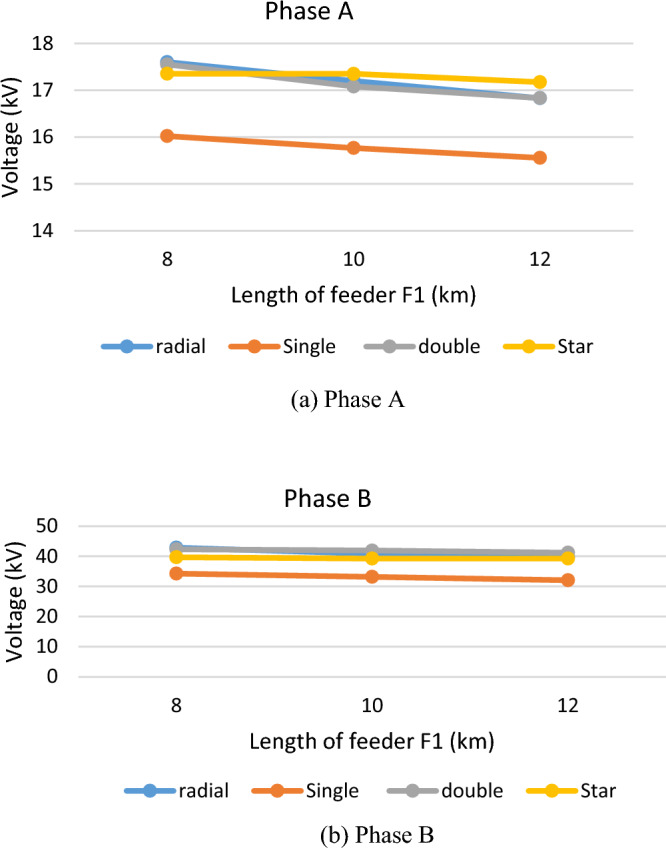
The transient overvoltage in each topology for different lengths of feeder F1.
Conclusions
The expanding utilization of wind farms and their various topologies has mandated the study of the effectiveness of the different overvoltage suppression schemes within each topology. In this study, four different topologies were selected, radial, single sided ring, double sided ring and star topologies. For each topology, the simulation tests showed a significant transient overvoltage showing during the switching of the circuit breaker. To suppress these overvoltages, four different mitigation schemes including pre-insertion resistor (PIR), RC-snubber circuit, R–L choke coil and surge capacitor.
To evaluate the effectiveness of each mitigation scheme, the percentage of reduction in transient overvoltage was computed in each case. The percentage of reduction in switching overvoltage showed the R–L choke coil to be the most effective mitigation scheme with percentage of reduction ranging from 62 to 84%. The PIR, R–C and snubber had a percentage reduction ranging from 33 to 67%, 8 to 25% and 4 to 15% respectively. It could be concluded that the effectiveness of the schemes could be arranged in order of their effectiveness as R–L choke coil, PIR, R–C snubber and surge capacitor respectively. Additional investigation showed the value of R for the choke coil to be highly effective at 50 Ω. The inductance of the choke coil showed high effectiveness at 1.5 mH. The previous R–L values showed a 62–84% which were the highest percentage of reduction among all mitigation measures. Also, it was noticed that changing the wind farm topology did not affect the previous order of effectiveness of mitigation schemes.
Abbreviations
- CB
Circuit breaker
- DSR
Double sided-ring
gm Conductance of the arc
PH Heating power of arc
Po Cooling power
- PIR
Pre-insertion resistor
- Q
Energy stored into the arc
τ Arc time constant
- SSR
Single sided-ring
Author contributions
T.A. and F.W. have participated in (a) conception, analysis and interpretation of the data and (b) drafting the article or revising it critically for important intellectual content.
Funding
Open access funding provided by The Science, Technology & Innovation Funding Authority (STDF) in cooperation with The Egyptian Knowledge Bank (EKB).
Data availability
The data that support the findings of this study are available from the corresponding author upon reasonable request.
Competing interests
The authors declare no competing interests.
Footnotes
Publisher's note
Springer Nature remains neutral with regard to jurisdictional claims in published maps and institutional affiliations.
References
- 1.Holdyk, A., Holbøll, J., Koldby, E., & Jensen, A. Influence of offshore wind farms layout on electrical resonances. In Proceedings of Cigre Session 45, Paris, France (2014).
- 2.Manwell JF, McGowan JG, Rogers AL. Wind Energy Explained, Theory, Design and Application. Wiley; 2010. [Google Scholar]
- 3.Elshahed M, Ragab A, Gilany M, Sayed M. Investigation of switching over-voltages with different wind farm topologies. Ain Shams Eng. J. 2021;12(3):2695–2707. doi: 10.1016/j.asej.2020.10.023. [DOI] [Google Scholar]
- 4.Sweet W. Danish wind turbines take unfortunate turn. IEEE Spectr. 2004;41(11):30–34. doi: 10.1109/MSPEC.2004.1353791. [DOI] [Google Scholar]
- 5.Abdulahovic T, Thiringer T. Voltage stress in a transformer winding during very fast transients caused by breaker closing event. IEEE Trans. Power Deliv. 2014;29(4):1946–1954. doi: 10.1109/TPWRD.2013.2294379. [DOI] [Google Scholar]
- 6.Liljestrand L, Sannino A, Breder H, Thorburn S. Transients in collection grids of large offshore wind parks. Wind Energy. 2008;11:45–61. doi: 10.1002/we.233. [DOI] [Google Scholar]
- 7.Abdulahovic, T. Analysis of high frequency electrical transients in offshore wind parks. In Dep. Energy and Environment. vol. MSc: Chalmers University of Technology (2009).
- 8.Sun Q, Zheng Z, Huang L, Wang F, Zhong L, Chen S. Investigation on reignition probability of switching overvoltage caused by vacuum circuit breaker in offshore wind farms. IEEE Trans. Power Deliv. 2022;37(5):4438–4447. doi: 10.1109/TPWRD.2022.3170586. [DOI] [Google Scholar]
- 9.Xin Y, Zhao B, Liang Q, Zhou J, Qian T, Yu Z, Tang W. Development of improved suppression measures against reignition overvoltages caused by vacuum circuit breakers in offshore wind farms. IEEE Trans. Power Deliv. 2021;37(1):517–527. doi: 10.1109/TPWRD.2021.3064306. [DOI] [Google Scholar]
- 10.Xin Y, Yang YH, Zhao BN, Xu L, Yu ZY, Tang WH. Configuration of suppression schemes against high-frequency transient reignition overvoltages caused by shunt reactor switching-off in offshore wind farms. Int. J. Electr. Power Energy Syst. 2022;141:108170. doi: 10.1016/j.ijepes.2022.108170. [DOI] [Google Scholar]
- 11.Zhou J, Xin Y, Tang W, Liu G, Wu Q. Impact factor identification for switching overvoltage in an offshore wind farm by analyzing multiple ignition transients. IEEE Access. 2019;7:64651–64662. doi: 10.1109/ACCESS.2019.2916952. [DOI] [Google Scholar]
- 12.Said A, Ezzat M, Abd-Allah MA, Fouda MM, Abouelatta MA. Optimization-based on mitigation techniques of the temporary overvoltage in large offshore wind farm. IEEE Access. 2023;11:6320. doi: 10.1109/ACCESS.2023.3236799. [DOI] [Google Scholar]
- 13.Ghasemi S, Allahbakhshi M, Behdani B, Tajdinian M, Popov M. Probabilistic analysis of switching transients due to vacuum circuit breaker operation on wind turbine step-up transformers. Electr. Power Syst. Res. 2020;182:106204. doi: 10.1016/j.epsr.2020.106204. [DOI] [Google Scholar]
- 14.Geng Y, Dong J, Chen X, Zhang L, Yan J, Geng Y, Peng J, Wang K. Three-phase modeling of 40.5-kV vacuum circuit breaker switching off shunt reactors and overvoltage suppression measure analysis. Electr. Power Syst. Res. 2021;194:107058. doi: 10.1016/j.epsr.2021.107058. [DOI] [Google Scholar]
- 15.Akinrinde A, Swanson A, Davidson I. Investigation and mitigation of temporary overvoltage caused by de-energization on an offshore wind farm. Energies. 2020;13(17):4439. doi: 10.3390/en13174439. [DOI] [Google Scholar]
- 16.Xin YL, Tang WH, Zhou JJ, Yang YH, Liu G. Sensitivity analysis of reignition overvoltage for vacuum circuit breaker in offshore wind farm using experiment-based modeling. Electr. Power Syst. Res. 2019;172:86–95. doi: 10.1016/j.epsr.2019.02.008. [DOI] [Google Scholar]
- 17.Li Y, Guo J, Zhang X, Wang S, Ma S, Zhao B, Wu G, Wang T. Over-voltage suppression methods for the MMC-VSC-HVDC wind farm integration system. IEEE Trans. Circuits Syst. II Express Briefs. 2019;67(2):355–359. [Google Scholar]
- 18.Kafshgari NA, Ramezani N, Nouri H. Effects of high frequency modeling & grounding system parameters on transient recovery voltage across vacuum circuit breakers for capacitor switching in wind power plants. Int. J. Electr. Power Energy Syst. 2019;104:159–168. doi: 10.1016/j.ijepes.2018.06.046. [DOI] [Google Scholar]
- 19.Zhang T, Sun L, Zhang Y. Study on switching overvoltage in off-shore wind farms. IEEE Trans. Appl. Supercond. 2014;24:1–5. [Google Scholar]
- 20.Villar, F., Reza, M., Srivastava, K., & Da Silva, L. High frequency transients propagation and the multiple reflections effect in collection grids for offshore wind parks. In IEEE Power and Energy Society General Meeting, Detroit, MI (2011).
- 21.Chennamadhavuni, A., Munji, K. K., & Bhimasingu, R. Investigation of transient and temporary overvoltages in a wind farm. In Auckland: Power System Technology (2012).
- 22.Zheng Z, Sun Q, Yang J, Chen S, Wang F, Zhong L. Investigation on overvoltage caused by vacuum circuit breaker switching off shunt reactor in offshore wind farms. High Voltage. 2022;7(5):936–949. doi: 10.1049/hve2.12231. [DOI] [Google Scholar]
- 23.Guo Y, Jiang X, Chen Y, Zheng M, Liu G, Li X, Tang W. Reignition overvoltages induced by vacuum circuit breakers and its suppression in offshore wind farms. Int. J. Electr. Power Energy Syst. 2020;122:106227. doi: 10.1016/j.ijepes.2020.106227. [DOI] [Google Scholar]
- 24.Sun Q, Zheng Z, Zhang J, Li X, Wang F, Chen S, Zhong L. Investigation on multiple reignitions caused by vacuum circuit breaker switching off shunt reactor considering contact travel in offshore wind farms. IEEE Trans. Power Deliv. 2023;38:2360. doi: 10.1109/TPWRD.2023.3241407. [DOI] [Google Scholar]
- 25.Tao J, Yang Q, Zheng X, He Y, Wang R, Lv H, Zhang J. Switching transients caused by vacuum circuit breakers in collection grids of offshore wind farms. Wind Energy. 2021;24(12):1501–1516. doi: 10.1002/we.2643. [DOI] [Google Scholar]
- 26.Pu Z, Liu H, Wang Y, Yu X, Wu T. Simulation and protection of reignition overvoltage in wind farm considering microscopic dielectric recovery process of vacuum circuit breaker. Energies. 2023;16(4):2070. doi: 10.3390/en16042070. [DOI] [Google Scholar]
- 27.Zhou Z, Guo Y, Jiang X, Liu G, Tang W, Deng H, Li X, Zheng M. Study on transient overvoltage of offshore wind farm considering different electrical characteristics of vacuum circuit breaker. J. Mar. Sci. Eng. 2019;7(11):415. doi: 10.3390/jmse7110415. [DOI] [Google Scholar]
- 28.Gouda OE, Awaad MI, Afifi ZE. Impact of superconducting current limiter on the gaseous HVDC circuit breakers characteristics. Electr. Power Syst. Res. 2021;199:107442. doi: 10.1016/j.epsr.2021.107442. [DOI] [Google Scholar]
- 29.Badran EA, Abd-Allah MA, Hamza AH, Elyan T. A proposed transient recovery voltage mitigation technique for generator-circuit-breaker fed faults. J. Electr. Syst. 2013;9(1):66–72. [Google Scholar]
- 30.Bizak G, Zunko P, Povh D. Combined model of SF6 circuit breaker for use in digital simulation programs. IEEE Trans. Power Deliv. 2004;19(1):174–180. doi: 10.1109/TPWRD.2003.820218. [DOI] [Google Scholar]
- 31.Gouda OE, Amer G, Awaad M, Ahmed M. Cascaded HVDC gaseous circuit breaker performance using black box arc model. Electr. Eng. 2021;103(2):1199–1215. doi: 10.1007/s00202-020-01157-6. [DOI] [Google Scholar]
- 32.Abouelatta MA, Ezzat M, Abd-Allah MA, Said A. Analysis and mitigation of the lightning overvoltage in capacitively coupling grid connected offshore wind turbine. Int. J. Electr. Eng. Inform. 2022;14(2):443–464. [Google Scholar]
- 33.Xin Y, Liu B, Tang W, Wu Q. Modeling and mitigation for high frequency switching transients due to energization in offshore wind farms. Energies. 2016;9(12):1044. doi: 10.3390/en9121044. [DOI] [Google Scholar]
- 34.Ebrahim MA, Elyan T, Wadie F, Abd-Allah MA. Optimal design of RC snubber circuit for mitigating transient overvoltage on VCB via hybrid FFT/Wavelet Genetic approach. Electr. Power Syst. Res. 2017;143:451–461. doi: 10.1016/j.epsr.2016.09.035. [DOI] [Google Scholar]
- 35.Smugala D, Piasecki W, Ostrogorska M, Florkowski M, Fulczyk M, Granhaug O. Wind turbine transformers protection method against high-frequency transients. IEEE Trans. Power Deliv. 2015;30:853–860. doi: 10.1109/TPWRD.2014.2343261. [DOI] [Google Scholar]
- 36.Smugała D, Piasecki W, Ostrogórska M, Florkowski M, Fulczyk M, Granhaug O. New approach to protecting transformers against high frequency transients—wind turbine case study. Prz. Elektrotech. 2013;89:186–190. [Google Scholar]
Associated Data
This section collects any data citations, data availability statements, or supplementary materials included in this article.
Data Availability Statement
The data that support the findings of this study are available from the corresponding author upon reasonable request.


