

Abstract
In this study, the effect of prebiotics such as fructooligosaccharides (FOS), galactooligosaccharides (GOS), isomaltooligosaccharides (IMO), and inulin on the probiotic biomass and its probiotic properties were studied for thermally acclimatized Lactobacillus helveticus (H-45) and Lacticaseibacillus casei N (N-45) strains at 45 ℃ using adaptive laboratory evolution method. Among the prebiotics studied, GOS was found to be more suitable for synbiotic preparation. The tolerance of lactobacilli cultures H-45 and N-45 in the presence of acid and bile were 4.79 and 8.60% and 2.84 and 4.65% higher than their wild-type strains (H-37 and N-37). Similarly, H-45 and N-45 showed an increase in survivability of 5.29 and 8.63% under simulated gastric conditions and 9.21 and 7.70% under simulated intestinal conditions than H-37 and N-37. Propionic acid yield increased by 0.65-fold in N-45 compared to N-37 in the presence of GOS as a prebiotic, whereas H-37 showed 0.26-fold higher propionic acid production than H-45. Thermally acclimatized strain N-45 showed better survivability under stress conditions than H-45. The synbiotic combination of N45 + GOS was spray-dried using corn starch (CS) as carrier material to obtain spray-dried synbiotic powder (N45 + CS + GOS). This synbiotic powder was added to the ready-to-drink (RTD) fruit drinks prepared from five fruit-flavoured squashes (pineapple, orange, grape, mango, and lemon ginger). The varied amounts of added synbiotic powder did not significantly alter the physicochemical properties of the fruit drinks. Hence, synbiotic formulation N45 + GOS + CS may find application in developing various functional foods.
Keywords: Synbiotics, Probiotic properties, Short-chain fatty acids, Spray drying, Ready to drink beverages
Introduction
Probiotics reside in the human colon and exert their action, producing certain compounds and modulating colon micro-flora or immunogenic responses, which improves the host’s health. They might aid in preventing infections, promoting vitamin and cytokine production, reducing cholesterol levels, and even preventing cancer (Strojný et al. 2011). Synbiotics, which combine prebiotics and probiotic microorganisms, provide more benefits than either probiotics or prebiotics alone. Prebiotics are food components that are consumed by beneficial microorganisms. Prebiotics not only promote the growth of beneficial bacteria already present in the GI tract, but they also help in the survival of probiotic bacteria (Dhewa et al. 2014). Inulin, fructo-oligosaccharides (FOS), and galacto-oligosaccharides (GOS) are examples of well-known prebiotics.
GOS is mostly used in special diets for people who are lactose intolerant (Torres et al. 2010). They promote the growth of all probiotics, regulate the intestinal immune system, strengthen the intestinal barrier, inhibit pathogen adhesion, prevent infections and cancer, and improve mineral absorption (Osman et al. 2010). According to the functional identification of genetic loci in lactobacilli, lactose permease (LacS) is the key enzyme in GOS metabolism (Andersen et al. 2011). GOS has been reported to prevent the pathogens like Cronobacter sakazakii and Vibrio cholerae from attaching to the epithelial cell surface receptors (Quintero et al. 2011).
It is important to assess the impact of prebiotic oligosaccharides on probiotics, their growth, and the ability to survive under stress conditions to formulate a successful synbiotic combination (Pranckute et al. 2016). Short-chain fatty acids (SCFAs) are produced by bacterial fermentation of prebiotics and are thought to play a function in neuro-immunoendocrine modulation. SCFAs are organic acids with less than six carbons in their chain, and the most common SCFAs generated by the gastrointestinal tract (GIT) microbiota are acetic, propionic, and butyric acids (Rawi et al. 2020). The importance of SCFAs in the gastrointestinal tract and the associated health benefits have lately blossomed due to growing health awareness (LeBlanc et al. 2017). As a result, people are looking for products that have good sources of health-promoting SCFAs.
The most common SCFAs are acetic acid, propionic acid, and butyric acid in the ratio of 3:1:1 constitutes about 90–95% of total SCFAs produced in the human colon (Ríos-Covián et al. 2016). In patients with inflammatory bowel diseases (IBD), irritable bowel syndrome (IBS), obesity, type 2 diabetes (T2D), an imbalance of the intestinal microbiome, autoimmune disorders, or cancer, and a decrease in the number of bacteria producing metabolites such as SCFAs are common (Hu et al. 2018; Cani 2014). T2D and obesity are characterized by a decrease in a particular group of bacteria and SCFAs, resulting in gut barrier dysfunction, low-grade inflammation, and impaired lipid, glucose, and energy balance (Bhutia and Ganapathy 2015). Acetic acid is generated in larger proportions in the colon than any other SCFAs, and it is required for carbohydrate and lipid metabolism in cells (Layden et al. 2013). Propionic acid inhibits gluconeogenesis and cholesterol synthesis in the liver (Yang et al. 2021). It is beneficial to the human body and may have a role in satiety and energy homeostasis through various processes such as activation of free fatty acid receptors, glucose homeostasis, and lipogenesis reduction (Ranaei et al. 2020). Additionally, butyrate and propionate have been demonstrated to promote the development of T-regulatory cells, which aids in the control of intestinal inflammation; this activity appears to be mediated via the inhibition of histone deacetylation (Louis et al. 2014). It also has anti-inflammatory and antibacterial properties, which help in protecting the human intestine from microorganisms (Havenaar 2011).
Butyric acid exerts the most substantial anti-inflammatory effect of all SCFAs (Markowiak-Kopeć and Śliżewska 2020). For the application of synbiotics, fruit drinks prepared from fruit squashes were used as a carrier. Fruit squashes are gaining popularity compared to synthetic drinks due to their taste, flavour, nutritional content, and shelf life. Squash is a non-alcoholic concentrated syrup produced from fruit juice, water, and sugar or a sugar alternative that is frequently fruit flavoured. It is made up of strained juice with a moderate amount of fruit pulp and sugar added for sweetness.
The objective of this study was to examine the prebiotic potential of four oligosaccharides: galactooligosaccharides (GOS), fructooligosaccharides (FOS), isomaltooligosaccharides (IMO), and inulin to find the best prebiotic for a synbiotic preparation with lactobacilli cultures, Lactobacillus helveticus (H-37) and Lacticaseibacillus casei N (N-37) as wild type strains and their thermally acclimatized strains as Lactobacillus helveticus (H-45) and Lacticaseibacillus casei N (N-45) which was developed using adaptive laboratory evolution method (Bommasamudram et al. 2022a). The impact of prebiotics on probiotic growth, SCFAs production, and the probiotic properties of synbiotic formulations was assessed. The application of synbiotics was evaluated using different concentrations of spray-dried synbiotic powder added to 5 different RTD fruit drinks prepared from fruit squashes and studied for its physiological and chemical characterization.
Materials and methods
Materials
The prebiotic fructooligosaccharides and isomaltooligosaccharides were obtained from Zytex Biotech Pvt. Ltd, Mumbai, India. Galactooligosaccharide was obtained from Vivinal GOS, FrieslandCampina Domo, Paramus, NJ, USA, and inulin (Orafti® Inulin) from Beneo, Mannheim, Germany.
The sodium chloride, potassium chloride, sodium bicarbonate, diethyl ether, hydrochloric acid and sulphuric acid were obtained from Merck, Bengaluru, India. The propionic acid standard was procured from Sigma–Aldrich, Bengaluru, India. Calcium chloride, De Man, Rogosa and Sharpe broth (MRS), pepsin, pancreatin (from exocrine cells of porcine pancreas), agar agar (bacteriological), and ox-bile were procured from Himedia, Mumbai, India. Corn starch was obtained from the local market, Mysuru, India. The fruit squashes were obtained from Rohini’s food products, Chennai, India.
Bacterial cultures
Lactobacillus helveticus NRRL B-4526 (H-37) and Lacticaseibacillus casei N (N-37) were the wild-type strains. These strains were thermally acclimatized (H-45 and N-45) to 45 ℃ by the adaptive laboratory evolution method previously reported by Bommasamudram et al. (2022a). All these lactobacilli strains were grown on MRS medium. The glycerol stocks of all these cultures were maintained at − 20 °C and sub-cultured at least twice in the MRS medium before analysis.
Effect of prebiotics on probiotic biomass
Prebiotic impact on the growth of lactobacilli cultures was analyzed for four oligosaccharides, namely, fructooligosaccharides (FOS), galactooligosaccharides (GOS), isomaltooligosaccharides (IMO), and inulin. The results were compared to probiotic bacteria cultured without these oligosaccharides in the presence of glucose. The lactobacilli cultures were sub-cultured two times in MRS medium for 12 h, and 10% (v/v) inoculum was added to MRS broths, in which glucose was replaced with 2% of prebiotic separately. The cultures were incubated for 48 h at 37 ℃ under static conditions. During fermentation, the samples were withdrawn to measure the optical density at 600 nm and to check the viability by pour plating on MRS agar plates. All experiments were carried out in triplicates. The growth rate was also calculated from the formula (1) (Nunpan et al. 2019):
| 1 |
where Nt: number of bacteria at final time point “t,” N0: number of bacteria at the initial time point “t0”, t: final time point, and t0: initial time point.
Effect of prebiotic (GOS) on the probiotic properties
GOS was chosen as a prebiotic for further research based on the findings of the previous investigations. The effect of prebiotics on the probiotic properties like acid tolerance, bile tolerance, simulated gastric, and simulated intestinal juice conditions was studied for both wild types (H-37 and N-37) and acclimatized strains (H-45 and N-45). For the growth of lactobacilli in this experiment, glucose in MRS media composition was replaced with GOS.
Effect of GOS on tolerance to acid, bile, simulated gastric and intestinal fluids of lactobacilli cultures.
The tolerance of lactobacilli cultures to acid, bile, and simulated gastric and intestinal fluids was evaluated as described by Bommasamudram et al. (2022a). For acid tolerance, the pH of MRS broth was adjusted to 2.0 and 3.0 using 0.1 N hydrochloric acid, and 1.0 and 0.3% w/v Ox-bile were added to the broth for bile tolerance. MRS broth with a pH of 6.50 was used as a control. The absorbance of overnight grown wild-type and acclimatized cultures was adjusted to 1.0 OD (Spectrophotometer, Shimadzu, model-UV1800, Kyoto, Japan) and inoculated in the respective modified MRS broth and incubated at 37 °C with agitation (180 rpm, Infors HT Ecotron, Ecotron Co., Ltd, Seoul). Aliquots were taken at 0, 1, 2, and 3 h intervals, serially diluted, and pour plated onto MRS agar, then incubated at 37 °C for 48 h.
For the simulated gastric fluid tolerance test, gastric juice (0.125 mol/L sodium chloride, 0.007 mol/L potassium chloride, 0.045 mol/L sodium bicarbonate, and 3 g/L pepsin) was prepared with pH adjusted to 2.5 and pH 7.0 was used as control. Similarly, for the simulated intestinal fluid tolerance test, the simulated intestinal fluid composed of ox-bile 0.15% (w/v) and pancreatin 0.1% (w/v) adjusted to pH 8.0 and pH 7.0 (control) was used for the study. The overnight-grown lactobacilli cultures with 1.0 O.D absorbance were inoculated, and incubated at 37 °C at the agitation of 180 rpm. Aliquots were taken at intervals of 0, 1, 2, and 3 h for gastric juice and up to 6 h for intestinal juice and serially diluted, pour-plated on MRS agar plates.
The pour-plated MRS agar plates were incubated at 37 °C for 48 h, and the survival percentage was calculated. The colony counts were obtained and expressed as mean ± standard deviation (SD). Survivability percentage was calculated using the formula (2):
| 2 |
CFU assay is the cell count in acid/bile/simulated fluid conditions, and CFU control is the cell count of control samples.
Determination of SCFAs
The 18 h grown bacterial strain was inoculated in fresh MRS broth in which glucose was replaced with GOS and incubated at 37 ℃ for 24 h under anaerobic conditions. After incubation, the culture was centrifuged at 8000×g, and 2 mL of supernatant was transferred into fresh glass vials. 400 µL of 50% sulphuric acid and 0.8 g of sodium chloride were added to the supernatant and vortexed for 30 s. Then 2 mL of diethyl ether was added to the above solution and inverted gently about 20–30 times and centrifuged at 1000–2000×g for 10 min. The organic phase was carefully transferred to a new glass vial, with 1/4 of the vial pre-filled with calcium chloride and allowed to settle for 5 min. Then the clear supernatant was transferred into another fresh glass vial and allowed to dry at 30 ℃. Finally, 50 µL of diethyl ether was added to the sample before injecting it into GC–MS (gas chromatography–mass spectrometry) for analysis (Pessione et al. 2015). For propionic acid quantification, 10–100 mg/L concentration of propionic acid was added to the freshly autoclaved 1 mL of MRS broth and extracted as mentioned above.
The extracted SCFAs were analyzed using GC–MS Clarus 500 quadrupole (PerkinElmer, Massachusetts, USA). The column used to separate the SCFAs in gas-chromatography was the DB-Wax column (30 m × 0.25 mm × 0.25 µm). One microliter of liquid was injected in the split mode at a ratio of 20:1. The solvent delay time was 3 min. The initial oven temperature of 70 ℃ was maintained for 3 min, raised to 150 ℃ at 5 ℃/min, and increased to 220 ℃ at 20 ℃/min. Helium was used as a carrier gas at a constant flow rate of 1 mL/min through the column. The injector, transfer, ion source, and quadrupole temperatures were maintained at 230, 200, 180, and 280 ℃, respectively. The ionization was carried out in the electron impact (EI) mode at 70 eV. The obtained mass spectrum was compared with the original entries in the database using TurboMass software. The obtained GC–MS spectrum was compared to the NIST chemistry webbook to identify and confirm the chemical compound.
Spray drying of synbiotic
The L. casei (N) cells were grown in a benchtop bioreactor (New Brunswick, Model-Bioflo 110, Minnesota, USA) in MRS media at 45 ℃ for 24 h. The cells were harvested using a Westfalia separator. The harvested cells were washed with saline (0.85% of NaCl). Then 5% of thermally adapted L. casei (N-45) cells were mixed with 2.5% of GOS (prebiotic), 10% of corn starch, and spray dried using pilot-scale spray-drier (BE 1216, Bowen Engineering, Indianapolis, USA) with 120 ℃ of inlet temperature and outlet temperature of 60–70 ℃. The spray-dried synbiotic powder (N45 + GOS + CS) was packed in polyethylene bags and stored at 4 ℃ (Bommasamudram et al. 2022b).
Scanning electron microscopy of spray dried synbiotic
Scanning electron microscopy (SEM) was used to study the morphology of spray-dried synbiotic powder with corn starch as carrier material (Leo 435 Vp, Leo Electronics Systems, Cambridge, UK). The spray-dried powder was placed on copper grids and coated with gold particles, and observed under SEM.
Preparation of RTD fruit drinks from squashes and incorporation of synbiotics
The five different fruit squash drinks (pineapple, orange, grape, mango, and lemon ginger) were prepared according to the manufacturer’s instructions. Briefly, one part of squash was mixed with three parts of chilled water to make a fruit drink from squash. The diluted fruit drink was added with three different concentrations of spray-dried synbiotic powder. The three concentrations were 75 mg, 100 mg, and 125 mg. The 75 mg powder corresponds to 750 × 109 CFU, 100 mg corresponds to 1 × 10¹², and 125 mg corresponds to 1.25 × 10¹² CFU, which was added to 100 mL of fruit drink per serving.
Physico-chemical analysis of RTD fruit drinks from squash
The effect of different concentrations of spray-dried synbiotic powder on pH, total soluble solids (TSS), and titrable acidity (TA) in five different fruit drinks (pineapple, orange, grape, mango, and lemon ginger) was evaluated. The pH was measured in triplicates using a digital pH meter 145 (EuTech Instruments, Singapore). The total soluble solids (TSS) of samples were determined using a hand-held refractometer (V-Tech instruments, Bangalore, India) and represented as oBrix.
The total titratable acidity (TA) of RTD fruit drinks was calculated by a standard method (AOAC 2000) and expressed as a percentage of lactic acid. Briefly, 1 mL of beverage was taken in a clean glass conical flask with 25 mL of distilled water, 3 drops of phenolphthalein indicator were added and titrated against 0.1N NaOH (sodium hydroxide) until the sample reached its endpoint. The titrable acidity (TA) was calculated according to the formula (3):
| 3 |
where A = volume of 0.1 N NaOH was used for titration and V = volume of the sample taken for the test.
Colour analysis
The colour of RTD fruit drinks was determined using a Minolta CR300 colorimeter (Tokyo, Japan) by CIELAB colour system. The illuminant D65 was used to calibrate the colorimeter, and measurements were taken through an 8-mm port/viewing area. Three colour parameters were assessed using a reflectance instrument: lightness (L*), redness (a*), and yellowness (b*). The chroma (C*), a quantitative attribute of colourfulness, is used to assess the degree of difference between a hue and a grey colour of the same lightness. The colour intensity of samples seen by humans is proportional to their chroma values. The chroma was calculated according to the formula (4) (Costa et al. 2017):
| 4 |
Hue angle (h0), a qualitative characteristic of colour, is the attribute by which colours are historically classified as reddish, greenish, and so on, and it is used to define the difference between a certain colour with reference to grey colour of the same lightness. It was calculated according to the formula (5):
| 5 |
The effect of different concentrations of spray-dried synbiotic powder on the colour attribute of five fruit drinks prepared from squash was also evaluated.
Statistical analysis
All the tests were performed in triplicate. The data were presented as mean ± standard deviations. GraphPad Prism 9.0.0 was used to analyze the data using two-way ANOVA (analysis of variance). Multiple tests of Tukey’s test with a significance level of p < 0.05 were used to compare the differences between mean values.
Results and discussion
Effect of prebiotics on probiotic biomass
Prebiotics are dietary components selectively fermented by beneficial bacteria and confer a health benefit. The study was focused on the selection of a prebiotic for wild-type (H-37 and N-37) and acclimatized probiotic strains (H-45 and N-45) to prepare a synbiotic formulation. In all lactobacilli cultures, strains grown on GOS produced more biomass than strains grown on FOS, IMO, or inulin (Fig. 1). Similar results were reported by Mumcu and Temiz (2014).
Fig. 1.
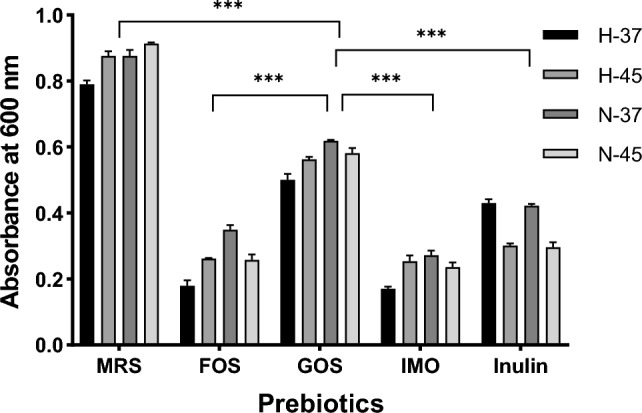
Effect of FOS (fructooligosaccharides), GOS (galactooligosaccharides), IMO (isomaltooligosaccharides) and inulin on probiotic biomass. All values are mean ± standard deviation with a significance of ***p < 0.001
The individual cultures of lactobacilli, grown in the prebiotics-free MRS medium, i.e., supplemented with 2% of glucose, showed a growth rate of 0.53 ± 0.06 h−1, 0.36 ± 0.04 h−1 for H-37, and H-45, 0.52 ± 0.09 h−1, 0.38 ± 0.15 h−1 for N-37 and N-45. In all lactobacilli cultures, the most substantial decrease in growth rate was observed in the medium containing IMO (Table 1). The bacterial growth rate measures a bacteria’s ability to multiply and grow in the medium. Even though both wild-type and acclimatized lactobacilli cultures can utilize all prebiotics, the biomass of potential probiotic cultures was decreased in the presence of prebiotics when compared to the control (grown on glucose). The lactobacilli cultures could not utilize IMO effectively. Most of the research on IMO utilization by microorganisms has been focused on the Bifidobacterium genus (Pokusaeva et al. 2009; Vernazza et al. 2006). According to Pokusaeva et al. (2011), Bifidobacterium has two enzymes α-glucosidase and sucrose phosphorylase, which are unique to this genus and play a major role in the metabolism of the prebiotics.
Table 1.
Growth rate of lactobacilli cultures in the presence of different prebiotics
| Growth rate (h−1) | |||||
|---|---|---|---|---|---|
| Cultures | GOS | FOS | IMO | Inulin | MRS (control) |
| H-37 | 0.37 ± 0.05a | 0.13 ± 0.01a | 0.34 ± 0.10a | 0.18 ± 0.05a | 0.53 ± 0.06a |
| H-45 | 0.33 ± 0.02a | 0.07 ± 0.01a | 0.24 ± 0.08a | 0.03 ± 0.01a | 0.36 ± 0.04a |
| N-37 | 0.46 ± 0.02a | 0.15 ± 0.05a | 0.19 ± 0.04a | 0.04 ± 0.07a | 0.52 ± 0.05a |
| N-45 | 0.41 ± 0.05a | 0.07 ± 0.02a | 0.06 ± 0.08a | 0.05 ± 0.06a | 0.38 ± 0.15a |
Means followed by the same letter do not differ statistically from each other by Tukey’s test with significance p < 0.01 (n = 3)
Effect of GOS on probiotic properties of lactobacilli cultures
Based on the above study, it was found that GOS would be an appropriate prebiotic in synbiotic formulations. Further, the effect of GOS on probiotic properties like acid tolerance, bile tolerance, and simulated gastric and intestinal juices was studied. The interactions of prebiotics and probiotics were observed to be strain dependent.
All lactobacilli cultures showed better survivability under low acidic conditions (Table 2). The thermally acclimatized H-45 and N-45 strains showed an increase of 0.36 and 0.68 log CFU/mL compared to its wild-type strains. In the presence of different bile concentrations (0.3 and 1 percent), the survivability of both adapted bacteria was found to be 0.20 and 0.34 log CFU/mL, which was higher than that of control strains (Table 2).
Table 2.
Survivability of probiotics under acid, bile, and simulated gastric and intestinal fluid conditions in the presence of GOS
| Time period | CFU/mL | |||||
|---|---|---|---|---|---|---|
| H-37 | H-45 | N-37 | N-45 | |||
| Acid tolerance | pH 2.0 | 0h | 8.49 ± 0.34aA | 8.30 ± 0.12aA | 8.67 ± 0.25aA | 8.28 ± 0.33aA |
| 1h | 7.52 ± 0.22aB | 7.66 ± 0.33aB | 8.13 ± 0.28aA | 8.02 ± 0.18aA | ||
| 2h | 7.34 ± 0.24aB | 7.51 ± 0.44aB | 7.85 ± 0.32aA | 7.95 ± 0.36aA | ||
| 3h | 7.51 ± 0.35bB | 7.87 ± 0.21bB | 7.90 ± 0.23bA | 8.58 ± 0.18aA | ||
| pH 3.0 | 0h | 8.53 ± 0.44aA | 8.46 ± 0.39aA | 8.43 ± 0.22aA | 8.65 ± 0.38aA | |
| 1h | 7.97 ± 0.18aA | 7.89 ± 0.12aA | 8.57 ± 0.41aA | 7.99 ± 0.19aA | ||
| 2h | 7.57 ± 0.13aB | 7.82 ± 0.19aA | 8.03 ± 0.05aA | 7.57 ± 0.28aA | ||
| 3h | 7.99 ± 0.11aA | 8.25 ± 0.25aA | 8.15 ± 0.22aA | 8.45 ± 0.38aA | ||
| Bile tolerance | 0.3% | 0h | 7.12 ± 0.24aA | 7.58 ± 0.35aA | 7.62 ± 0.16aA | 7.82 ± 0.32aA |
| 1h | 6.95 ± 0.32aA | 7.36 ± 0.39aA | 7.51 ± 0.51aA | 7.11 ± 0.27aB | ||
| 2h | 6.78 ± 0.12aA | 7.14 ± 0.29aA | 7.25 ± 0.25aA | 7.01 ± 0.22aB | ||
| 3h | 7.02 ± 0.16bA | 7.22 ± 0.22bA | 7.30 ± 0.15bA | 7.64 ± 0.10aA | ||
| 1.0% | 0h | 8.58 ± 0.36aA | 8.02 ± 0.03bA | 7.96 ± 0.22bA | 8.29 ± 0.17aA | |
| 1h | 5.73 ± 0.30aB | 5.69 ± 0.18aB | 5.83 ± 0.54aB | 5.89 ± 0.28aB | ||
| 2h | 4.45 ± 0.27bC | 5.51 ± 0.14aB | 4.51 ± 0.24bC | 4.73 ± 0.11bD | ||
| 3h | 4.15 ± 0.17cC | 4.60 ± 0.14bC | 4.62 ± 0.21bC | 5.18 ± 0.28aC | ||
| Simulated gastric fluid | pH 2.5 | 0h | 7.70 ± 0.32aA | 7.91 ± 0.28aA | 7.55 ± 0.29aA | 7.83 ± 0.12aA |
| 1h | 7.01 ± 0.41aA | 7.65 ± 0.36aA | 7.44 ± 0.32aA | 7.53 ± 0.29aA | ||
| 2h | 7.26 ± 0.35aA | 7.57 ± 0.22aA | 7.11 ± 0.17aA | 7.41 ± 0.43aA | ||
| 3h | 7.17 ± 0.11bA | 7.55 ± 0.18bA | 7.30 ± 0.35bA | 7.93 ± 0.11aA | ||
| pH 7.0 | 0h | 7.97 ± 0.22aA | 7.41 ± 0.35aA | 7.86 ± 0.16aA | 7.90 ± 0.10aB | |
| 1h | 7.92 ± 0.40aA | 7.39 ± 0.35aA | 7.84 ± 0.28aA | 7.98 ± 0.14aB | ||
| 2h | 6.93 ± 0.15aB | 7.34 ± 0.26aA | 7.61 ± 0.33aA | 7.63 ± 0.28aB | ||
| 3h | 7.12 ± 0.29aB | 7.41 ± 0.36aA | 8.03 ± 0.33aA | 8.47 ± 0.21aA | ||
| Simulated intestinal fluid | pH 8.0 | 0h | 8.53 ± 0.36aA | 8.25 ± 0.31aA | 8.51 ± 0.48aA | 8.64 ± 0.19aA |
| 1h | 7.21 ± 0.18bB | 7.95 ± 0.44aA | 7.98 ± 0.12aA | 7.88 ± 0.38aB | ||
| 2h | 7.32 ± 0.36aB | 7.51 ± 0.22aA | 7.28 ± 0.11aA | 7.61 ± 0.25aB | ||
| 3h | 7.46 ± 0.31aB | 7.85 ± 0.50aA | 7.49 ± 0.33aA | 7.72 ± 0.23aB | ||
| 6h | 5.32 ± 0.27bC | 5.81 ± 0.15aB | 5.45 ± 0.19bB | 5.87 ± 0.11aC | ||
| pH 7.0 | 0h | 8.21 ± 0.39aA | 8.11 ± 0.22aA | 8.15 ± 0.38aA | 8.40 ± 0.13aA | |
| 1h | 7.95 ± 0.42aA | 7.81 ± 0.48aA | 8.05 ± 0.68aA | 8.11 ± 0.19aA | ||
| 2h | 7.74 ± 0.33aA | 7.79 ± 0.28aA | 7.91 ± 0.41aA | 7.86 ± 0.41aA | ||
| 3h | 7.81 ± 0.28aA | 7.89 ± 0.25aA | 7.96 ± 0.32aA | 8.06 ± 0.45aA | ||
| 6h | 7.11 ± 0.22aB | 7.48 ± 0.18aA | 7.25 ± 0.26aA | 7.72 ± 0.09aA | ||
Means followed by the same letter, lowercase in the row and the uppercase in the column, do not differ statistically from each other by Tukey’s test with significance p < 0.01 (n = 3)
Further, both the thermally adapted and wild-type lactobacilli cultures were tested for their survivability under simulated gastric and simulated intestinal fluids conditions. Under simulated gastric conditions, H-45 showed a 0.38 log CFU/mL increase in its survivability (Table 2), whereas N-45 showed a 0.63 log CFU/mL survivability increase than its wild-type strain (N-37). Similarly, under simulated intestinal fluid conditions, an increase of 0.49 and 0.42 log CFU/mL survivability was observed in H-45 and N-45 compared to H-37 and N-37 (Table 2). Önal Darilmaz et al. (2019) reported that in the presence of inulin, L. fermentum IP5 had higher oxalate degrading ability. Prebiotics are heterogenous dietary fibers with different physicochemical properties and degrees of polymerization. To metabolize prebiotics by bacteria, especially β 1 → 6, β 1 → 3, or β 1 → 4, cleaving enzymes are needed, which could be one of the reasons for differences in the probiotic properties of all lactobacilli cultures. The energy supplied in the cell could be preferentially used to produce enzymes responsible for changes in probiotic properties (Önal Darilmaz et al. 2019).
SCFAs production by lactobacilli
The SCFAs-producing ability of potential probiotic cultures was investigated in this study using GC–MS. All four lactobacilli cultures (H-37, N-37, H-45, and N-45) in the presence of GOS were able to produce SCFAs: acetic acid, propionic acid, isobutyric acid, butyric acid, and isovaleric acid. Among the cultures, wild-type L. helveticus (H-37) (Fig. 2a) was found to produce the highest concentration of propionic acid 0.27 g/L, whereas thermally acclimatized H-45 (Fig. 2b) showed 0.07 g/L. In the case of L. casei (N-37), the thermally acclimatized N-45 (Fig. 2d) showed a 0.65-fold increase in propionic acid (0.14 g/L), when compared to the wild-type N-37 (0.27 g/L) (Fig. 2c). The results showed a higher acetic acid production in all the lactobacilli cultures studied, which is related to the heterofermentative characteristic of LAB (Hati et al. 2019). The identification of SCFAs analytes was carried out using the spectra matching with the NIST (National Institute of Standards and Technology) library and the retention time.
Fig. 2.

GC–MS spectrum of SCFAs produced by a H-37 b H-45 c N-37 d N-45
SEM analysis of spray-dried synbiotic
A micrograph of spray-dried synbiotic powder is shown in Fig. 3. On the surface of microparticles, there were no cracks or fractures, indicating that probiotic bacteria were well protected. In a microstructural view, the spray-dried powder (N45 + GOS + CS) showed partially spherical particles with concavities. Similar results were reported by Rajam and Anandharamakrishnan (2015).
Fig. 3.
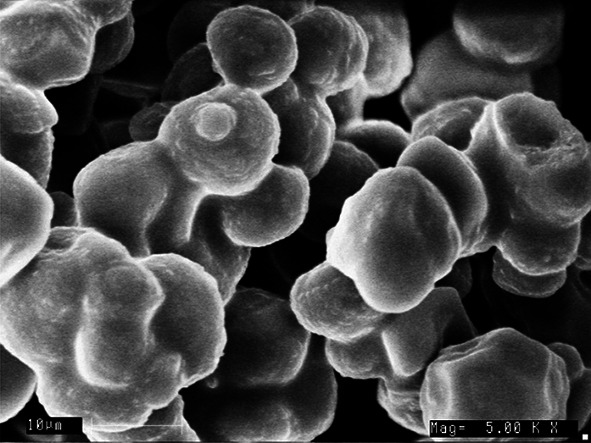
Scanning electron micrograph of spray-dried synbiotic powder (N45 + CS + GOS) under 5000× magnification
Physico-chemical properties of synbiotic RTD fruit drinks prepared from squash
In the current study, different concentrations of synbiotic formulation (N45 + GOS + CS) were added to the RTD fruit drinks made from squash, and its overall acceptability was analyzed. In all the different fruit drinks (pineapple, orange, grape, mango, and lemon ginger), with the increase in the concentration of synbiotic powder, there was no significant (p > 0.05) change in pH was observed. The pH of all five different RTD fruit drinks was in the range of 2.5–3.2 (Table 3), which is the standard pH maintained in the squash by the addition of citric acid. The pH was maintained in acidic conditions to prevent the growth of microorganisms in the food product (Syed et al. 2012).
Table 3.
A pH, total soluble solids (TSS), and titrable acidity (TA) of different synbiotic RTD fruit drinks prepared from squash
| Samples | Pineapple | Orange | Grape | Mango | Lemon ginger | |
|---|---|---|---|---|---|---|
| pH | Control | 2.97 ± 0.05a | 2.76 ± 0.01a | 2.96 ± 0.01a | 3.17 ± 0.06a | 2.52 ± 0.01a |
| 75mg | 2.95 ± 0.07a | 2.75 ± 0.01a | 3.01 ± 0.04a | 3.16 ± 0.04a | 2.54 ± 0.02a | |
| 100 mg | 2.99 ± 0.01a | 2.77 ± 0.02a | 3.01 ± 0.04a | 3.23 ± 0.02a | 2.62 ± 0.13a | |
| 125mg | 2.97 ± 0.08a | 2.76 ± 0.02a | 3.06 ± 0.06a | 3.18 ± 0.06a | 2.60 ± 0.10a | |
| Total soluble solids (TSS- °BX) | Control | 18.00 ± 0.01c | 15.90 ± 0.02c | 17.10 ± 0.04a | 14.90 ± 0.01a | 19.80 ± 0.01a |
| 75mg | 18.00 ± 0.01c | 16.80 ± 0.01a | 17.00 ± 0.04a | 14.90 ± 0.01a | 19.80 ± 0.02a | |
| 100 mg | 19.00 ± 0.02b | 16.80 ± 0.01a | 17.05 ± 0.07a | 14.90 ± 0.02a | 19.80 ± 0.01a | |
| 125mg | 19.00 ± 0.01a | 16.50 ± 0.02b | 17.00 ± 0.02a | 14.90 ± 0.03a | 19.80 ± 0.01a | |
| Titrable acidity (TA%) | Control | 9.60 ± 0.00a | 9.60 ± 0.01a | 9.60 ± 0.02a | 9.60 ± 0.00a | 9.60 ± 0.02a |
| 75mg | 9.60 ± 0.01a | 9.60 ± 0.02a | 9.60 ± 0.02a | 9.60 ± 0.02a | 9.60 ± 0.01a | |
| 100 mg | 9.60 ± 0.01a | 9.60 ± 0.02a | 9.60 ± 0.01a | 9.60 ± 0.01a | 9.60 ± 0.01a | |
| 125mg | 9.60 ± 0.02a | 9.60 ± 0.01a | 9.60 ± 0.01a | 9.60 ± 0.02a | 9.60 ± 0.01a |
All values are mean ± standard deviation. Means followed by the same letter do not differ statistically from each other by Tukey test with significance p < 0.01 (n = 3)
From Table 3, it was observed that in the pineapple fruit drink, with the increase in the concentration of synbiotic powder, the TSS % was also increased. In the case of orange fruit drinks, only the higher concentration of (125 mg/100 mL) influenced the TSS in the product. The TSS in grape, mango, and lemon ginger was not altered by the addition of the synbiotic powder (Table 3).
The titrable acidity (TA) was evaluated for all the fruit drinks prepared from squash (Table 3). All the fruit drinks had a TA of 9.6%. And the different concentrations of synbiotic powder did not show any significant (p > 0.05) influence on titrable acidity in all fruit drinks.
Colour analysis of synbiotic RTD fruit drinks prepared from squash
The spray-dried synbiotic powder significantly influences the colour attributes of five different fruit drinks (pineapple, orange, grape, mango, and lemon ginger). An increase in the concentration of synbiotic powder showed a significant (p < 0.05) increase a* values and a decrease in lightness L* in all five fruit drink samples. Different concentrations of synbiotic powder added to fruit drinks had different effects on each fruit drink. The chroma (C*) did not show any significant change with the increase in powder concentration in pineapple drinks (Table 4). In the lemon ginger drink, C* values were significantly increased and proportional to the concentration of added synbiotic powder (Table 4). Whereas, in orange, grape, and mango fruit drinks the C* values were significantly reduced with an increase in concentrations of synbiotic powder (Table 4).
Table 4.
Colour analysis of synbiotic pineapple, orange, grape, mango, and lemon ginger fruit Drinks
| Samples | L* (D65) | a* (D65) | b* (D65) | dE*ab (D65) | Chroma (C*) | Hue angle (h0) | |
|---|---|---|---|---|---|---|---|
| Pineapple | Control | 95.14 ± 0.28a | − 11.78 ± 0.06a | 115.56 ± 0.35a | 116.24 ± 0.35a | 116.16 ± 0.36a | − 9.81 ± 0.02b |
| 75mg | 93.61 ± 0.53b | − 10.18 ± 0.30b | 115.55 ± 0.08a | 116.15 ± 0.08a | 115.99 ± 0.05a | − 11.36 ± 0.34a | |
| 100 mg | 92.39 ± 0.30c | − 9.56 ± 0.13c | 114.65 ± 0.23a | 115.28 ± 0.22b | 115.05 ± 0.24a | − 11.99 ± 0.14a | |
| 125mg | 92.13 ± 0.36d | − 9.33 ± 0.16d | 114.53 ± 0.08a | 115.16 ± 0.08b | 114.91 ± 0.10a | − 12.28 ± 0.21a | |
| Orange | Control | 82.08 ± 2.50a | 22.56 ± 1.10b | 98.25 ± 0.60a | 102.38 ± 0.25a | 100.80 ± 0.83a | 4.36 ± 0.19a |
| 75mg | 77.14 ± 0.17b | 23.64 ± 0.25a | 95.34 ± 0.68b | 100.83 ± 0.74b | 98.23 ± 0.72b | 4.03 ± 0.01b | |
| 100 mg | 76.39 ± 0.80b | 23.64 ± 0.08a | 94.56 ± 0.72b | 100.28 ± 0.50b | 97.47 ± 0.72b | 4.00 ± 0.02b | |
| 125mg | 74.65 ± 0.23c | 23.77 ± 0.07a | 93.40 ± 0.08c | 99.64 ± 0.16b | 96.38 ± 0.10c | 3.93 ± 0.01b | |
| Grape | Control | 19.18 ± 0.08a | 45.63 ± 0.17a | 33.07 ± 0.14a | 98.53 ± 0.06a | 56.35 ± 0.22a | 0.72 ± 0.01a |
| 75mg | 17.28 ± 0.10b | 43.53 ± 0.18b | 29.80 ± 0.18b | 98.11 ± 0.05b | 52.75 ± 0.25b | 0.68 ± 0.00b | |
| 100 mg | 17.04 ± 0.14c | 43.43 ± 0.33b | 29.39 ± 0.25b | 98.14 ± 0.10b | 52.44 ± 0.41b | 0.68 ± 0.02b | |
| 125mg | 16.62 ± 0.11d | 42.79 ± 0.32b | 28.64 ± 0.18c | 98.01 ± 0.11b | 51.49 ± 0.37c | 0.67 ± 0.00c | |
| Mango | Control | 81.65 ± 2.13a | 3.63 ± 0.16b | 107.00 ± 2.67a | 108.62 ± 2.27a | 107.06 ± 2.67a | 29.52 ± 2.00a |
| 75mg | 79.07 ± 0.64a | 4.24 ± 0.09a | 105.38 ± 0.62a | 107.50 ± 0.48a | 105.46 ± 0.61a | 24.89 ± 0.69b | |
| 100 mg | 78.67 ± 0.06a | 4.32 ± 0.07a | 105.13 ± 0.37a | 107.33 ± 0.35a | 105.21 ± 0.38a | 24.34 ± 0.31b | |
| 125mg | 77.23 ± 0.35a | 4.40 ± 0.11a | 103.43 ± 0.06b | 105.98 ± 0.02b | 103.52 ± 0.05b | 23.54 ± 0.58b | |
| Lemon ginger | Control | 97.07 ± 0.22a | − 0.46 ± 0.04a | 7.45 ± 0.17b | 8.00 ± 0.24c | 7.46 ± 0.17b | − 16.25 ± 1.13d |
| 75mg | 94.82 ± 0.35b | 0.09 ± 0.04d | 8.40 ± 0.04a | 9.85 ± 0.16b | 8.40 ± 0.04a | 108.02 ± 3.55a | |
| 100 mg | 93.65 ± 0.61b | 0.21 ± 0.02c | 8.68 ± 0.11a | 10.75 ± 0.45a | 8.68 ± 0.11a | 42.54 ± 3.85b | |
| 125mg | 93.23 ± 0.43b | 0.25 ± 0.01b | 8.88 ± 0.06a | 11.16 ± 0.22a | 8.88 ± 0.06a | 35.58 ± 2.24c |
All values are mean ± standard deviation. Means followed by the same letter do not differ statistically from each other by the Tukey test with significance p < 0.01 (n = 3)
Conclusion
The ability of probiotic bacteria to utilize prebiotics varies from strain to strain. Based on the results, it was concluded that GOS is a suitable prebiotic for synbiotic formulations for both wild types (H-37 and N-37) and acclimatized strains (H-45 and N-45). GOS promotes the growth of all lactobacilli cultures compared to other prebiotics used. After encapsulation, prebiotics can shield probiotic bacteria from a variety of physical and environmental challenges that would normally kill the free-living bacteria. In addition, the synbiotic had shown better acid and bile tolerance under low pH and high concentrations of bile salts. Another important probiotic property, i.e., the survivability of probiotics in the gastrointestinal tract, was positively influenced by the presence of GOS. SCFAs have been discovered to have a vital role in the body’s physiological and pathological processes (LeBlanc et al. 2017). When GOS was used as the sole carbon source, the thermally acclimatized N-45 and the wild-type H-37 showed enhanced propionic acid synthesis among the four lactobacilli cultures (H-37, N-37, H-45, and N-45) studied. The significant increase in biomass and SCFAs due to GOS fermentation by potential probiotic cultures may have a beneficial effect on the host’s health, albeit more in vivo research is needed to back up this hypothesis. It was evident that the physico-chemical properties were not altered by the different concentrations of synbiotics in all five flavoured fruit drinks. It can be concluded that RTD fruit drinks can be used as one of the mediums of consumption for beneficial lactic acid bacteria. This product can be used as a synbiotic beverage by vegetarians and individuals who are allergic to dairy products.
Synbiotics used as functional foods are now being considered important tools to help maintain humans and animals in good health and for the prevention of disease. Despite their positive impact on health, more investigation is required to understand their mechanism of action for promoting health and regulating disorders. The challenges in the preparation of the beverages can be exploited further by adding active prebiotic compounds that stimulate the growth of probiotics to potentially extend their beneficial health properties. It has also been proposed that various food products can be employed as carriers for synbiotics in the context of a proactive medicine approach to disease prevention and their therapy in a wide range of applications.
Acknowledgements
One of the authors, JB, gratefully acknowledges Council of Scientific Industrial Research-Senior Research Fellowship (CSIR-SRF), New Delhi (File No: 31/5 (542)/2017-EMR-I).
Author contributions
JB: conceptualization; data curation; formal analysis; investigation; methodology; writing-original draft. AM: investigation and data curation of RTD fruit drinks. SD: conceptualization; supervision; methodology; writing-review & editing. All the authors read and approved the final manuscript.
Funding
This study was funded by CSIR, New Delhi, India (Grant No.31/5 (542)/2017-EMR-I).
Data availability
All data generated or analyzed during this study are included in this published article.
Declarations
Conflict of interest
The authors declare that they have no conflict of interest in the publication.
Contributor Information
Jyothna Bommasamudram, Email: jyothsna08may@gmail.com.
Arjun Muthu, Email: arjunvmuthu@gmail.com.
Somashekar Devappa, Email: somashekar@cftri.res.in.
References
- Andersen JM, Barrangou R, Hachem MA, Lahtinen S, Goh YJ, Svensson B, Klaenhammer TR. Transcriptional and functional analysis of galactooligosaccharide uptake by lacS in Lactobacillus acidophilus. Proc Natl Acad Sci USA. 2011;108:17785–17790. doi: 10.1073/pnas.1114152108. [DOI] [PMC free article] [PubMed] [Google Scholar]
- AOAC 17th edn (2000) AOAC Official method 942.15 Acidity (Titrable) of fruit products. A. Indicator method. 37:11. https://www.dspace.espol.edu.ec/bitstream/123456789/25528/7/ANEXO%205%20942.15.pdf
- Bhutia YD, Ganapathy V. Short, but smart: SCFAs train T cells in the gut to fight autoimmunity in the brain. Immunity. 2015;43:629–631. doi: 10.1016/j.immuni.2015.09.014. [DOI] [PMC free article] [PubMed] [Google Scholar]
- Bommasamudram J, Kumar P, Kapur S, Sharma D, Devappa S. Development of thermotolerant lactobacilli cultures with improved probiotic properties using adaptive laboratory evolution method. Probiotics Antimicrob. 2022 doi: 10.1007/s12602-021-09892-3. [DOI] [PubMed] [Google Scholar]
- Bommasamudram J, Muthu A, Devappa S. Effect of sub-lethal heat stress on viability of Lacticaseibacillus casei N in spray-dried powders. LWT Food Sci Technol. 2022;155:112904. doi: 10.1016/j.lwt.2021.112904. [DOI] [Google Scholar]
- Cani PD. Metabolism in 2013: the gut microbiota manages host metabolism. Nat Rev Endocrinol. 2014;10:74–76. doi: 10.1038/nrendo.2013.240. [DOI] [PubMed] [Google Scholar]
- da Costa GM, de Carvalho Silva JV, Mingotti JD, Barão CE, Klososki SJ, Pimentel TC. Effect of ascorbic acid or oligofructose supplementation on L. paracasei viability, physicochemical characteristics and acceptance of probiotic orange juice. LWT Food Sci Technol. 2017;75:195–201. doi: 10.1016/j.lwt.2016.08.051. [DOI] [Google Scholar]
- Dhewa T, Pant S, Mishra V. Development of freeze dried synbiotic formulation using a probiotic strain of Lactobacillus plantarum. J Food Sci Technol. 2014;51:83–89. doi: 10.1007/s13197-011-0457-2. [DOI] [PMC free article] [PubMed] [Google Scholar]
- Hati S, Patel M, Mishra BK, Das S. Short-chain fatty acid and vitamin production potentials of Lactobacillus isolated from fermented foods of Khasi Tribes, Meghalaya, India. Ann Microbiol. 2019;69:1191–1199. doi: 10.1007/s13213-019-01500-8. [DOI] [Google Scholar]
- Havenaar R. Intestinal health functions of colonic microbial metabolites: a review. Benef Microbes. 2011;2:103–114. doi: 10.3920/BM2011.0003. [DOI] [PubMed] [Google Scholar]
- Hu J, Lin S, Zheng B, Cheung PCK. Short-chain fatty acids in control of energy metabolism. Crit Rev Food Sci Nutr. 2018;58:1243–1249. doi: 10.1080/10408398.2016.1245650. [DOI] [PubMed] [Google Scholar]
- Kim H, Kwon J, Choi SY, Ahn YG. Method development for the quantitative determination of short chain fatty acids in microbial samples by solid phase extraction and gas chromatography with flame ionization detection. J Anal Sci Technol. 2019;10:2–7. doi: 10.1186/s40543-019-0184-2. [DOI] [Google Scholar]
- Layden BT, Angueira AR, Brodsky M, Durai V, Lowe WL. Short chain fatty acids and their receptors: new metabolic targets. Transl Res. 2013;161:131–140. doi: 10.1016/j.trsl.2012.10.007. [DOI] [PubMed] [Google Scholar]
- LeBlanc JG, Chain F, Martín R, Bermúdez-Humarán LG, Courau S, Langella P. Beneficial effects on host energy metabolism of short-chain fatty acids and vitamins produced by commensal and probiotic bacteria. Microb Cell Factories. 2017;16:1–10. doi: 10.1186/s12934-017-0691-z. [DOI] [PMC free article] [PubMed] [Google Scholar]
- Louis P, Hold GL, Flint HJ. The gut microbiota, bacterial metabolites and colorectal cancer. Nat Rev Microbiol. 2014;12:661–672. doi: 10.1038/nrmicro3344. [DOI] [PubMed] [Google Scholar]
- Markowiak-Kopeć P, Śliżewska K. The effect of probiotics on the production of short-chain fatty acids by human intestinal microbiome. Nutrients. 2020;12:1107. doi: 10.3390/nu12041107. [DOI] [PMC free article] [PubMed] [Google Scholar]
- Mumcu AŞ, Temiz A (2014) Effects of prebiotics on growth and acidifying activity of probiotic bacteria (in English). Gida J Food 39:71–77. https://dergipark.org.tr/tr/download/article-file/79116
- Nunpan S, Suwannachart C, Wayakanon K. Effect of prebiotics-enhanced probiotics on the growth of Streptococcus mutans. Int J Microbiol. 2019 doi: 10.1155/2019/4623807. [DOI] [PMC free article] [PubMed] [Google Scholar]
- Önal Darilmaz D, Sönmez Ş, Beyatli Y. The effects of inulin as a prebiotic supplement and the synbiotic interactions of probiotics to improve oxalate degrading activity. Int J Food Sci. 2019;54:121–131. doi: 10.1111/ijfs.13912. [DOI] [Google Scholar]
- Osman A, Tzortzis G, Rastall RA, Charalampopoulos D. A comprehensive investigation of the synthesis of prebiotic galactooligosaccharides by whole cells of Bifidobacterium bifidum NCIMB 41171. J Biotechnol. 2010;150:140–148. doi: 10.1016/J.JBIOTEC.2010.08.008. [DOI] [PubMed] [Google Scholar]
- Pessione A, Lo Bianco G, Mangiapane E, Cirrincione S, Pessione E. Characterization of potentially probiotic lactic acid bacteria isolated from olives: evaluation of short chain fatty acids production and analysis of the extracellular proteome. Food Res Int. 2015;67:247–254. doi: 10.1016/j.foodres.2014.11.029. [DOI] [Google Scholar]
- Pokusaeva K, O’Connell-Motherway M, Zomer A, Fitzgerald GF, Van Sinderen D. Characterization of two novel α-glucosidases from Bifidobacterium breve UCC2003. Appl Environ Microbiol. 2009;75:1135–1143. doi: 10.1128/AEM.02391-08. [DOI] [PMC free article] [PubMed] [Google Scholar]
- Pokusaeva K, Fitzgerald GF, Van Sinderen D. Carbohydrate metabolism in Bifidobacteria. Genes Nutr. 2011;6:285–306. doi: 10.1007/s12263-010-0206-6. [DOI] [PMC free article] [PubMed] [Google Scholar]
- Pranckute R, Kaunietis A, Kuisiene N, Čitavičius DJ. Combining prebiotics with probiotic bacteria can enhance bacterial growth and secretion of bacteriocins. Int J Biol Macromol. 2016;89:669–676. doi: 10.1016/j.ijbiomac.2016.05.041. [DOI] [PubMed] [Google Scholar]
- Quintero M, Maldonado M, Perez-Munoz M, Jimenez R, Fangman T, Rupnow J, Wittke A, Russell M, Hutkins R. Adherence inhibition of Cronobacter sakazakii to intestinal epithelial cells by prebiotic oligosaccharides. Curr Microbiol. 2011;62:1448–1454. doi: 10.1007/s00284-011-9882-8. [DOI] [PubMed] [Google Scholar]
- Rajam R, Anandharamakrishnan C. Spray freeze drying method for microencapsulation of Lactobacillus plantarum. J Food Eng. 2015;166:95–103. doi: 10.1016/j.jfoodeng.2015.05.029. [DOI] [Google Scholar]
- Ranaei V, Pilevar Z, Khaneghah AM, Hosseini H. Propionic acid: method of production, current state and perspectives. Food Technol Biotechnol. 2020;58:115–127. doi: 10.17113/FTB.58.02.20.6356. [DOI] [PMC free article] [PubMed] [Google Scholar]
- Rawi MH, Zaman SA, Pa’ee KF, Leong SS, Sarbini SR. Prebiotics metabolism by gut-isolated probiotics. J Food Sci Technol. 2020;57:2786–2799. doi: 10.1007/s13197-020-04244-5. [DOI] [PMC free article] [PubMed] [Google Scholar]
- Ríos-Covián D, Ruas-Madiedo P, Margolles A, Gueimonde M, De los Reyes-Gavilán CG, Salazar N. Intestinal short chain fatty acids and their link with diet and human health. Front Microbiol. 2016;7:1–9. doi: 10.3389/fmicb.2016.00185. [DOI] [PMC free article] [PubMed] [Google Scholar]
- Strojný L, Bomba A, Hijová E, Chmelárová A, Mojžišová G, Bertková I, Koprovičová J, Pomfy M, Strompfová V, Molokáčová M. Effects of a probiotic in combination with prebiotics on intestinal lactobacilli and coliforms and activities of bacterial enzymes in 1,2-dimethylhydrazine exposed rats. Czech J Anim Sci. 2011;56:99–106. doi: 10.17221/56/2010-cjas. [DOI] [Google Scholar]
- Syed HM, Ghatge PU, Machewad G, Pawar S. Studies on preparation of squash from sweet orange. Open Access Sci Rep. 2012;1:185–187. [Google Scholar]
- Torres DPM, do Gonçalves MPF, Teixeira JA, Rodrigues LR. Galacto-oligosaccharides: production, properties, applications, and significance as prebiotics. Compr Rev Food Sci Food Saf. 2010;9:438–454. doi: 10.1111/j.1541-4337.2010.00119.x. [DOI] [PubMed] [Google Scholar]
- Vernazza CL, Gibson GR, Rastall RA. Carbohydrate preference, acid tolerance and bile tolerance in five strains of Bifidobacterium. J Appl Microbiol. 2006;100:846–853. doi: 10.1111/j.1365-2672.2006.02832.x. [DOI] [PubMed] [Google Scholar]
- Yang L, Xie X, Li Y, Wu L, Fan C, Liang T, Xi Y, Yang S, Li H, Zhang J, Ding Y, Xue L, Chen M, Wand J, Wu Q. Evaluation of the cholesterol-lowering mechanism of Enterococcus faecium strain 132 and Lactobacillus paracasei strain 201 in hypercholesterolemia rats. Nutrients. 2021;13:1982. doi: 10.3390/nu13061982. [DOI] [PMC free article] [PubMed] [Google Scholar]
Associated Data
This section collects any data citations, data availability statements, or supplementary materials included in this article.
Data Availability Statement
All data generated or analyzed during this study are included in this published article.