

Abstract
Background:
Susceptibility MRI is sensitive to iron-related changes in the substantia nigra pars compacta (SNc), the key pathologic locus of parkinsonisms. It is unclear, however, if iron deposition in the SNc is associated with its neurodegeneration.
Objective:
To test whether susceptibility MRI metrics in parkinsonisms are associated with SNc neuropathologic features of dopaminergic neuron loss, gliosis, and α-synuclein and tau burden.
Methods:
This retrospective study included 27 subjects with both in vivo MRI and postmortem data. Multi-gradient echo imaging was used to derive the apparent transverse relaxation rate (R2*) and quantitative susceptibility mapping (QSM) in the SNc. Archived midbrain slides that were stained with hematoxylin and eosin, anti-α-synuclein, and anti-tau were digitized to quantify neuromelanin-positive neuron density, glial density, and the percentages of area occupied by positive α-synuclein and tau staining. MRI-histology associations were examined using Pearson correlations and regression.
Results:
Twenty-four subjects had postmortem parkinsonism diagnoses (Lewy body disorder, progressive supranuclear palsy, multiple system atrophy, and corticobasal degeneration), two only had Alzheimer’s neuropathology, and one only exhibited mild atrophy. Among all subjects, both R2* and QSM were associated with glial density (r-values ≥ 0.67; P-values < 0.001) and log-transformed tau burden (r-values ≥ 0.53; P-values ≤ 0.007). Multiple linear regression identified glial density and log-transformed tau as determinants for both MRI metrics (R2-values ≥ 0.580; P-values < 0.0001). Neither MRI metric associated with neuron density or α-synuclein burden.
Conclusions:
R2* and QSM are associated with both glial density and tau burden, key neuropathologic features in the parkinsonism SNc.
Keywords: parkinsonism, substantia nigra pars compacta, susceptibility MRI, glia, tau
Introduction
Parkinsonisms are characterized by tremor, rigidity, bradykinesia, loss of postural control, and gait dysfunction. Whereas these features are clinical hallmarks of Parkinson’s disease, they also are found in neuropathologically distinct atypical parkinsonisms such as progressive supranuclear palsy, multiple system atrophy, and corticobasal degeneration.1 Overlapping motor presentations among these disorders are attributed largely to the loss of dopaminergic input to the basal ganglia.2 Dopamine deficiency stems from the loss of pigmented neurons in the substantia nigra (SN), specifically the subregion known as the pars compacta (SNc) where the neurons are populated most densely.3
Postmortem examinations have shown that dopaminergic neuron loss in the SNc is a shared neuropathologic feature among parkinsonisms.4 Also shared are findings of reactive gliosis and proteinopathy. Proteinopathy is used to differentiate parkinsonisms as they differ in both the type and distribution of protein aggregation. Specifically, Parkinson’s disease is characterized by α-synuclein-positive neuronal inclusions known as Lewy bodies. Multiple system atrophy is also an α-synucleinopathy but is defined by α-synuclein-positive neuronal and glial cytoplasmic inclusions. Progressive supranuclear palsy and corticobasal degeneration both are characterized by tau-positive neurofibrillary tangles and neuropil threads.4
Overlapping motor presentations among parkinsonisms continue to challenge early and accurate clinical diagnoses.5 There consequently has been continued interest in capturing neuropathologic features using in vivo imaging techniques, both for the earlier detection of neurodegenerative changes and the differential diagnosis of parkinsonisms.6 Among the many imaging modalities examined, susceptibility MRI (sMRI) has attracted considerable attention as it is particularly sensitive to magnetic susceptibility differences in the SN and SNc that predominately reflect brain iron accumulation.7, 8 Excessive iron deposition is a well-known feature of many neurodegenerative conditions, including parkinsonisms.9, 10 Iron accumulation in the parkinsonism SN first was reported by Dexter et al. (1987)11 and Sofic et al. (1988)12 using postmortem tissue samples. Since then, in vivo sMRI studies have generated findings consistent with higher iron content in the parkinsonism SN and SNc.13 More recently, our group has used sMRI to show that SN iron is significantly higher in later-stage Parkinson’s disease patients versus earlier-stage patients.14 Using longitudinal data, we also have shown that SN iron increases over the disease course.15
In previous studies, susceptibility differences in the brain often have been captured by the apparent transverse relaxation rate (R2*) and quantitative susceptibility mapping (QSM).7, 8 As iron has been implicated in various pathophysiologic processes in the brain – including oxidative stress, DNA damage, abnormal modifications of macromolecules,16 and interactions with both α-synuclein and tau17–19 – we hypothesize that R2* and QSM may capture key neuropathologic features in the parkinsonism SN. Our original pilot study of 14 parkinsonism subjects yielded some preliminary data consistent with this hypothesis, but was limited by sample size and semi-quantitative histopathologic grading methods.20 In the present study, we focused specifically on the SNc and re-examined sMRI-histology associations using a quantitative approach to evaluate R2* and QSM associations with neuron density, glial density, and α-synuclein and tau burden in an expanded cohort of 27 subjects.
Methods
Study subjects
This study included 27 subjects from a longitudinal cohort established under the Parkinson’s Disease Biomarker Program.21 Subjects were selected based on the availability of in vivo multi-gradient echo MRI and postmortem neuropathology data as of January 2022. Clinical and final neuropathology diagnoses were made, respectively, by a movement disorder specialist and neuropathologist according to published criteria.1, 4, 22, 23
Pathology diagnoses of Lewy-type α-synucleinopathies (e.g. Parkinson’s disease, Parkinson’s disease with dementia, dementia with Lewy bodies) were condensed under a diagnosis of Lewy body disorder,24 and staged by distribution of Lewy body pathology (brainstem predominant, limbic/transitional, neocortical/diffuse).25 Multiple system atrophy diagnoses were further subtyped as striatonigral degeneration versus olivopontocerebellar atrophy based on the predominant neuropathologic phenotype. Alzheimer’s disease neuropathologic change was graded according to the National Institute on Aging-Alzheimer’s Association guidelines for ABC score and severity.23
For parkinsonism subjects, disease duration was defined as the number of years between date of first diagnosis and date of visit. For all subjects, an MRI-pathology interval was defined as the months spanning a subject’s MRI scan and death. Written informed consent was obtained from all subjects or their legal representatives in accordance with the Declaration of Helsinki, and all data collection was approved by the institutional review board at the Pennsylvania State University.
MRI acquisition and post-processing
Brain MRIs were obtained using a 3-Tesla MRI system (Magnetom Trio; Siemens, Erlangen, Germany). For image registration purposes, T2-weighted (T2w) images were acquired using a fast spin-echo sequence: repetition time (TR)/echo time (TE) = 2500/316 ms, field of view (FoV) = 256×256 mm, matrix = 256×256, slice thickness = 1 mm (no gap), slice number = 176. Multi-gradient-echo images (for R2* and QSM images) were acquired using the following acquisition parameters: 6 TEs ranging from 7 to 47 ms at an equal interval of 8 ms, TR = 54 ms, flip angle = 20°, FoV = 256×256 mm, matrix = 256×256, slice thickness = 1.5 mm (no gap), slice number = 64. Six magnitude images taken from the multi-gradient echo were aligned by affine registration and averaged to generate a mean magnitude image. R2* images were generated from a voxel-wise, nonlinear, Levenberg-Marquardt algorithm to fit the monoexponential function: . QSM images were generated using morphology-enabled dipole inversion with a nonlinear formulation.26, 27 Both R2* and QSM values were calculated in MATLAB (MathWorks, Natick, Massachusetts).
SNc segmentation on MRI
Dopaminergic neurons of the SNc are pigmented by neuromelanin, a byproduct of dopamine synthesis. The paramagnetic properties of neuromelanin allow neuromelanin-sensitive sequences (NMS-MRI) to localize the SNc within the midbrain.28 NMS-MRI scans were not obtained for this cohort. Therefore, left and right regions of interest (ROIs) for the SNc were defined on a Montreal Neurological Institute-normalized T2w template using the NMS-MRI-based probabilistic atlas generated by Safai et al. (2020)28 (https://github.com/apoorvasafai/NMS-SNc-atlas) as a reference. Definition was constrained to six axial slices with the superior limit one slice inferior to the level showing the largest red nucleus radius (Figure 1A).20
Figure 1. MRI segmentations and quantification of histology metrics.
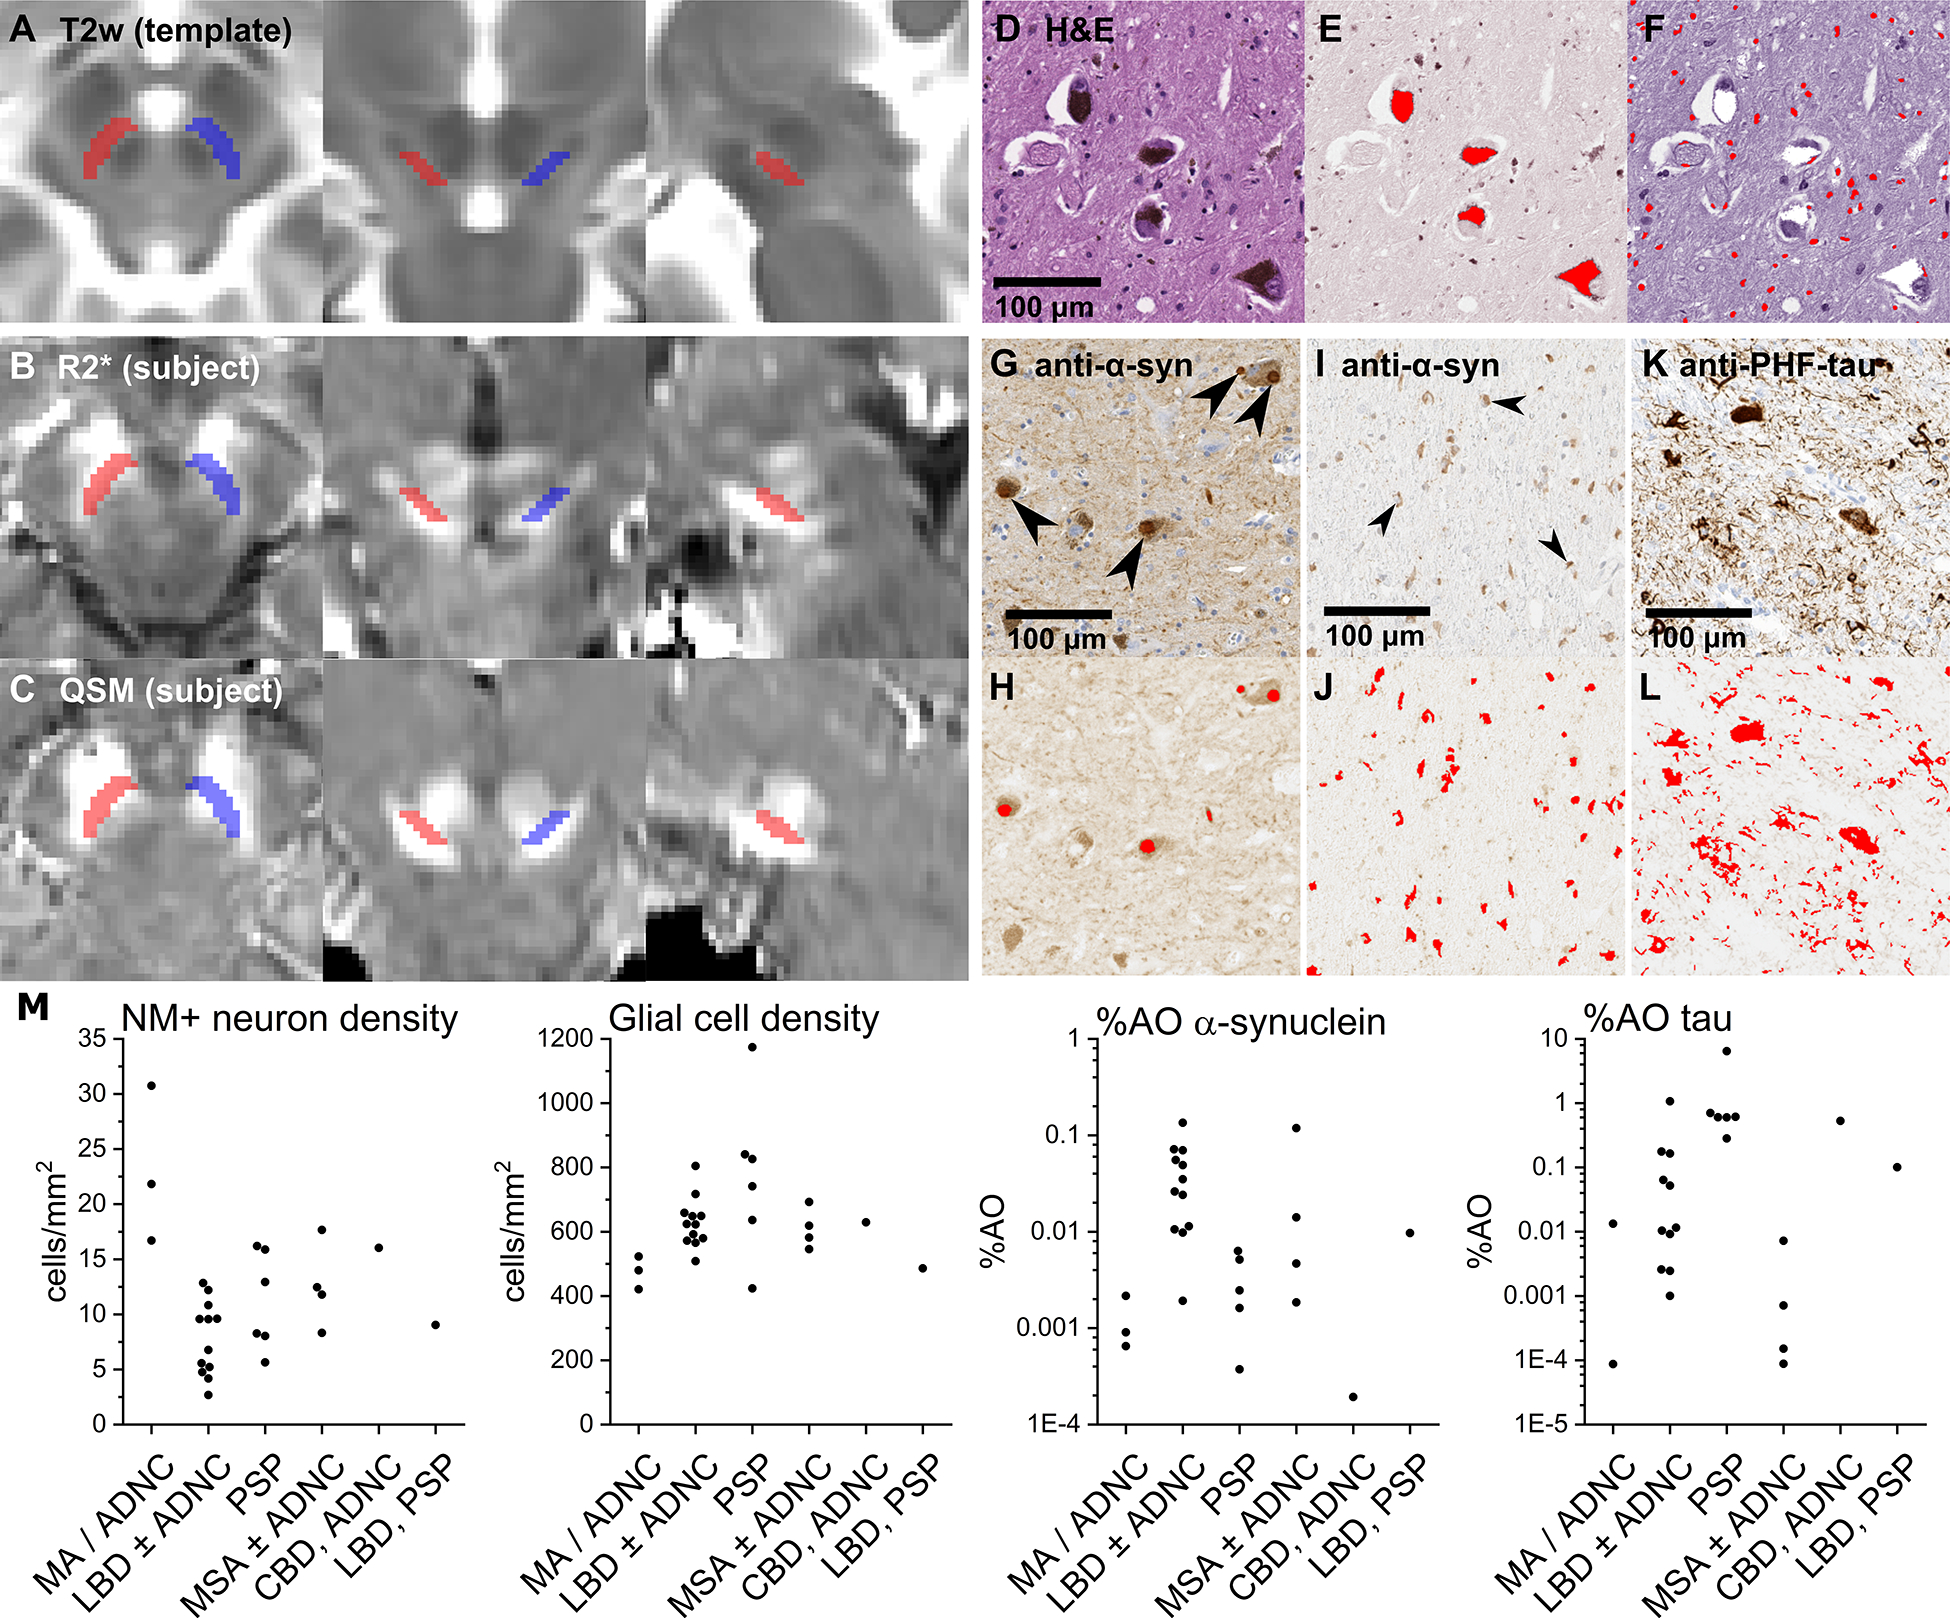
(A) SNc definitions on a T2w template (left: axial; center: coronal; right: sagittal). (B) Normalized R2* and (C) QSM images from a representative subject. (D) Magnified view of the SNc stained with H&E. Scans were color- and intensity-normalized to separate values corresponding to (E) neuromelanin (NM) and (F) hematoxylin to identify respectively NM-positive (NM+) neurons and glial cells (red masks in E and F). (G and I) Magnified views of the SNc stained with anti-α-synuclein. Scans were color- and intensity-normalized to oxidized DAB (H and J) to identify α-synuclein-positive Lewy bodies (large arrows in G; red masks in H) and α-synuclein-positive glial cytoplasmic inclusions (small arrows in I; red masks in J). (K) Magnified view of the SNc stained with anti-PHF-tau. Scans were color- and intensity-normalized to DAB (L) to identify tau-positive neurofibrillary tangles and neuropil threads (red masks in L). (M) Quantification results (grouped by primary pathology diagnosis) for NM+ neuron density, glial cell density, %AO α-synuclein, and %AO tau. Abbreviations: CBD – corticobasal degeneration; LBD – Lewy body disorders; MSA – multiple system atrophy; PSP – progressive supranuclear palsy.
Susceptibility MRI images for each subject were brought into template space by registering the mean magnitude images to the T2w images, and then T2w images to the T2w template. These transformations then were applied to subject R2* and QSM images using B-spline interpolation (Figure 1B,C). All registrations were performed using Advanced Normalization Tools (https://github.com/ANTsX/ANTs)29 and inspected visually at each slice for misalignments. R2* and QSM values were calculated from mean intensities within the left and right ROIs.
Histology image and data acquisition
This study used archival midbrain slides that were acquired postmortem and prepared alongside samples taken from other regions of the brain as part of standard neuropathologic assessments for pathology diagnoses (as mentioned above). Briefly, slides were stained with hematoxylin and eosin (H&E), or anti-α-synuclein (Sigma-Aldrich AB5038, 1:2500) and anti-PHF-tau (Invitrogen MN1020, 1:400) antibodies developed with 3,3’-diaminobenzidine (DAB) and hematoxylin counterstain. Slides were digitized at 40× magnification using an Aperio AT (Leica) whole-slide scanner. SNc ROIs were defined on each scan by circumscribing the extent of neuromelanin-positive neurons. Scans then were color- and intensity-normalized in MATLAB using the Macenko et al. (2009)30 two-stain normalization method (https://github.com/mitkovetta/staining-normalization/) to adjust for variable fading and separate stains by color vectors. H&E scans were separated into images corresponding to neuromelanin and hematoxylin; anti-α-synuclein and anti-tau scans were normalized to separate DAB from hematoxylin.
The resultant images were processed in ImageJ with user-defined intensity thresholding followed by morphology filters to mask and quantify: dopaminergic neurons by their neuromelanin deposits (Figure 1E), glia by their hematoxylin-positive nuclei (Figure 1F), and α-synuclein and tau by their respective morphologic aggregations (Figure 1G–L). This semi-automatic counting was compared against manual counting in sample images, showing strong agreement (Supplemental Figure 1). Quantification of histology metrics on whole-slide scans was conducted by a blinded rater in a single session. Estimated cell densities for each subject were calculated by dividing neuromelanin-positive neuron and glia counts by the ROI area. Estimates for percentages of area occupied by positive staining (%AO) for α-synuclein and tau were calculated by dividing the respective areas of positive staining by the ROI area.
Statistical analyses
Previous postmortem validation studies of R2* and QSM have shown that both susceptibility metrics reflect iron concentrations in strong linear relationships.7, 8 To test our hypothesis that R2* and QSM may similarly capture key neuropathologic features, we chose to test MRI-histology associations using two-tailed Pearson correlations and multiple regression models. In these analyses, both %AO α-synuclein and %AO tau were log-transformed to handle skewness. Data were paired according to the midbrain side sampled. Significance was set at P < 0.00625 (0.05/8) by the Bonferroni approach to control for the multiple associations tested under the primary hypothesis (two MRI × four histology metrics).
Given the variable time interval between MRI visit and death, two-tailed Pearson correlations also were used to rule out possible confounding effects of the MRI-pathology interval on histology results (Supplemental Table 1). Nonparametric Spearman correlation tests of the original (non-transformed) data also were used to confirm MRI-histology associations in the event that the parametric testing of log-transformed data would misrepresent the results (Supplemental Table 2).
All statistical analyses were performed using R version 3.6.1 (R Core Team, Vienna, Austria). Where error terms are provided, they are standard error of the mean unless otherwise stated.
Data availability
Raw data were generated at the Penn State Health-Milton S. Hershey Medical Center. Derived data supporting the findings are available from the corresponding author on request.
Results
Demographics, clinical diagnoses, and pathology diagnoses of the study subjects
At their study visit, subjects’ average age was 74.6 years (SE = 1.7) and average disease duration for parkinsonism subjects was 6.7 years (SE = 1.3). Clinical diagnoses were: Parkinson’s disease (n = 11), progressive supranuclear palsy (n = 6), multiple system atrophy (n = 4), atypical parkinsonism of uncertain diagnosis (n = 2), essential tremor (n = 1), and normal controls (n = 3). At death, the average MRI-pathology interval was 23.6 ± 3.4 mo. The pathology diagnoses were: Lewy body disorder (n = 12); progressive supranuclear palsy (n = 6); multiple system atrophy (n = 4); corticobasal degeneration (n = 1); and concurrent Lewy body disorder and progressive supranuclear palsy (n =1). Nine parkinsonism and two control subjects exhibited Alzheimer’s disease neuropathologic changes (ADNC). Subtypes of Lewy body disorder and multiple system atrophy, as well as grading of Alzheimer’s disease neuropathologic change, are shown in Table 1. Anti-α-synuclein slides were not available for one progressive supranuclear palsy subject and anti-tau slides were not available for one control and one Lewy body disorder subject.
Table 1.
Study subjects
|
In vivo MRI |
Postmortem pathology |
|||||||
|---|---|---|---|---|---|---|---|---|
| ID | Sex | Visit (m/y) | Age (y) | Clinical diagnosis | DD (y) | Death (m/y) | MRI-path. interval (m) | Pathology diagnosis (NIA-AA scoring) |
|
| ||||||||
| 1 | F | 01/2013 | 68 | PD | 22 | 01/2013 | 0 | LBD-L, ADNC-H (A3/B3/C3) |
| 2 | M | 01/2013 | 91 | PSP | 4 | 10/2013 | 9 | PSP |
| 3 | M | 02/2013 | 63 | MSA | 6 | 03/2014 | 13 | MSA-OPCA |
| 4 | F | 10/2013 | 78 | PD | 11 | 07/2014 | 9 | LBD-N, ADNC-H (A3/B3/C2) |
| 5 | M | 10/2013 | 74 | PSP | 9 | 10/2014 | 12 | PSP |
| 6 | M | 04/2013 | 78 | MSA | 9 | 01/2015 | 21 | LBD-B |
| 7 | M | 06/2014 | 82 | PD | 5 | 02/2015 | 8 | PSP |
| 8 | M | 06/2014 | 62 | PSP | 3 | 05/2015 | 11 | PSP |
| 9 | M | 09/2014 | 71 | Control | - | 08/2015 | 11 | Mild Atrophy |
| 10 | F | 06/2015 | 83 | ET | - | 07/2016 | 13 | ADNC-L (A3/B1/C1) |
| 11 | M | 01/2016 | 71 | PD | 22 | 07/2016 | 6 | LBD-B, ADNC-I (A2/B2/C1) |
| 12 | M | 01/2016 | 76 | PD | 6 | 10/2016 | 9 | CBD, ADNC-I (A2/B3/C2) |
| 13 | F | 09/2015 | 70 | APUD | 9 | 03/2017 | 18 | MSA-SND |
| 14 | F | 08/2016 | 81 | PSP | 0 | 04/2017 | 8 | LBD-B, PSP |
| 15 | M | 09/2015 | 84 | APUD | 0 | 04/2017 | 19 | LBD-L, ADNC-H (A3/B3/C2) |
| 16 | F | 04/2016 | 84 | MSA | 0 | 11/2017 | 19 | MSA-SND |
| 17 | F | 06/2015 | 81 | PD | 3 | 12/2017 | 30 | LBD-B |
| 18 | M | 11/2015 | 82 | PD | 16 | 12/2017 | 25 | LBD-L |
| 19 | F | 06/2016 | 54 | MSA | 0 | 05/2018 | 23 | MSA-OPCA, ADNC-I (A1/B2/C2) |
| 20 | M | 07/2016 | 73 | PD | 3 | 02/2019 | 31 | LBD-B, ADNC-I (A2/B3/C2) |
| 21 | M | 12/2014 | 58 | PD | 1 | 06/2019 | 54 | LBD-N, ADNC-I (A2/B3/C3) |
| 22 | F | 01/2017 | 83 | PD | 4 | 12/2019 | 35 | LBD-B |
| 23 | M | 11/2014 | 63 | PSP | 9 | 02/2020 | 24 | PSP |
| 24 | M | 06/2015 | 69 | PSP | 6 | 04/2020 | 58 | PSP |
| 25a | F | 09/2015 | 77 | Control | - | 07/2020 | 58 | LBD-N, ADNC-I (A2/B3/C3) |
| 26 | M | 05/2016 | 78 | Control | - | 12/2020 | 55 | ADNC-H (A3/B3/C2) |
| 27 | M | 04/2016 | 81 | PD | 6 | 01/2021 | 57 | LBD-L |
Subject was diagnosed with Parkinson’s disease after participating in the study as a control.
Abbreviations: ADNC – Alzheimer’s disease neuropathologic change (L: low; I: intermediate; H: high); APUD – atypical parkinsonism of uncertain diagnosis; CBD – corticobasal degeneration; DD – disease duration; ET – essential tremor; F – female; LBD – Lewy body disorder (B: brainstem predominant; L: limbic/transitional; N: neocortical/diffuse); M – male; MSA – multiple system atrophy (SND: striatonigral degeneration; OPCA: olivopontocerebellar atrophy); PD – Parkinson’s disease; PSP – progressive supranuclear palsy.
Histology results by parkinsonism diagnosis are presented in Figure 1M. Among the histology metrics, neuromelanin-positive neuron density associated negatively with log-transformed %AO α-synuclein (r = −0.58; df = 24; P = 0.002), whereas glial density showed a nonsignificant positive association with log-transformed %AO tau (r = 0.39; df = 23; P = 0.054) (Supplemental Table 1).
Associations between MRI and histology metrics
As shown in Table 2, R2* associated positively with both glial density (r = 0.70; df = 25; P < 0.0001) and log-transformed %AO tau (r = 0.61; df = 23; P = 0.001). QSM also associated with glial density (r = 0.67; df = 25; P < 0.001) and log-transformed %AO tau (r = 0.53; df = 23; P = 0.007), although the latter did not survive Bonferroni correction.
Table 2.
Pearson correlations between susceptibility MRI and histology metrics
| NM+ neuron density | Glial density | log(%AO α-synuclein) | log(%AO tau) | |||||||||
|---|---|---|---|---|---|---|---|---|---|---|---|---|
| r | df | P | r | df | P | r | df | P | r | df | P | |
|
| ||||||||||||
| R2* | −0.09 | 25 | 0.656 | 0.70 | 25 | <0.0001 * | −0.09 | 24 | 0.659 | 0.61 | 23 | 0.001 * |
| QSM | 0.05 | 25 | 0.812 | 0.67 | 25 | <0.001 * | −0.01 | 24 | 0.945 | 0.53 | 23 | 0.007 |
Pearson correlation coefficients (r) between susceptibility MRI and histology metrics with degrees of freedom (df) and unadjusted probability values (P).
P < 0.05 are bolded.
P < 0.00625 to correct for multiple comparisons.
Abbreviations: NM+ = neuromelanin-positive; %AO = percent of area occupied by positive staining; R2* = apparent transverse relaxation rate; QSM = quantitative susceptibility mapping.
As seen in Figure 2, scatterplots showed that R2* and QSM associations with glial density and log-transformed %AO tau may have been driven by a single subject with the highest recorded values in all four metrics. Without this subject, R2* associations with glial density (r = 0.52; df = 24; P = 0.006) and log-transformed %AO tau (r = 0.53; df = 22; P = 0.007), and QSM associations with glial density (r = 0.40; df = 24; P = 0.041) and log-transformed %AO tau (r = 0.41; df = 22; P = 0.046) remained.
Figure 2. MRI versus histology associations in the substantia nigra pars compacta.

(A) R2* versus glial cell density. (B) R2* versus the log-transformed %AO tau. (C) QSM versus glial cell density. (D) QSM versus log-transformed %AO tau. Lines shown are least-square fitted with Pearson correlations (r), degrees of freedom (df) and unadjusted probability values (P). Abbreviations: ADNC – Alzheimer’s disease neuropathologic change; CBD – corticobasal degeneration; LBD – Lewy body disorders; MSA – multiple system atrophy; PSP – progressive supranuclear palsy.
Multiple regression analyses predicting R2* and QSM by both glial density and tau burden
Multiple linear regression was used to test whether R2* and QSM were explained with both glial density and log-transformed %AO tau as predictors. For R2*, the overall model was significant (R2 = 0.651, F(2, 22) = 20.50, P < 0.00001), with prediction by both glial density (β = 0.049, P < 0.001) and log-transformed %AO tau (β = 3.80, P = 0.009). The QSM model also was significant (R2 = 0.580, F(2, 22) = 15.16, P < 0.0001), with prediction by both glial density (β = 0.286, P < 0.001) and log-transformed %AO tau (β = 15.59, P = 0.065) (Table 3).
Table 3.
Post hoc regression models
| Variable | R2* (s−1) Model 1 (full model) | R2* (s−1) Model 2 | R2* (s−1) Model 3 | QSM (ppb) Model 1 (full model) | QSM (ppb) Model 2 | QSM (ppb) Model 3 |
|---|---|---|---|---|---|---|
|
| ||||||
| Constant | 8.85 (8.81) | −5.92 (8.29) | 43.89 (3.28) | −27.58 (53.38) | −74.25 (46.46) | 176.30 (19.54) |
| Glial density (cells/mm2) | 0.049** (0.012) | 0.062*** (0.012) | - | 0.286** (0.072) | 0.318** (0.071) | - |
| log (%AO tau) | 3.80* (1.32) | - | 5.94* (1.59) | 15.59 (8.02) | - | 28.05* (9.47) |
|
| ||||||
| Observations | 25 | 27 | 25 | 25 | 27 | 25 |
| R 2 | 0.651 | 0.487 | 0.378 | 0.580 | 0.445 | 0.276 |
| Adjusted R2 | 0.619 | 0.466 | 0.350 | 0.541 | 0.423 | 0.245 |
| F-statistic | 20.50 | 23.69 | 13.95 | 15.16 | 20.03 | 8.77 |
| P-value | <0.00001 | <0.0001 | 0.001 | <0.0001 | 0.0001 | 0.007 |
Linear regression models with R2* and QSM as dependent variables, predicted by glial density and log-transformed %AO tau. In Model 1 (full model), MRI metrics were predicted by both glial density and log-transformed %AO tau; in Model 2, MRI metrics were predicted by only glial density; In Model 3, MRI metrics were predicted by only log-transformed %AO tau. All data were obtained from the substantia nigra pars compacta.
P < 0.01
P < 0.001
P < 0.0001
Abbreviations: NM+ = neuromelanin-positive; %AO = percent of area occupied by positive staining; R2* = apparent transverse relaxation rate; QSM = quantitative susceptibility mapping.
Discussion
In this study, we examined in vivo sMRI associations with postmortem histologic features of the SNc in 27 subjects. We found that both R2* and QSM correlated with glial density and tau burden. These results indicate that sMRI is sensitive to neurodegenerative changes in the SNs of patients with parkinsonisms, and support its clinical and translational value in studies of parkinsonism neuropathology.
Nigral iron is localized predominately to glia
R2* and QSM are sensitive to local magnetic field inhomogeneities, of which iron is the predominant contributor.7, 8 Iron deposition in the SN has been observed in Parkinson’s disease and other parkinsonisms using both sMRI metrics,6 although the localization of iron accumulation in the SN and the neuropathologic features to which it may be associated remain uncertain. It has been hypothesized that neuromelanin may play the leading role in iron sequestration.31 This is supported by the substantial iron-chelating ability of neuromelanin as demonstrated ex vivo using various elemental analysis methods,32–34 and the spatial overlap between sMRI changes and the distribution of neuromelanin in Parkinson’s disease brains.35
In the human SN, glia are known to represent an estimated 95% of brain cells.36 Oligodendrocytes, astrocytes, and microglia have been shown to store the majority of total iron in the brain37 and within the SN.38 Recently, Friedrich et al. (2021)39 presented compelling evidence that iron is localized predominantly to glia in the SNc in Parkinson’s disease by quantifying iron concentrations across immunolabelled cell types using microparticle-induced X-ray emission. Corroborating earlier findings of iron colocalization with neuromelanin, they found iron concentrations were increased within neuromelanin deposits in Parkinson’s disease patients. This increase had a minimal effect on total iron, however, and was outweighed by increased iron concentrations within oligodendrocytes and microglia (but not astrocytes). In total, they estimated 80% of SNc iron was localized to glia in both control and Parkinson’s disease brains.39
Our data support their finding since we observed strong linear associations between sMRI metrics and glial density. The exact glial cell types contributing to this observation, however, are unknown. Because SNc microglial activation has been shown to be particularly robust in Parkinson’s disease40 and is associated strongly with postmortem iron staining,41 we suspect microglia may be the primary storage compartment for excess iron. An oligodendrocyte response is less studied, though the data from Friedrich et al. (2021)39 indicate iron changes may differ dramatically among oligodendrocyte subtypes. They observed large increases in iron concentrations among myelinating subtypes and iron loss among non-myelinating subtypes.39 Further studies are needed to elucidate the glial cell types harboring iron in parkinsonisms.
Tau is independently associated with nigral iron
Tau is a microtubule-associated protein expressed primarily in neurons. In Alzheimer’s disease, tau aberrantly aggregates into neurofibrillary tangles that are believed to cause neuronal dysfunction and death.42 Animal studies have shown that endogenous tau expression is much lower in glial cell types than in neurons.43, 44 Patients with progressive supranuclear palsy and corticobasal degeneration exhibit tau aggregations in neurons, oligodendrocytes, and astrocytes, however.43
Our observation that R2* and QSM associated with tau burden is interesting as increased iron content, as determined by QSM, has been found to overlap with tau-PET tracer uptake (18F-AV-1451 and 18F-RO-948) in studies of Alzheimer’s disease.45, 46 There is concern, however, that this primarily reflects off-target binding of 18F-AV-1451 and other tau-PET tracers to iron, monoamine oxidase, and other molecular structures.45, 47, 48 There is other evidence to suggest that iron and tau are directly associated. For example, in a study of progressive supranuclear palsy neuropathology, ferritin was observed to co-localize with tau filaments in tissue samples and co-purify with isolated tau polymers.49 Interestingly, ferric iron has been shown in vitro to bind brain-isolated hyperphosphorylated tau and induce its polymerization.17 This suggests a nonlinear precipitating effect that may explain why we observed R2* and QSM associated linearly with log-transformed tau staining.
In this cohort, glial density and tau associated weakly (Supplemental Table 1). Their association may be related to tau burden distributed to oligodendrocytes and astrocytes, as is found in progressive supranuclear palsy and corticobasal degeneration. Yet multiple regression models for R2* and QSM suggest that glial density and tau burden have distinct contributions to sMRI variance (R2 values were improved with both glial density and tau burden in the same model, Table 3), and this independence may reflect those tau neurofibrillary tangles localized within neurons. Understandably, MRI signals are not composed “purely” of a single cellular or biochemical feature. Future studies are needed to better understand the associations among iron, tau burden, and their respective distributions to SNc cell types.
Limitations and future directions
This study had limitations future studies may address. First, although this is the largest parkinsonism study to date to examine in vivo sMRI associations with postmortem histology, our existing cohort still is relatively small. We continue to capture postmortem brain samples from our Parkinson’s Disease Biomarker Program cohort to power additional investigations. Second, our SNc ROIs relied on atlas-based segmentations since we did not obtain NMS-MRI scans. As an improvement on our earlier study,20 we distinguished the SNc from the SN pars reticulata in order to better study the key structure of parkinsonism neuropathology. Third, our use of single archival slides reduced our ability to precisely associate MRI with histology. For each subject, we paired the midbrain side sampled to MRI data from the corresponding SNc ROI. Improving on our previous study, here we quantified histologic features across the entire slide rather than using the averages of cell counts sampled at high-power fields and semi-quantitative ratings for α-synuclein and tau burden.20 Nonetheless, each slide was only a two-dimensional representation of a three-dimensional (3D) structure. Stereotactic association of MRI with 3D tissue blocks is desired in future studies. Last, we used archival slides. Future studies will benefit from immunolabelling specific glial cell types to better distinguish their respective associations with MRI. Co-staining may address additional questions, such as the extent to which tau and iron are distributed to particular cell types, and whether differences in their accumulation drive distinct parkinsonism neuropathologies.
Despite these limitations, the current study demonstrates the feasibility of finding linear associations between quantitative histology and MRI metrics on a subject-to-subject basis. Overall, we believe these results to be more robust than those in our earlier study20 given the larger sample size and improved methods. We previously used nonparametric correlations to show that R2* and α-synuclein were directly associated. We found this observation reasonable as both iron deposition and α-synuclein burden have been shown to be higher in the SN of patients with α-synucleinopathies. 9–12, 50, 51 But here we observe that, in the SNc, R2* and α-synuclein are not related in a linear fashion, but that both R2* and QSM are associated linearly with glial cell density and tau burden. In conclusion, we anticipate that ongoing and future studies will address the above limitations and expand into other subcortical, cerebellar, and midbrain structures involved in parkinsonism neuropathology. Comprehensive study of additional neuropathologies will improve our knowledge of their respective contributions to MRI signals. This will allow a better interpretation of MRI biomarkers in the diagnosis of parkinsonisms and monitoring of their progression.
Supplementary Material
Acknowledgements
This study would not be possible without our study participants, their families, our study coordinators, and Ally Lewis of Penn State Decedent Care.
Funding Information:
National Institute of Neurological Disease and Stroke (R01-NS060722, U01-NS082151, and U01-NS112008 to XH), the National Institute of Environmental Health Sciences (F30-ES030607 to EW, ES019672 to XH), the National Institute on Aging (F30-AG067651 to GLB) the Hershey Medical Center General Clinical Research Center (National Center for Advancing Translational Sciences, UL1-TR000127), the Penn State Clinical and Translational Science Institute (National Center for Advancing Translational Sciences, TL1-TR002016), the Michael J. Fox Foundation for Parkinson’s Research (18078 to GD), and the Penn State Translational Brain Research Center.
Footnotes
Financial Disclosure/Conflict of Interest: The authors report no conflicts of interest.
Financial Disclosures for the last 12 months:
Ernest W. Wang: Received funding from the National Institute of Environmental Health Sciences, and the National Center for Advancing Translational Sciences.
Gregory L. Brown: Received funding from the National Institute of Aging.
Mechelle M. Lewis: Received funding from the National Institute of Environmental Health Sciences, National Institute of Neurological Disorders and Stroke, the Michael J. Fox Foundation for Parkinson’s Research, the Alzheimer’s Association, Alzheimer’s Research UK, the Weston Brain Institute, Bristol Myers Squibb, Biohaven, Pfizer, and the Department of Defense.
Leslie C. Jellen: Received funding from the National Institute of Neurological Disorders and Stroke.
Cunfeng Pu: Received funding from the National Institute of Neurological Disorders and Stroke.
Melinda L. Johnson: Nothing to disclose.
Hairong Chen: Received funding from the National Institute of Neurological Disorders and Stroke.
Lan Kong: Received funding from the National Institute of Environmental Health Sciences, National Institute of Neurological Disorders and Stroke, the Michael J. Fox Foundation for Parkinson’s Research.
Guangwei Du: Received funding from the National Institute of Environmental Health Sciences, National Institute of Neurological Disorders and Stroke, the Michael J. Fox Foundation for Parkinson’s Research, the Alzheimer’s Association, Alzheimer’s Research UK, the Weston Brain Institute.
Xuemei Huang: Received funding from the National Institute of Environmental Health Sciences, National Institute of Neurological Disorders and Stroke, the Michael J. Fox Foundation for Parkinson’s Research, the Alzheimer’s Association, Alzheimer’s Research UK, the Weston Brain Institute, Bristol Myers Squibb, Biohaven, Pfizer, and the Department of Defense.
References
- 1.McFarland NR. Diagnostic Approach to Atypical Parkinsonian Syndromes. Continuum (Minneap Minn) 2016;22(4 Movement Disorders):1117–1142. [DOI] [PMC free article] [PubMed] [Google Scholar]
- 2.Galvan A, Wichmann T. Pathophysiology of parkinsonism. Clin Neurophysiol 2008;119(7):1459–1474. [DOI] [PMC free article] [PubMed] [Google Scholar]
- 3.Parent M, Parent A. Substantia nigra and Parkinson’s disease: a brief history of their long and intimate relationship. Can J Neurol Sci 2010;37(3):313–319. [DOI] [PubMed] [Google Scholar]
- 4.Dickson DW. Parkinson’s disease and parkinsonism: neuropathology. Cold Spring Harb Perspect Med 2012;2(8). [DOI] [PMC free article] [PubMed] [Google Scholar]
- 5.Rizzo G, Copetti M, Arcuti S, Martino D, Fontana A, Logroscino G. Accuracy of clinical diagnosis of Parkinson disease: A systematic review and meta-analysis. Neurology 2016;86(6):566–576. [DOI] [PubMed] [Google Scholar]
- 6.Bae YJ, Kim JM, Sohn CH, et al. Imaging the Substantia Nigra in Parkinson Disease and Other Parkinsonian Syndromes. Radiology 2021:203341. [DOI] [PubMed] [Google Scholar]
- 7.Langkammer C, Schweser F, Krebs N, et al. Quantitative susceptibility mapping (QSM) as a means to measure brain iron? A post mortem validation study. Neuroimage 2012;62(3):1593–1599. [DOI] [PMC free article] [PubMed] [Google Scholar]
- 8.Langkammer C, Krebs N, Goessler W, et al. Quantitative MR imaging of brain iron: a postmortem validation study. Radiology 2010;257(2):455–462. [DOI] [PubMed] [Google Scholar]
- 9.Sian-Hulsmann J, Mandel S, Youdim MB, Riederer P. The relevance of iron in the pathogenesis of Parkinson’s disease. J Neurochem 2011;118(6):939–957. [DOI] [PubMed] [Google Scholar]
- 10.Kaindlstorfer C, Jellinger KA, Eschlbock S, Stefanova N, Weiss G, Wenning GK. The Relevance of Iron in the Pathogenesis of Multiple System Atrophy: A Viewpoint. J Alzheimers Dis 2018;61(4):1253–1273. [DOI] [PMC free article] [PubMed] [Google Scholar]
- 11.Dexter DT, Wells FR, Agid F, et al. Increased nigral iron content in postmortem parkinsonian brain. Lancet 1987;2(8569):1219–1220. [DOI] [PubMed] [Google Scholar]
- 12.Sofic E, Riederer P, Heinsen H, et al. Increased iron (III) and total iron content in post mortem substantia nigra of parkinsonian brain. J Neural Transm 1988;74(3):199–205. [DOI] [PubMed] [Google Scholar]
- 13.Wang Z, Luo XG, Gao C. Utility of susceptibility-weighted imaging in Parkinson’s disease and atypical Parkinsonian disorders. Transl Neurodegener 2016;5:17. [DOI] [PMC free article] [PubMed] [Google Scholar]
- 14.Du G, Wang E, Sica C, et al. Dynamics of Nigral Iron Accumulation in Parkinson’s Disease: From Diagnosis to Late Stage. Mov Disord 2022;37(8):1654–1662. [DOI] [PMC free article] [PubMed] [Google Scholar]
- 15.Du G, Lewis MM, Sica C, et al. Distinct progression pattern of susceptibility MRI in the substantia nigra of Parkinson’s patients. Mov Disord 2018;33(9):1423–1431. [DOI] [PMC free article] [PubMed] [Google Scholar]
- 16.Ward RJ, Zucca FA, Duyn JH, Crichton RR, Zecca L. The role of iron in brain ageing and neurodegenerative disorders. Lancet Neurol 2014;13(10):1045–1060. [DOI] [PMC free article] [PubMed] [Google Scholar]
- 17.Yamamoto A, Shin RW, Hasegawa K, et al. Iron (III) induces aggregation of hyperphosphorylated tau and its reduction to iron (II) reverses the aggregation: implications in the formation of neurofibrillary tangles of Alzheimer’s disease. J Neurochem 2002;82(5):1137–1147. [DOI] [PubMed] [Google Scholar]
- 18.Uversky VN, Li J, Fink AL. Metal-triggered structural transformations, aggregation, and fibrillation of human alpha-synuclein. A possible molecular NK between Parkinson’s disease and heavy metal exposure. J Biol Chem 2001;276(47):44284–44296. [DOI] [PubMed] [Google Scholar]
- 19.Kostka M, Hogen T, Danzer KM, et al. Single particle characterization of iron-induced pore-forming alpha-synuclein oligomers. J Biol Chem 2008;283(16):10992–11003. [DOI] [PubMed] [Google Scholar]
- 20.Lewis MM, Du G, Baccon J, et al. Susceptibility MRI captures nigral pathology in patients with parkinsonian syndromes. Movement Disorders 2018;33(9):1432–1439. [DOI] [PMC free article] [PubMed] [Google Scholar]
- 21.Rosenthal LS, Drake D, Alcalay RN, et al. The NINDS Parkinson’s disease biomarkers program. Mov Disord 2016;31(6):915–923. [DOI] [PMC free article] [PubMed] [Google Scholar]
- 22.Armstrong MJ, Okun MS. Diagnosis and Treatment of Parkinson Disease: A Review. JAMA 2020;323(6):548–560. [DOI] [PubMed] [Google Scholar]
- 23.Hyman BT, Phelps CH, Beach TG, et al. National Institute on Aging-Alzheimer’s Association guidelines for the neuropathologic assessment of Alzheimer’s disease. Alzheimers Dement 2012;8(1):1–13. [DOI] [PMC free article] [PubMed] [Google Scholar]
- 24.Beach TG, Adler CH, Lue L, et al. Unified staging system for Lewy body disorders: correlation with nigrostriatal degeneration, cognitive impairment and motor dysfunction. Acta Neuropathol 2009;117(6):613–634. [DOI] [PMC free article] [PubMed] [Google Scholar]
- 25.McKeith IG, Dickson DW, Lowe J, et al. Diagnosis and management of dementia with Lewy bodies: third report of the DLB Consortium. Neurology 2005;65(12):1863–1872. [DOI] [PubMed] [Google Scholar]
- 26.Liu T, Wisnieff C, Lou M, Chen W, Spincemaille P, Wang Y. Nonlinear formulation of the magnetic field to source relationship for robust quantitative susceptibility mapping. Magn Reson Med 2013;69(2):467–476. [DOI] [PubMed] [Google Scholar]
- 27.Liu T, Xu W, Spincemaille P, Avestimehr AS, Wang Y. Accuracy of the morphology enabled dipole inversion (MEDI) algorithm for quantitative susceptibility mapping in MRI. IEEE Trans Med Imaging 2012;31(3):816–824. [DOI] [PMC free article] [PubMed] [Google Scholar]
- 28.Safai A, Prasad S, Chougule T, Saini J, Pal PK, Ingalhalikar M. Microstructural abnormalities of substantia nigra in Parkinson’s disease: A neuromelanin sensitive MRI atlas based study. Hum Brain Mapp 2020;41(5):1323–1333. [DOI] [PMC free article] [PubMed] [Google Scholar]
- 29.Avants BB, Tustison NJ, Song G, Cook PA, Klein A, Gee JC. A reproducible evaluation of ANTs similarity metric performance in brain image registration. Neuroimage 2011;54(3):2033–2044. [DOI] [PMC free article] [PubMed] [Google Scholar]
- 30.Macenko M, Niethammer M, Marron JS, et al. A Method for Normalizing Histology Slides for Quantitative Analysis. 2009 Ieee International Symposium on Biomedical Imaging: From Nano to Macro, Vols 1 and 2 2009:1107-+. [Google Scholar]
- 31.Groger A, Berg D. Does structural neuroimaging reveal a disturbance of iron metabolism in Parkinson’s disease? Implications from MRI and TCS studies. J Neural Transm (Vienna) 2012;119(12):1523–1528. [DOI] [PubMed] [Google Scholar]
- 32.Gerlach M, Trautwein AX, Zecca L, Youdim MB, Riederer P. Mossbauer spectroscopic studies of purified human neuromelanin isolated from the substantia nigra. J Neurochem 1995;65(2):923–926. [DOI] [PubMed] [Google Scholar]
- 33.Shima T, Sarna T, Swartz HM, Stroppolo A, Gerbasi R, Zecca L. Binding of iron to neuromelanin of human substantia nigra and synthetic melanin: an electron paramagnetic resonance spectroscopy study. Free Radic Biol Med 1997;23(1):110–119. [DOI] [PubMed] [Google Scholar]
- 34.Zecca L, Swartz HM. Total and paramagnetic metals in human substantia nigra and its neuromelanin. J Neural Transm Park Dis Dement Sect 1993;5(3):203–213. [DOI] [PubMed] [Google Scholar]
- 35.Lee H, Baek SY, Kim EJ, Huh GY, Lee JH, Cho H. MRI T2 and T2* relaxometry to visualize neuromelanin in the dorsal substantia nigra pars compacta. Neuroimage 2020;211:116625. [DOI] [PubMed] [Google Scholar]
- 36.Agarwal D, Sandor C, Volpato V, et al. A single-cell atlas of the human substantia nigra reveals cell-specific pathways associated with neurological disorders. Nature communications 2020;11(1):4183. [DOI] [PMC free article] [PubMed] [Google Scholar]
- 37.Connor JR, Menzies SL, St Martin SM, Mufson EJ. Cellular distribution of transferrin, ferritin, and iron in normal and aged human brains. J Neurosci Res 1990;27(4):595–611. [DOI] [PubMed] [Google Scholar]
- 38.Zecca L, Gallorini M, Schunemann V, et al. Iron, neuromelanin and ferritin content in the substantia nigra of normal subjects at different ages: consequences for iron storage and neurodegenerative processes. J Neurochem 2001;76(6):1766–1773. [DOI] [PubMed] [Google Scholar]
- 39.Friedrich I, Reimann K, Jankuhn S, et al. Cell specific quantitative iron mapping on brain slices by immuno-microPIXE in healthy elderly and Parkinson’s disease. Acta Neuropathol Commun 2021;9(1):47. [DOI] [PMC free article] [PubMed] [Google Scholar]
- 40.Mirza B, Hadberg H, Thomsen P, Moos T. The absence of reactive astrocytosis is indicative of a unique inflammatory process in Parkinson’s disease. Neuroscience 2000;95(2):425–432. [DOI] [PubMed] [Google Scholar]
- 41.Martin-Bastida A, Tilley BS, Bansal S, Gentleman SM, Dexter DT, Ward RJ. Iron and inflammation: in vivo and post-mortem studies in Parkinson’s disease. J Neural Transm (Vienna) 2021;128(1):15–25. [DOI] [PubMed] [Google Scholar]
- 42.Kuchibhotla KV, Wegmann S, Kopeikina KJ, et al. Neurofibrillary tangle-bearing neurons are functionally integrated in cortical circuits in vivo. Proceedings of the National Academy of Sciences of the United States of America 2014;111(1):510–514. [DOI] [PMC free article] [PubMed] [Google Scholar]
- 43.Lee VM, Goedert M, Trojanowski JQ. Neurodegenerative tauopathies. Annu Rev Neurosci 2001;24:1121–1159. [DOI] [PubMed] [Google Scholar]
- 44.Narasimhan S, Changolkar L, Riddle DM, et al. Human tau pathology transmits glial tau aggregates in the absence of neuronal tau. J Exp Med 2020;217(2). [DOI] [PMC free article] [PubMed] [Google Scholar]
- 45.Cogswell PM, Wiste HJ, Senjem ML, et al. Associations of quantitative susceptibility mapping with Alzheimer’s disease clinical and imaging markers. Neuroimage 2021;224:117433. [DOI] [PMC free article] [PubMed] [Google Scholar]
- 46.Spotorno N, Acosta-Cabronero J, Stomrud E, et al. Relationship between cortical iron and tau aggregation in Alzheimer’s disease. Brain 2020;143(5):1341–1349. [DOI] [PMC free article] [PubMed] [Google Scholar]
- 47.Choi JY, Cho H, Ahn SJ, et al. Off-Target (18)F-AV-1451 Binding in the Basal Ganglia Correlates with Age-Related Iron Accumulation. J Nucl Med 2018;59(1):117–120. [DOI] [PubMed] [Google Scholar]
- 48.Lemoine L, Leuzy A, Chiotis K, Rodriguez-Vieitez E, Nordberg A. Tau positron emission tomography imaging in tauopathies: The added hurdle of off-target binding. Alzheimer’s & dementia (Amsterdam, Netherlands) 2018;10:232–236. [DOI] [PMC free article] [PubMed] [Google Scholar]
- 49.Perez M, Valpuesta JM, de Garcini EM, et al. Ferritin is associated with the aberrant tau filaments present in progressive supranuclear palsy. The American journal of pathology 1998;152(6):1531–1539. [PMC free article] [PubMed] [Google Scholar]
- 50.Kovacs GG, Milenkovic IJ, Preusser M, Budka H. Nigral burden of alpha-synuclein correlates with striatal dopamine deficit. Mov Disord 2008;23(11):1608–1612. [DOI] [PubMed] [Google Scholar]
- 51.Mochizuki H, Yasuda T. Iron accumulation in Parkinson’s disease. J Neural Transm (Vienna) 2012;119(12):1511–1514. [DOI] [PubMed] [Google Scholar]
Associated Data
This section collects any data citations, data availability statements, or supplementary materials included in this article.
Supplementary Materials
Data Availability Statement
Raw data were generated at the Penn State Health-Milton S. Hershey Medical Center. Derived data supporting the findings are available from the corresponding author on request.