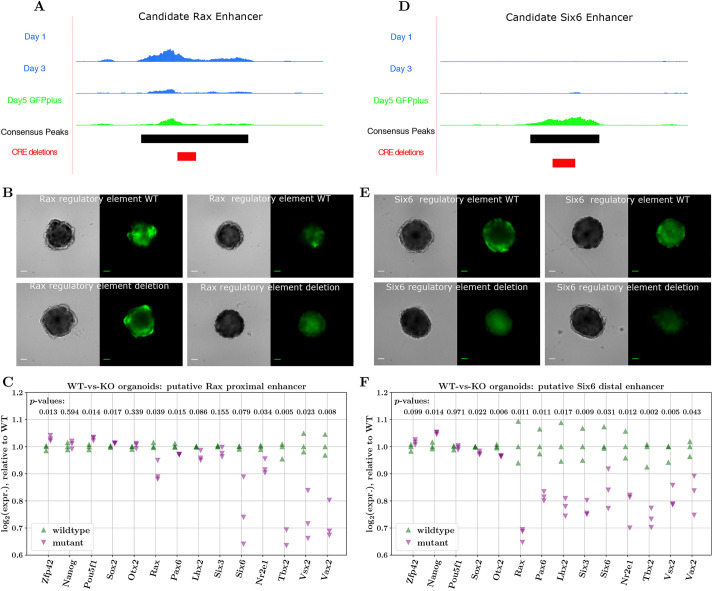
Fig. 6.
Changes in expression of key TFs upon disruption of putative EFTF CREs. (A,D) Bigwig tracks of candidate Rax and Six6 enhancers, displaying accessibility changes across days 1, 3 and 5, consensus peaks and regions deleted by CRISPR. (B,E) Brightfield and GFP images of day 5 organoids derived from CRISPR-Cas9-edited cell lines with wild-type (WT; top) or mutant sequences for the predicted Rax and Six6 CREs. Images represent the variability seen in organoid structure and GFP expression. Twenty-four organoids were grown in three replicates, and all showed similar levels of variation between organoids. Scale bars: 100 µm. (C,F) NanoString quantification of gene expression between WT and mutant (KO) organoids for the proximal Rax (C) and distal Six6 (F) enhancers (WT/mutant differences in log2 expression tested using Welch's t-test).

