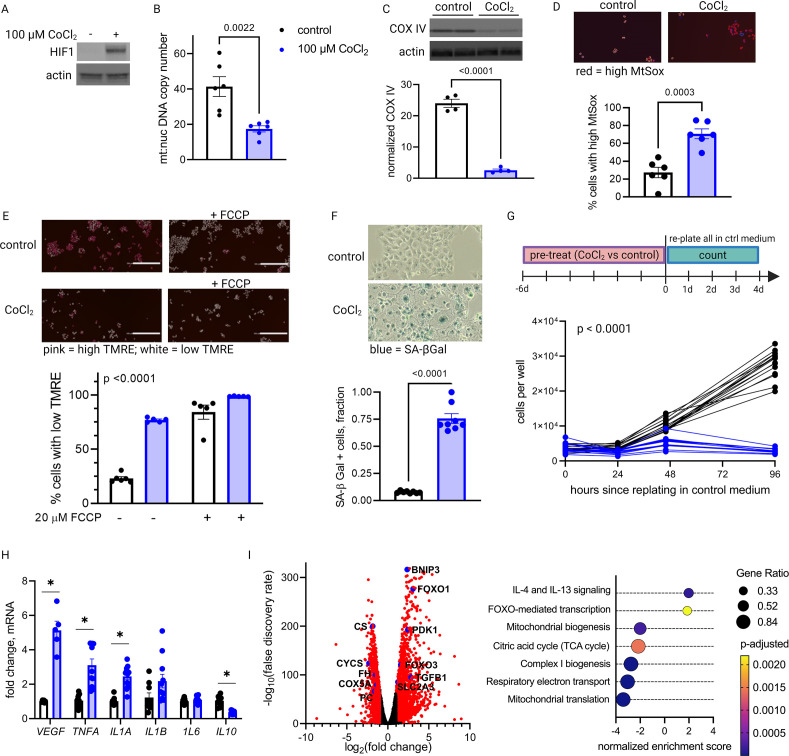
Figure 5. Long-term hypoxia-inducible factor 1 (HIF-1) stabilization in JAR cells leads to mitochondrial dysfunction, cellular senescence, and metabolic reprogramming.
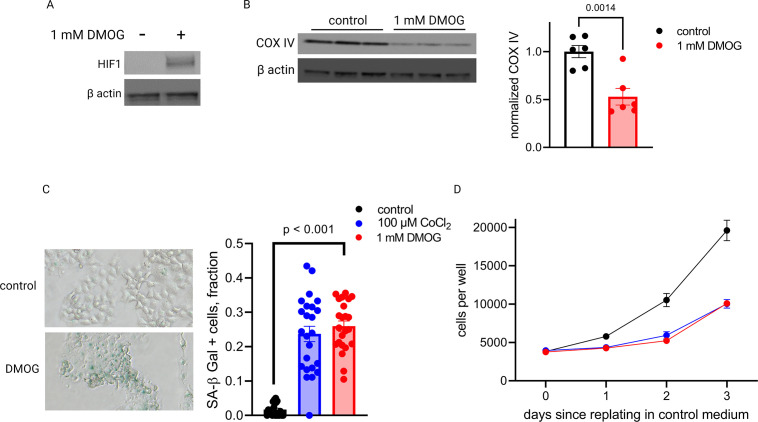
HIF-1 is stabilized at 6-day timepoint of CoCl2 exposure (A). After 6 days, mitochondrial abundance is decreased as reflected by a drop in the mitochondrial:nuclear DNA copy number (B) and a decrease in COX IV protein (C). (See Figure 5—figure supplement 1 for timecourse of declining mitochondrial abundance.) Cells also exhibit augmented signs of mitochondrial dysfunction via MtSox (D; p=0.0003) and tetramethylrhodamine ethyl ester (TMRE) staining (E; two-way ANOVA CoCl2 factor p<0.0001). Senescence-associated beta galactosidase (SA-βGal) staining reflects a high proportion of senescent cells (F; p<0.0001) and growth arrest is confirmed by cell counting following a 6-day pre-treatment with CoCl2 (G; two-way ANOVA p<0.0001 for interaction of CoCl2 factor with time). (See Figure 5—figure supplement 2 for assessment of cell death by propidium iodide staining.) mRNA expression of senescence-associated secretory phenotype (SASP) candidates VEGF, TNFA, IL1A, and IL10 is altered after CoCl2 exposure (H; *, adjusted p<0.01). RNA-Seq revealed upregulation of 2188 and downregulation of 1389 genes (I; genes with |log2(FC)|>1 and -log(FDR)>2 indicated in red) after CoCl2 treatment, with gene set enrichment analysis revealing several pathways significantly dysregulated after CoCl2 treatment recapitulating changes seen in transcriptomic analysis of late versus early gestation mouse placenta. Scale marker = 200 μm. FCCP = carbonyl cyanide 4-(trifluoromethoxy) phenylhydrazone, an ionophore uncoupler of oxidative phosphorylation which depolarizes mt membrane potential. See Figure 5—figure supplement 3 for assessment of effects of HIF-1 stabilization in JAR cells using dimethyloxalyl glycine (DMOG). Each data point represents a technical replicate (measurement from an independent well of cells grown in treatment vs control condition). Data normalized to mean of control group. See Figure 5—source data 1 for uncropped blots.
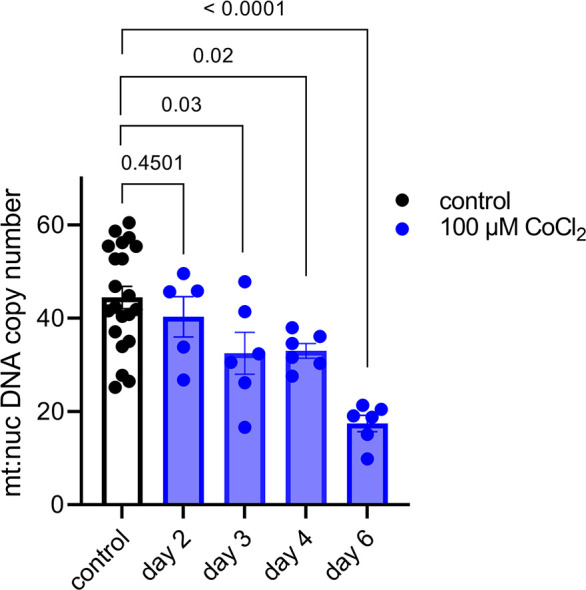
Figure 5—figure supplement 1. The mitochondrial effects of hypoxia-inducible factor 1 (HIF-1) stabilization in JAR cells begin to appear on day 3 following CoCl2 exposure.

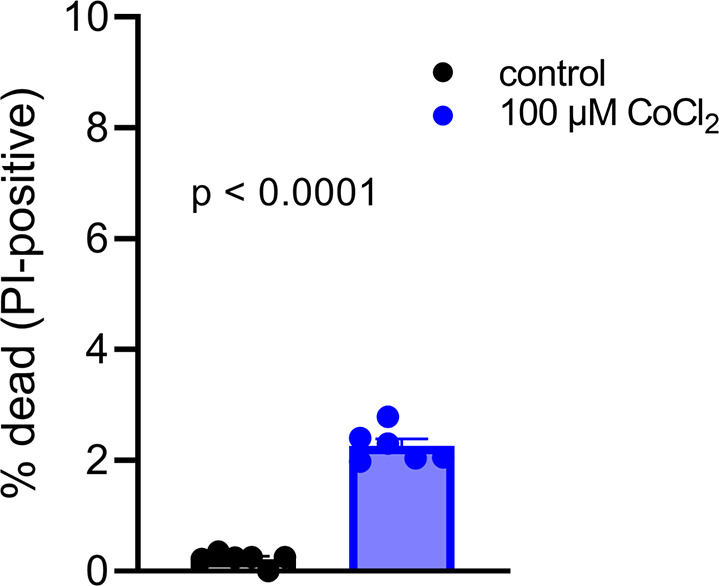
Figure 5—figure supplement 2. Increased number of JAR cells stain with propidium iodide, but the absolute number remains low following 6 days of CoCl2 treatment.


