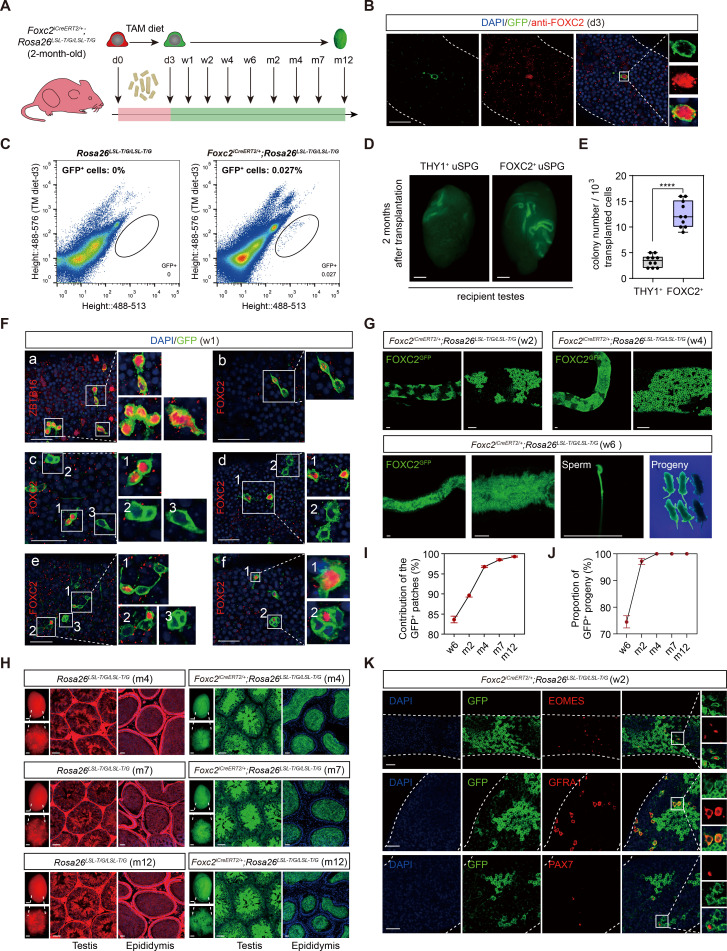
Figure 2. Lineage tracing and functional validation of FOXC2+ spermatogonial stem cells (SSCs) in Foxc2iCreERT2/+;Rosa26LSL-T/G/LSL-T/G mice.
(A) Schematic illustration of the lineage tracing workflow for FOXC2+ cells. (B) Immunostainings for DAPI (blue) and FOXC2 (red) at day 3 post TAM induction. Scale bar, 50 μm; d, day. (C) Fluorescence-activated cell sorting (FACS) analysis of GFP+ populations derived from Rosa26LSL-T/G/LSL-T/G or Foxc2iCreERT2/+;Rosa26LSL-T/G/LSL-T/G mice at day 3 post TAM induction. (D, E) The recipient mice testes (D) and colony numbers (E) 2 months after transplantation (n=10) of the FACS-sorted GFP+ cells from the Foxc2iCreERT2/+;Rosa26LSL-T/G/LSL-T/G mice 3 days after TAM diet and the FACS-sorted THY1+ cells from adult mice. Scale bar, 1 mm; values, mean ± s.e.m.; p-values were obtained using two-tailed t-tests (****p-value <0.0001). (F) Immunostaining for DAPI (blue), ZBTB16/FOXC2 (red), and GFP (green) at week 1 post TAM induction (scale bar, 50 μm). (G) Seminiferous tubules of Foxc2iCreERT2/+;Rosa26LSL-T/G/LSL-T/G mice 2, 4, and 6 weeks post TAM induction. Scale bar, 50 μm. (H) Testes (scale bar, 1 mm), seminiferous tubules, and epididymis (scale bar, 50 μm) at months 4, 7, and 12 post TAM induction in Foxc2iCreERT2/+;Rosa26LSL-T/G/LSL-T/G mice. (I, J) The GFP+ patches (I) and progeny (J) population dynamics (n=10). Values, mean ± s.e.m. (K) Immunostainings for DAPI (blue), EOMES (red), GFRA1 (red), or PAX7 (red) in GFP+ population at week 2 post TAM induction. Scale bar, 50 μm.


