. 2023 Mar 24;12:e82690. doi: 10.7554/eLife.82690

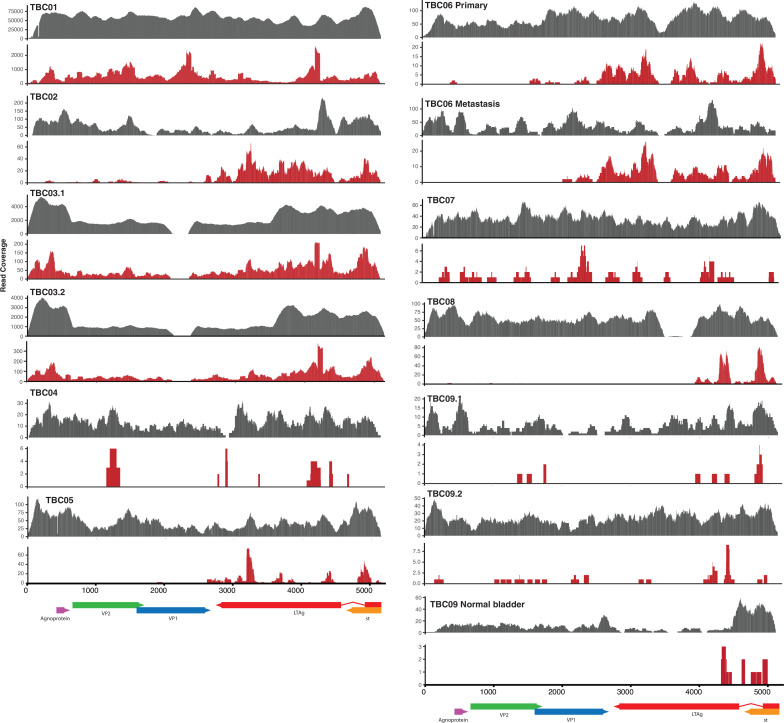
Figure 1. Detection of viral sequences.

(A) Primary tumors. (B) Metastatic tumors. (C) Normal tissues. Viral species are shown on the rows, and each case in the cohort (represented with a TBC number) is a column. TBC numbers represent a single case and are consistent across primary, metastatic, and normal tissues. Circle size represents the breadth or fraction of the viral genome covered, and color represents the average depth of coverage of the viral k-mers with all coverages over 100 binned together. Specimens without sequencing data have a gray background.

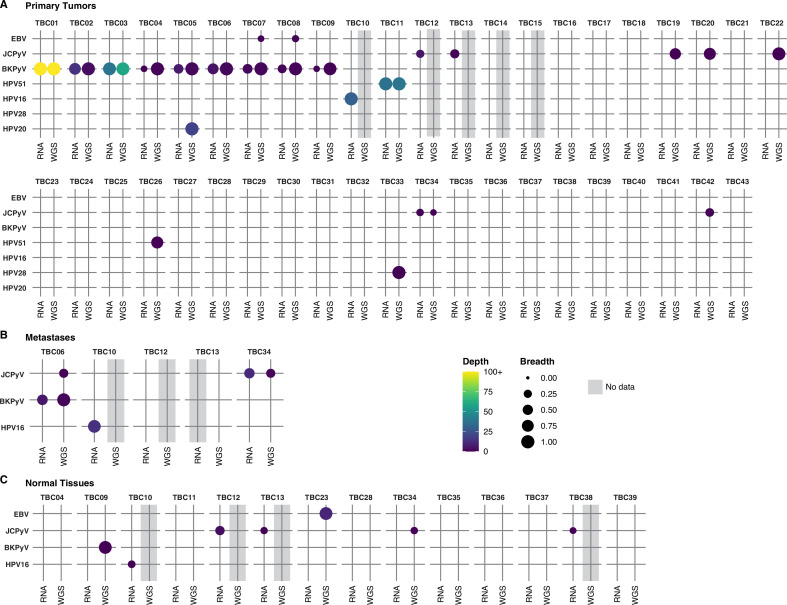
Figure 1.

Figure 1—figure supplement 1. BK polyomavirus (BKPyV) DNA/RNA coverage plots.

Figure 1—figure supplement 1.

Coverage plots for BKPyV DNA (gray) and RNA (red) in BKPyV-positive tumors.
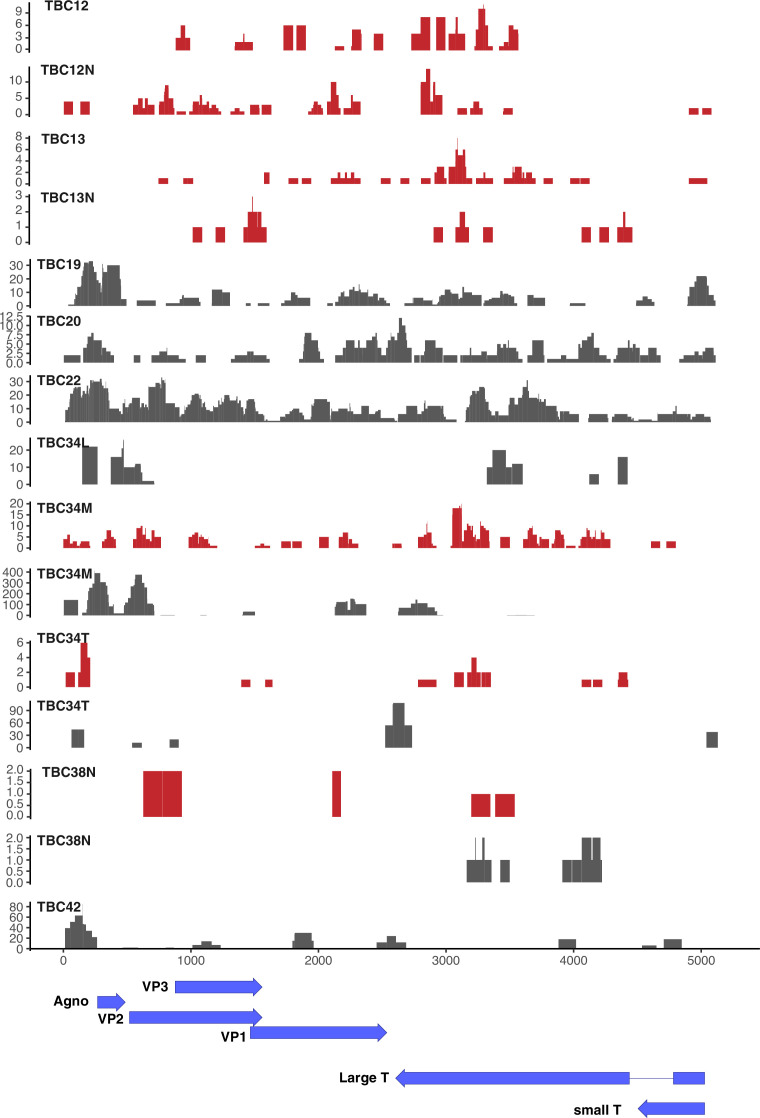
Figure 1—figure supplement 2. JC polyomavirus (JCPyV) DNA/RNA coverage plots.

Figure 1—figure supplement 2.

Coverage plots for JCPyV DNA (gray) and RNA (red) in JCPyV-positive tumors.
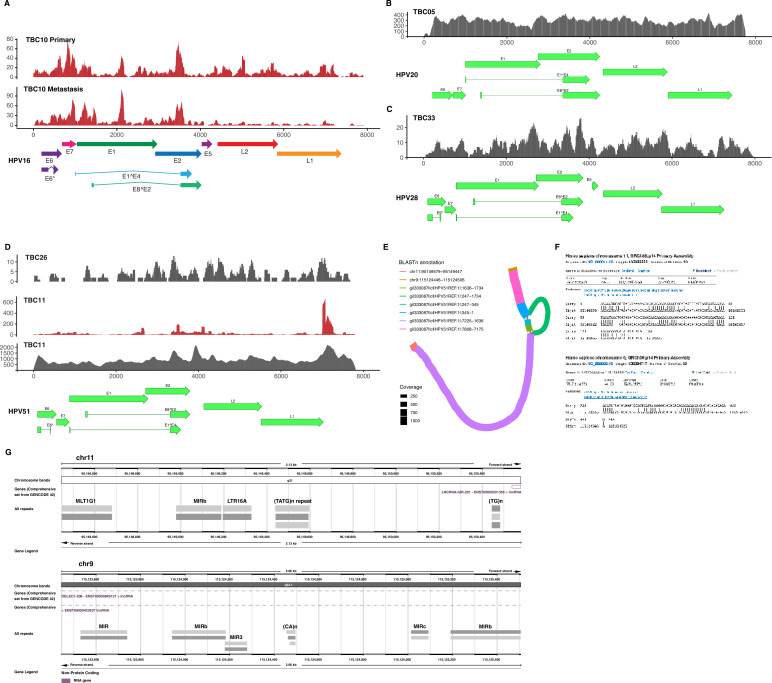
Figure 1—figure supplement 3. All human papillomavirus (HPV) DNA/RNA coverage plots.

Figure 1—figure supplement 3.

(A-D) Coverage plots for HPV DNA (gray) and RNA (red) in HPV16 (A), HPV20 (B), HPV28 (C), and HPV51 (D) -positive tumors. Diagrams of open reading frames for each respective type are below the coverage plots. (E) Annotated assembly graph of TBC11 HPV51. (F) Details of the top human BLASTn hits from the assembly in (E). (G) 1 kb upstream and downstream of TBC11 HPV51 predicted human integration junctions with genes and repeats annotated.