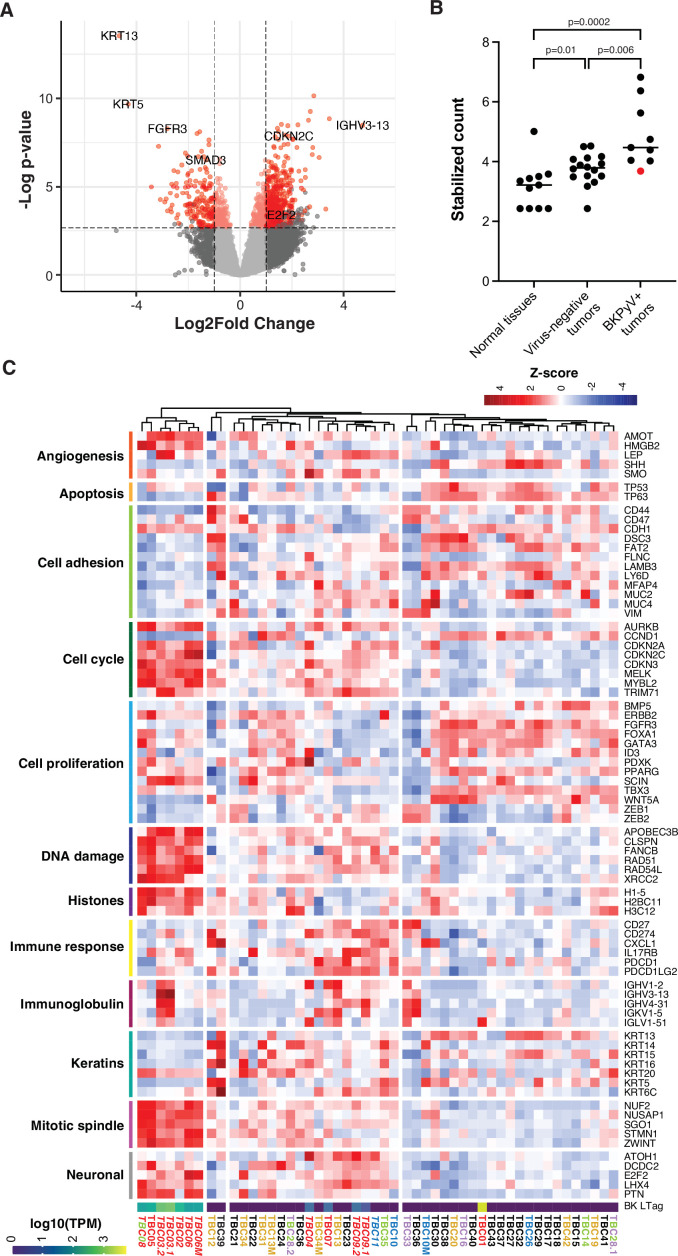
Figure 4. Differential gene expression in BK polyomavirus (BKPyV)-positive tumors.
(A) Volcano plot of differential gene expression between BKPyV-positive and virus-negative tumors. Significantly differentially expressed genes (q-value <0.05, DESeq2) with a fold change greater than two are in red, and genes with a fold change less than two are in pink. Non-significant genes are in gray. (B) Variance stabilized counts for APOBEC3B expression from DESeq2 grouped by normal tissues, virus-negative tumors, and BKPyV-positive tumors showing significantly increased expression in BKPyV-positive tumors (Mann-Whitney U test). TBC01 is indicated by a red dot. (C) Heatmap of Z-scores of significantly differentially expressed genes and genes relevant to bladder cancer grouped by gene ontology. High expression is red, low expression is blue. Tumors names are colored by likely etiology: BKPyV-positive, red; JC polyomavirus (JCPyV)-positive, goldenrod; HR-HPV-positive, blue; torque teno virus (TTV)-positive, green; aristolochic acid, purple; undetermined, black; multiple colors reflect multiple detected viruses or etiologies. Tumors with evidence of integration are in italics. BKPyV LTag expression is shown as log10(transcripts per million [TPM]).
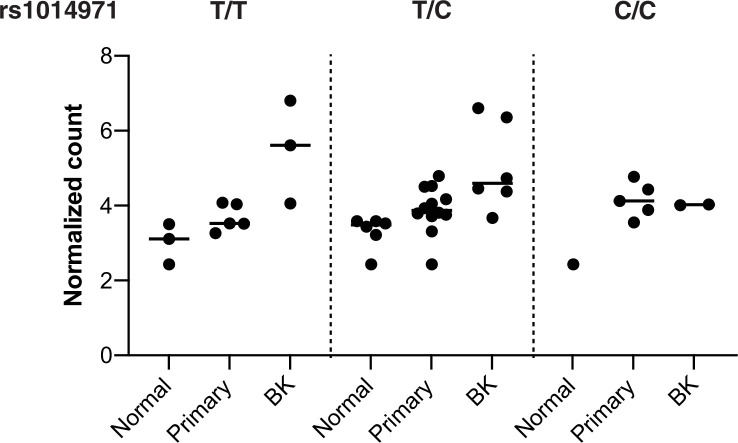
Figure 4—figure supplement 1. APOBEC3B germline variant and expression by BK polyomavirus (BKPyV) status.
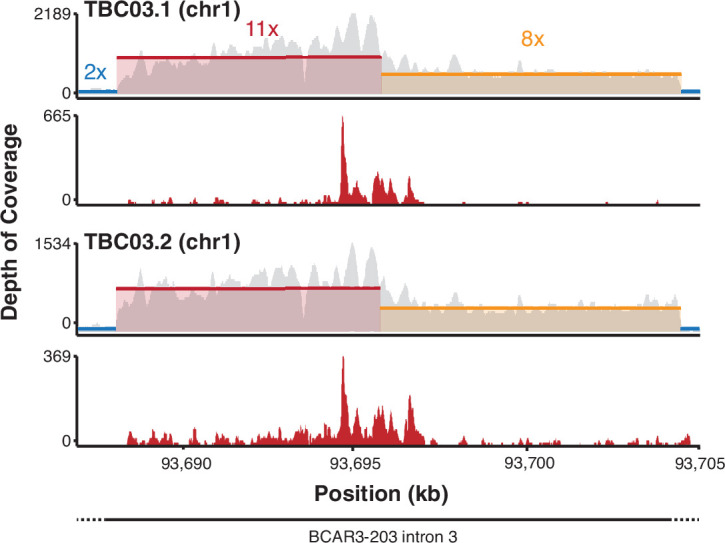
Figure 4—figure supplement 2. Host transcripts from the BK polyomavirus (BKPyV) integration site at BCAR3.


