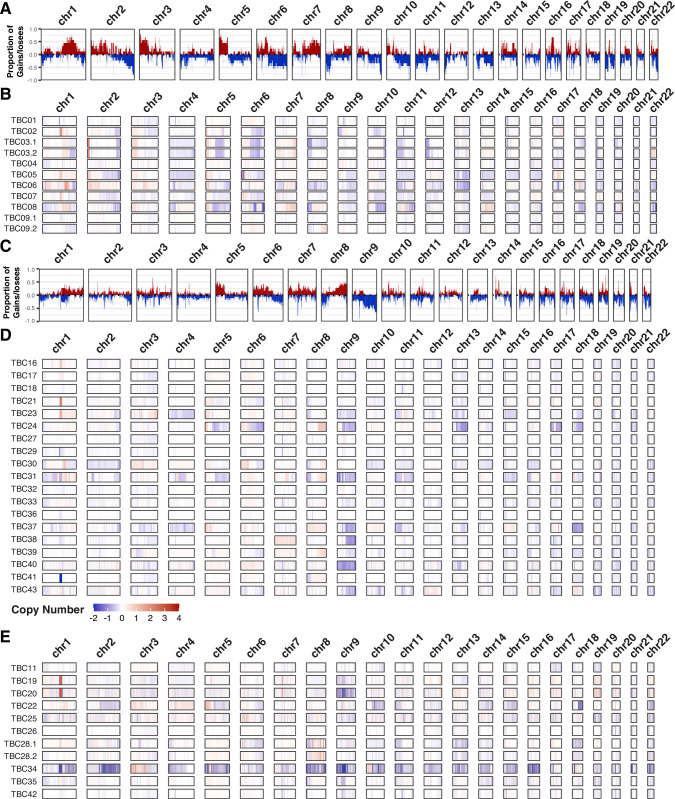
Figure 5. Copy number variants.
Frequency plots for large copy number variants in BK polyomavirus (BKPyV)-positive tumors (panel A) and virus-negative tumors (panel C). Frequency of gains/amplifications is shown in red; losses/deletions are shown in blue. Sample level copy number variant spectra for BKPyV-positive tumors (panel B), virus-negative tumors (panel D), and all other tumors (panel E). Complete deletions are in dark blue and high copy amplifications are in red.

