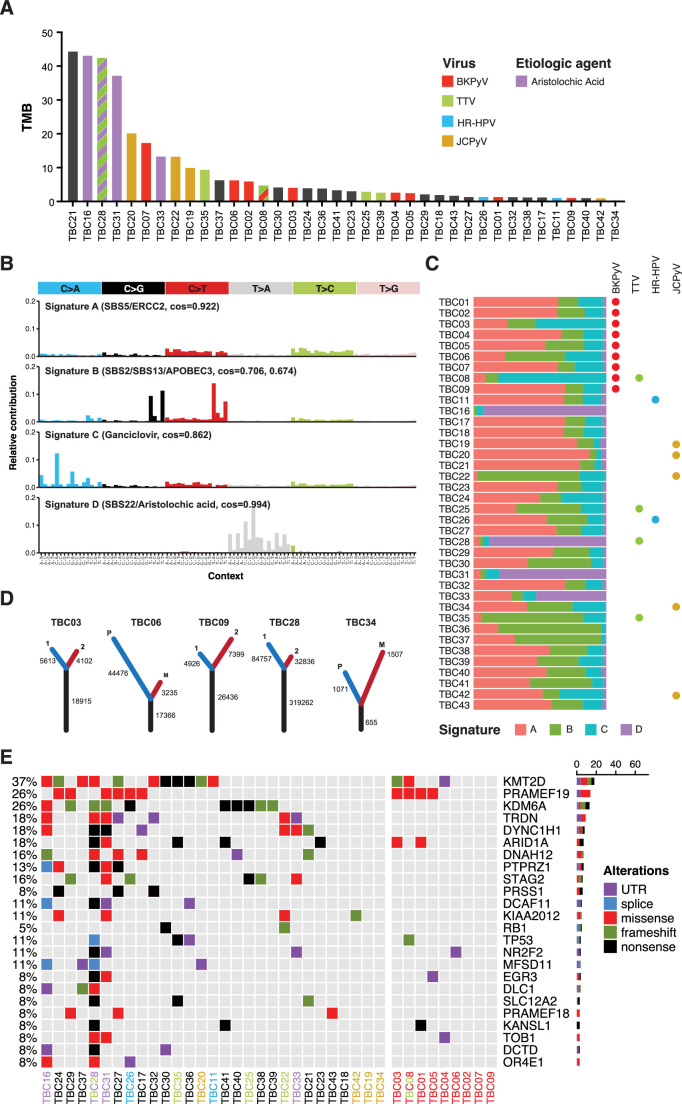
Figure 6. Somatic point mutations and mutation signature analysis.
(A) Tumor mutation burden (TMB, non-synonymous mutations per million bases) for each tumor in this study. Bars are colored by viral positivity (red, BK polyomavirus (BKPyV); green, TTV; blue, HR-HPV; goldenrod, JC polyomavirus (JCPyV)) or etiologic agent (aristolochic acid, purple; black, undetermined). Multiple colors reflect multiple detected viruses or etiologies. (B) Barplots of the contribution of each trinucleotide substitution for the four deconvoluted signatures with the likely mutation process indicated. (C) Proportion of each deconvoluted signature that contributes to each sample with virus status indicated by colored circles (red, BKPyV; green, TTV; blue, HR-HPV; goldenrod, JCPyV). (D) Number of unique and common trunk mutations in primary-metastatic tumor pairs and tumors with multi-region sequencing. For TBC03, TBC09, and TBC28, branches one and two refer to two separate areas of the same tumor. For TBC06 and TBC34, branches P and M refer to the primary tumor and metastasis, respectively. (E) Oncoprint for the top mutated genes in bladder cancers of transplant patients. Tumors IDs are colored by likely etiology: BKPyV-positive, red; JCPyV-positive, goldenrod; HR-HPV-positive, blue; TTV-positive, green; aristolochic acid, purple; undetermined, black. The percent of modified tumors is shown on the left and the count of the variants in each gene is represented by the barplot on the right.


