

Abstract
Background
Evidence on the influence of programmed death‐ligand 1 (PD‐L1) expression on the efficacy of epidermal growth factor receptor tyrosine kinase inhibitors (EGFR‐TKIs) in EGFR‐mutant non‐small cell lung cancer (NSCLC) patients is at variance.
Methods
A single‐center retrospective study was conducted to evaluate the influence of PD‐L1 expression on the efficacy of EGFR‐TKIs for NSCLC patients with EGFR mutation. Clinical information was retrieved from electronic medical records. The patients were divided into three subgroups according to PD‐L1 expression level: PD‐L1 < 1% (negative), PD‐L1 1%–49% and PD‐L1 ≥ 50%. The clinicopathological features, overall response rate (ORR), progression‐free survival (PFS) and comutation information were collected and compared between the three subgroups.
Results
A total of 117 patients were included. For PD‐L1 < 1%, PD‐L1 1%–49% and PD‐L1 ≥ 50% group, there were 39 (33.3%), 51 (43.5%) and 27 (23.0%) patients respectively, and the ORR was 43.2%, 64.0%, and 51.9%, respectively (p = 0.162), and the median progression‐free survival (mPFS) was 22.0 months (95% CI: 14.0–29.9 months), 15.4 months (95% CI: 8.9–21.8 months) and 13.0 months (95% CI: 10.6–15.3 months), respectively (log‐rank, p = 0.01). The mPFS was negatively correlated with PD‐L1 expression level (r = −0.264, p = 0.041) and PD‐L1 expression was an independent risk factor for worse PFS of EGFR‐TKIs in multivariate Cox regression. Patients with concurrent TP53 mutation had shorter PFS (p = 0.039) and the patients harboring both mutant TP53 and positive PD‐L1 had the shortest PFS (p = 0.006).
Conclusions
The efficacy of EGFR‐TKIs was influenced by the baseline PD‐L1 expression. Higher PD‐L1 expression was associated with shorter PFS. The combined indicators of TP53 and PD‐L1 identified subgroups showing divergent benefits from EGFR‐TKIs.
Keywords: efficacy, epidermal growth factor receptor, programmed death‐ligand 1, tumor protein 53, tyrosine kinase inhibitors
The PD‐L1 expression was negatively related to the PFS of EGFR‐TKIs in EGFRm NSCLC. Stratified analysis based on the PD‐L1 expression level should be preplanned in future prospective trials aiming to evaluate the clinical efficacy of EGFR‐TKIs.

INTRODUCTION
Lung cancer remains one of the most common and fatal malignant diseases in China. As the molecular mechanism of the oncogenesis in non‐small cell lung cancer (NSCLC) discovered, the treatment landscape has been dramatically changed by small molecular drugs designed to target specific actionable mutations. Tyrosine kinase inhibitors (TKIs) targeting epidermal growth factor receptor (EGFR) mutations represent one of these small molecular drugs, which have brought considerable survival benefits to patients with sensitive EGFR mutations compared to traditional chemotherapy. 1 However, some patients are prone to develop early drug resistance, of which the underlying mechanism remains unclear.
Immune checkpoints are a group of molecules expressed on the surface of immune cells and function as immunosuppressive molecules which, under a physiological condition, prevent autoimmunity. Tumor cells take advantage of this mechanism by upregulating the expression of immunosuppressive molecules (i.e., programmed death‐ligand 1, PD‐L1) to escape the attack from immune effector cells. Immune‐checkpoint inhibitors (ICIs) restore antitumor immunity by blocking the interaction between immune‐suppressive molecules expressed on tumor cells and their ligands on immune cells (i.e., PD‐1). Correspondingly, clinical trials have related high expression of PD‐L1 to good efficacy of immunotherapy‐based treatment in metastatic and early settings of NSCLC patients. 2 Nevertheless, it has been reported that only patients without actionable driver mutations could benefit from immunotherapy‐based therapy, while for patients harboring actionable driver mutations, the efficacy of ICIs was scarcely satisfactory regardless of PD‐L1 expression. 3 , 4 This could result from the uninflamed microenvironment of EGFR‐mutant (EGFRm) NSCLC characterized by lack of T cell infiltration, high frequency of inactive tumor infiltrating lymphocytes and decreased immune‐related gene expression and tumor mutation burden. 5 , 6 , 7
Although previous studies have revealed decreased PD‐L1 expression with EGFRm than EGFR wild‐type (EGFRw) NSCLC, 6 , 8 the activation of the EGFR pathway has been reported to induce PD‐L1 expression in NSCLC cell lines. 9 In addition, the expression of CD274, which encodes PD‐L1, could also be upregulated through inflammation mediated by interferon (IFN)‐𝛾. 10 Whether and how the efficacy of targeted therapy would be affected by the PD‐L1 expression level remains controversial. Lan et al. conducted a meta‐analysis on the prognostic effects of PD‐L1 expression on EGFR‐TKIs treatment and found that PD‐L1 expression was correlated with the ORR rather than PFS or OS of EGFR‐TKIs therapy; however, obvious heterogeneity was identified among included studies. 11 Liu et al. and Kang et al. evidenced each other by concluding that patients with high PD‐L1 expression had shorter PFS with EGFR‐TKIs treatment and the PD‐L1 expression was prognostic. 12 , 13 However, Dissing et al. and Chang et al. found no significant difference in the duration of EGFR‐TKIs treatment between different PD‐L1 expression groups in a Danish and Asian cohort, respectively. 14 , 15 The inconsistency of the conclusion warrants the necessity of further data supplementation and presentation of evidence.
In this regard, this retrospective study aimed to add to this topic by investigating the characteristics of PD‐L1 expression in EGFR‐mutant NSCLC and whether and how different PD‐L1 expression level influences the efficacy of EGFR‐TKIs.
METHODS
Patient eligibility and data collection
The clinical data between December 29, 2017 to March 11, 2023 from the National Cancer Center/National Clinical Research Center for Cancer/Cancer Hospital were retrospectively retrieved from electronic records. Patients were considered eligible for enrollment if the following criteria were met: (1) Histologically confirmed NSCLC; (2) Harboring EGFR mutations (including exon 19 deletion, exon 21 L858R, exon 18 G719X, exon 18 E709K, exon 20 S768I and exon 21 L861Q) and treated with EGFR‐TKIs and (3) PD‐L1 expression tested before initiation of TKI treatment. Exclusion criteria included: (1) Harboring EGFR exon 20 insertions or other point mutations of unknown clinical significance and (2) having incomplete records hindering data analysis. The study was approved by the Research Ethics Board and conducted under the Declaration of Helsinki with informed consent waived for its retrospective nature.
Gene alterations and PD‐L1 expression testing
Tumor tissue or cells obtained from biopsy, surgical resection or centrifugated pleural effusion deposit were tested for gene alterations using next‐generation sequencing (NGS) or polymerase chain reaction (PCR) methods by the department of pathology of our center or by third‐party genetic testing companies that had accredited qualifications from College of American Pathologists (CAP). PD‐L1 immunohistochemistry was performed on the tumor samples from the same tissue origin with the Dako 22C3 pharmDx test kit. The PD‐L1 tumor proportion score (TPS) was calculated as the number of viable tumor cells presenting complete or partial membrane staining divided by the total number of all tumor cells multiplied by 100.
Statistical analysis
The data cutoff date was March 11, 2023. Frequency was applied to describe categorical variables, and the χ 2 test or Fisher's exact test was used for comparison between different groups. Measurement data fitting the normal distribution are displayed as mean and standard deviation and were compared by t‐test. Correlation analysis was conducted using Pearson's correlation if the data were normally distributed and Spearman's rank correlation was applied if the data were not. Survival data are illustrated by Kaplan–Meier curves and were compared by log‐rank test. The median follow‐up time was calculated using the reverse Kaplan–Meier method. Univariate and multivariate analyses were performed using Cox proportional hazards. An α value of 0.05 was used as the examination standard. Statistical analysis software used was SPSS Statistics version 25.0, and analytic graphs were created using GraphPad Prism 9.4.1 and R version 4.2.2.
RESULTS
Baseline characteristics
A total of 117 patients harboring EGFR mutations were enrolled in this study and the flow diagram of patient disposition is shown in Figure 1. The median follow‐up time was 19.6 months. There were 39 (33.3%), 51 (43.5%) and 27 (23.0%) patients in PD‐L1 <1% (dubbed “negative” in the following context), 1%–49% and ≥50% group, respectively. The clinicopathological characteristics of the three different levels of PD‐L1 expression are shown in Table 1. The mean age of all enrolled patients was 59.9 ± 10.1 years and 69 (58.9%) of them were female. A total of 77 (65.8%) patients were nonsmokers, and 103 (88.0%) had stage IV disease. Brain metastasis was diagnosed in 41 (35.1%) patients. A total of 111 (94.8%) patients had Eastern Cooperative Oncology Group performance status (ECOG PS) scoring 1 or less. The composition of EGFR mutation subtypes was different among the three PD‐L1 expression groups (p = 0.007). Compared to the 19del and uncommon EGFR mutations, L858R had the highest proportion of PD‐L1 ≥ 50% (L858R vs. 19del vs. uncommon: 33.3% vs. 14.5% vs. 13.3%, p = 0.051). Patients with L858R mutation were significantly more likely to have high PD‐L1 expression than those with 19del (p = 0.038) (Figure 2a). Ninety (76.9%) patients had less than three remote metastases and 107 (91.5%) patients received first‐line EGFR‐TKIs when enrolled. Over one‐half of enrolled patients received third‐generation TKIs (52.1%), second‐generation TKIs came second (28.2%), and first‐generation were last (19.7%). A total of 65% (76/117) of tumor samples came from lung tissue and lymph nodes came second accounting for 17.0% (20/117).
FIGURE 1.

Flow diagram of patient disposition.
TABLE 1.
Baseline clinicopathological characteristics of the whole cohort and groups with different PD‐L1 expression levels.
| PD‐L1 expression subgroups | p‐value | ||||
|---|---|---|---|---|---|
| Total | Negative | 1%–49% | ≥50% | ||
| Characteristics | (N = 117) | (N = 39) | (N = 51) | (N = 27) | |
| Age mean (SD) | 59.9 (10.1) | 57.8 (9.8) | 60.5 (9.6) | 61.8 (11.0) | 0.253 |
| Sex | 1.000 | ||||
| Male | 48 (41.1%) | 16 | 21 | 11 | |
| Female | 69 (58.9%) | 23 | 30 | 16 | |
| Smoking history | 0.578 | ||||
| No | 77 (65.8%) | 28 | 33 | 16 | |
| Yes | 40 (34.2%) | 11 | 18 | 11 | |
| Stage | 0.279 | ||||
| IV | 103 (88.0%) | 32 | 45 | 26 | |
| III | 5 (4.3%) | 3 | 1 | 1 | |
| Recurrence | 9 (7.7%) | 4 | 5 | 0 | |
| ECOG PS | 0.23 | ||||
| 0–1 | 111 (94.8%) | 37 | 50 | 24 | |
| ≥2 | 6 (5.2%) | 2 | 1 | 3 | |
| EGFR mutation subtype | 0.007* | ||||
| L858R | 54 (46.2%) | 22 | 14 | 18 | |
| 19del | 48 (41.0%) | 14 | 27 | 7 | |
| Uncommon a | 15 (12.8%) | 3 | 10 | 2 | |
| Brain metastasis | 0.219 | ||||
| No | 76 (64.9%) | 29 | 29 | 18 | |
| Yes | 41 (35.1%) | 10 | 22 | 9 | |
| Number of organs involved | 0.317 | ||||
| <3 | 90 (76.9%) | 31 | 36 | 23 | |
| ≥3 | 27 (23.1%) | 8 | 15 | 4 | |
| TP53 comutation | 0.614 | ||||
| No | 32 (27.4%) | 10 | 17 | 5 | |
| Yes | 79 (67.5%) | 26 | 32 | 21 | |
| NA | 6 (5.1%) | 3 | 2 | 1 | |
| PI3KCA comutation | 0.764 | ||||
| No | 98 (83.8%) | 30 | 44 | 24 | |
| Yes | 13 (11.1%) | 6 | 5 | 2 | |
| NA | 6 (5.1%) | 3 | 2 | 1 | |
| Application line | 0.123 | ||||
| 1 | 107 (91.5%) | 35 | 49 | 23 | |
| 2 | 7 (5.9%) | 2 | 1 | 4 | |
| ≥3 | 3 (2.5%) | 2 | 1 | 0 | |
| EGFR‐TKIs generation b | 0.479 | ||||
| First generation | 23 (19.7%) | 10 | 8 | 5 | |
| Second generation | 33 (28.2%) | 13 | 12 | 8 | |
| Third generation | 61 (52.1%) | 16 | 31 | 14 | |
| Tissue origin | 0.521 | ||||
| Lung | 76 (65.0%) | 23 | 37 | 16 | |
| Lymph node | 20 (17.0%) | 10 | 5 | 5 | |
| Pleural fluid | 7 (6.0%) | 2 | 4 | 1 | |
| Bone metastasis | 6 (5.1%) | 2 | 3 | 1 | |
| Brain metastasis | 3 (2.6%) | 1 | 1 | 1 | |
| Liver metastasis | 2 (1.7%) | 0 | 0 | 2 | |
| NA | 3 (2.6%) | 1 | 1 | 1 | |
Note: The sum of individual numbers may not be 100% due to rounding.
Abbreviations: ECOG PS, Eastern Cooperative Oncology Group performance status; EGFR‐TKIs, epidermal growth factor receptor tyrosine kinase inhibitors; NA, not available; PD‐L1, programmed death‐ligand 1; PI3KCA, phosphatidylinositol‐4,5‐bisphosphate 3‐kinase catalytic subunit alpha; SD, standard deviation; TP53, tumor protein 53.
Uncommon mutations including G719X (G719A, G719C, G719S), L861Q, S768I, E709K and K714E.
First generation EGFR‐TKI includes gefitinib, erlotinib, icotinib; second generation includes afatinib and dacomitinib; third generation includes osimertinib, almonertinib and furmonertinib.
p < 0.05.
FIGURE 2.
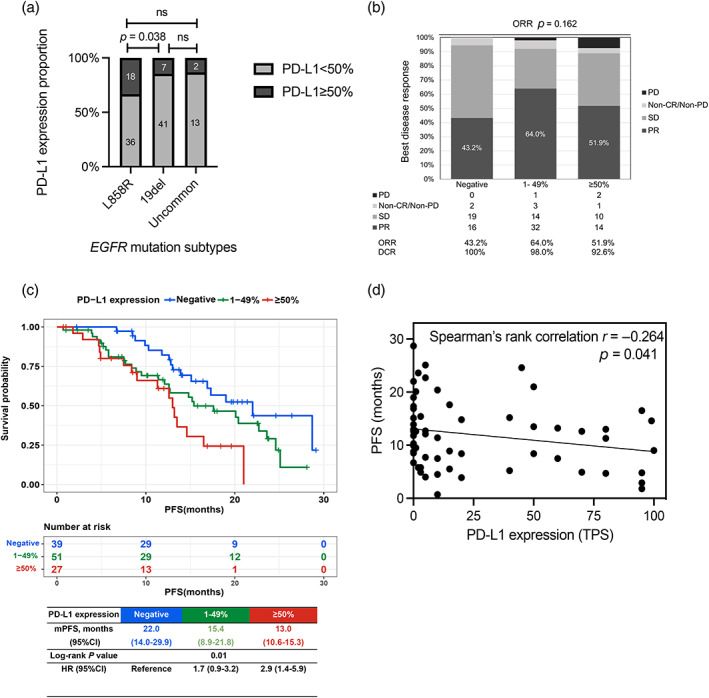
(a) Proportion of PD‐L1 ≥ 50% in different epidermal growth factor receptor (EGFR) mutation subtypes. (b) Overall response rate (ORR) and disease control rate (DCR) of EGFR‐tyrosine kinase inhibitors (TKIs) in different PD‐L1 expression groups. (c) Kaplan–Meier curves of progression‐free survival (PFS) of EGFR‐TKIs stratified by different PD‐L1 expression groups. (d) Correlation analysis of PD‐L1 TPS and PFS of EGFR‐TKIs.
Correlation between PD‐L1 expression level and efficacy of EGFR‐TKIs
A total of 114 patients were available for efficacy evaluation. The overall response rate (ORR) of the whole cohort was 54.4% (62/114), and the disease control rate (DCR) was 97.4% (111/114). Specifically, the ORR was 43.2, 64.0 and 51.9%, and DCR was 100, 98.0 and 92.6%, respectively in the PD‐L1 negative, 1%–49% and ≥50% groups (Figure 2b). There was no significant difference regarding the ORR and DCR in the three groups (ORR, p = 0.162; DCR p = 0.171), although the DCR declined numerically as PD‐L1 expression rose. In order to exclude the possible influence of previous EGFR‐TKIs use on the expression of PD‐L1, the subgroup consisting of treatment‐naïve patients (n = 107) was analyzed. Similarly, in the treatment‐naïve subgroup, the ORR and DCR in the three PD‐L1 expression groups were not significantly different (ORR, p = 0.222; DCR, p = 0.494), and a numerically downward trend of DCR was again observed as PD‐L1 expression increased in this subgroup (Figure S1).
Correlation between PD‐L1 expression level and PFS
The Kaplan–Meier survival curves of three different PD‐L1 levels are illustrated in Figure 2c. The median PFS (mPFS) was 22.0 months (95% CI: 14.0–29.9 months), 15.4 months (95% CI: 8.9–21.8 months) and 13.0 months (95% CI: 10.6–15.3 months) in PD‐L1 negative, 1%–49% and ≥50% groups, respectively (p = 0.01). The hazard ratio (HR) was 2.9 (95% CI: 1.4–5.9, p = 0.003) for PD‐L1 ≥50% versus PD‐L1 negative and 1.7 (95% CI: 0.9–3.2, p = 0.084) for PD‐L1 1–49% versus PD‐L1 negative. In addition, the correlation between PD‐L1 expression level and PFS was explored in the treatment‐naïve subgroup. The result of this subgroup was consistent with the whole cohort (Figure S2). Considering the differences in survival outcome in the L858R and the 19del subgroups, we conducted survival analysis stratified by PD‐L1 expression level (cutoff value 50%) in the two subgroups, respectively. In the L858R subgroup, patients with PD‐L1 ≥ 50% showed significantly worse PFS than PD‐L1 < 50% (mPFS <50% vs. ≥50%: 15.1 vs. 12.6 months, p = 0.045). However, in the 19del subgroup, the analysis was not feasible because of the small sample size in the PD‐L1 ≥ 50% population (7/48). In summary, patients harboring 19del with PD‐L1 < 50% showed the best PFS, followed by 21L858R with PD‐L1 < 50% and 21L858R with PD‐L1 ≥ 50% (mPFS 20.4 vs. 15.1 vs. 12.6 months for 19del <50%, L858R < 50% and L858R ≥ 50%, respectively, p = 0.006, mPFS of 19del ≥ 50% was incalculable) (Figure S3). Furthermore, whether a bisection method of PD‐L1 level could also distinguish cohorts with distinct survival was also tested. By using a cutoff of 1, 5, 10, 25 and 50%, we found that the groups with relatively higher PD‐L1 levels coincidentally showed worse PFS compared to their counterparts (Table S1). We further analyzed the correlation between specific PD‐L1 TPS and PFS using Spearman's rank correlation analysis and found that PFS was negatively correlated with PD‐L1 TPS (r = −0.264, p = 0.041) (Figure 2d).
PD‐L1 expression‐related survival stratified by EGFR comutations
Coexisting mutation status was determined in 111 patients and specific comutations are illustrated in Figure 3. TP53 was the most common comutation, identified in 79 (67.5%) patients, followed by PIK3CA in 13 (11.1%) patients, and the mutation frequency of TP53 and PIK3CA was similar among different PD‐L1 levels (p = 0.614 and p = 0.764, respectively) (Table 1). Patients with mutant TP53 (TP53m) showed shorter mPFS than those with wild‐type TP53 (TP53w) (TP53w vs. TP53m: 22.7 vs. 15.1 months, HR = 1.9, 95% CI: 1.03–3.49, p = 0.039) (Figure 4a). We further analyzed the PFS of different TP53 status, respectively. In the TP53m group, the survival pattern by different PD‐L1 levels resembled the pattern of the whole cohort: the mPFS was 22.0 months (95% CI: 12.9–31.0 months), 15.2 months (95% CI: 8.2–22.1 months) and 11.3 months (95% CI: 6.0–16.5 months) in PD‐L1 negative, 1%–49% and ≥50% groups, respectively (p = 0.012) (Figure 4c). However, such a pattern was not seen in the TP53w cohort (p = 0.518) (Figure 4d).
FIGURE 3.

Heatmap of epidermal growth factor receptor (EGFR) comutations of each patient and corresponding EGFR subtypes and PD‐L1 expression levels.
FIGURE 4.

Kaplan–Meier curves of progression‐free survival (PFS) of (a) patients with different TP53 mutation status, (b) patients stratified by a combination of TP53 mutation status and PD‐L1 positivity, (c) patients with mutant TP53 stratified by different PD‐L1 expression levels, and (d) patients with wild‐type TP53 stratified by different PD‐L1 expression levels. TP53m, mutant TP53. TP53w, wild‐type TP53.
We further investigated the combined effect of TP53 mutation status and PD‐L1 positivity (using 1% as the cutoff value) on the PFS of EGFR‐TKIs and found that the cohort was divided into three subgroups with distinct PFS: the TP53w PD‐L1 negative subgroup (Double−) showed the longest mPFS (NR); the TP53m PD‐L1 positive subgroup (Double+) had the shortest mPFS (13.0 months) and the subgroup with either TP53m or PD‐L1 positive (Single+) was in between (22.0 months) (HR: Single+ vs. Double−: 2.1; Double+ vs Double−: 4.5, p = 0.006) (Figure 4b). Other comutations were not suitable for further analysis because of their low frequency.
Univariate and multivariate Cox regression analyses
To identify the risk factors related to survival, a Cox proportional hazard model was built. Factors including age, sex, smoking history, ECOG PS, disease stage, brain metastases, number of distant metastatic organs, PD‐L1 level, EGFR subgroup, EGFR‐TKIs generation, application line, TP53 comutation and PIK3CA comutation were analyzed for their influence on PFS. In multivariate Cox regression, ECOG PS (HR 6.8, p = 0.000), TP53 mutation (HR 2.0, p = 0.044), EGFR‐TKIs generation (third vs. first: HR 0.32, p = 0.001; second vs. first: HR 0.65, p = 0.278) and PD‐L1 expression level (≥50% vs. negative: HR 3.76, p = 0.001; 1–49% vs. negative: HR 2.55, p = 0.014) were independent risk factors for PFS (Table 2).
TABLE 2.
Univariate and multivariate Cox regression analysis.
| Univariate Cox regression | Multivariate Cox regression | |||||||
|---|---|---|---|---|---|---|---|---|
| p‐value | HR | 95% CI | p‐value | HR | 95% CI | |||
| lower bound | Upper bound | lower bound | Upper bound | |||||
| Age | ||||||||
| <65 | Reference | |||||||
| ≥65 | 0.349 | 0.78 | 0.46 | 1.32 | ||||
| Sex | ||||||||
| Male | Reference | |||||||
| Female | 0.311 | 0.77 | 0.46 | 1.28 | ||||
| Smoking history | ||||||||
| No | Reference | |||||||
| Yes | 0.195 | 1.41 | 0.84 | 2.39 | ||||
| ECOG PS | ||||||||
| 0–1 | Reference | Reference | ||||||
| ≥2 | 0.001 | 4.91 | 1.90 | 12.70 | 0.000 | 6.83 | 2.45 | 19.03 |
| Stage | ||||||||
| IV | Reference | |||||||
| III | 0.976 | 0.00 | 0.00 | NC | ||||
| Recurrence | 0.464 | 1.37 | 0.59 | 3.20 | ||||
| Brain metastasis | ||||||||
| No | Reference | |||||||
| Yes | 0.512 | 0.83 | 0.48 | 1.44 | ||||
| Number of distant metastatic organs | ||||||||
| <3 | Reference | Reference | ||||||
| ≥3 | 0.065 | 1.69 | 0.97 | 2.95 | 0.115 | 1.64 | 0.89 | 3.02 |
| EGFR‐TKIs generation a | ||||||||
| First generation | Reference | Reference | ||||||
| Second generation | 0.042 | 0.47 | 0.23 | 0.97 | 0.278 | 0.65 | 0.29 | 1.42 |
| Third generation | 0.009 | 0.42 | 0.22 | 0.81 | 0.001 | 0.32 | 0.16 | 0.63 |
| EGFR subtype | ||||||||
| L858R | Reference | |||||||
| 19del | 0.039 | 0.55 | 0.31 | 0.97 | ||||
| Uncommon b | 0.501 | 0.76 | 0.35 | 1.67 | ||||
| Application line | ||||||||
| 1 | Reference | |||||||
| 2 | 0.082 | 2.12 | 0.91 | 4.96 | ||||
| ≥3 | 0.163 | 0.24 | 0.03 | 1.79 | ||||
| TP53 | ||||||||
| No | Reference | Reference | ||||||
| Yes | 0.04 | 1.90 | 1.03 | 3.49 | 0.044 | 2.04 | 1.02 | 4.10 |
| PIK3CA | ||||||||
| No | Reference | |||||||
| Yes | 0.444 | 0.73 | 0.33 | 1.63 | ||||
| PD‐L1 expression level | ||||||||
| Negative | Reference | Reference | ||||||
| 1%–49% | 0.084 | 1.74 | 0.93 | 3.27 | 0.014 | 2.55 | 1.21 | 5.38 |
| ≥50% | 0.003 | 2.92 | 1.42 | 5.98 | 0.001 | 3.76 | 1.73 | 8.18 |
Abbreviations: ECOG PS, Eastern Cooperative Oncology Group performance status; EGFR‐TKIs, epidermal growth factor receptor tyrosine kinase inhibitors; NA, not available; NC, not calculable; PD‐L1, programmed death‐ligand 1; PI3KCA, phosphatidylinositol‐4,5‐bisphosphate 3‐kinase catalytic subunit alpha; SD, standard deviation; TP53, tumor protein 53.
First generation EGFR‐TKI includes gefitinib, erlotinib, icotinib; second generation includes afatinib and dacomitinib; third generation includes osimertinib, almonertinib and furmonertinib.
Uncommon mutations including G719X (G719A, G719C, G719S), L861Q, S768I, E709K and K714E.
DISCUSSION
In this cohort of 117 EGFRm patients treated with EGFR‐TKIs, the expression of PD‐L1 and the clinicopathological features and efficacy of EGFR‐TKIs were retrospectively analyzed. The results showed that patients with high PD‐L1 expression level (especially PD‐L1 ≥ 50%) had shorter PFS and the PD‐L1 TPS was negatively correlated with the PFS of EGFR‐TKIs. In multivariate Cox regression, the PD‐L1 expression was one of the independent risk factors for PFS of EGFR‐TKIs. Although in our study, the ORR was not associated with PD‐L1 expression, the DCR had a downward trajectory as PD‐L1 expression increased.
Studies regarding the prognostic or predictive value of PD‐L1 expression in NSCLC can be divided into different types according to the scope of the target population, including those focusing on the whole NSCLC population, 16 , 17 , 18 or EGFRm population, 19 , 20 , 21 , 22 or EGFRm population treated with EGFR‐TKIs 12 , 13 , 14 , 15 , 23 , 24 , 25 , 26 , 27 , 28 , 29 , 30 , 31 , 32 , 33 , 34 as in the current study. In addition, there have also been studies which have investigated the value of PD‐L1 expression on mRNA level. 35 The majority of these studies have concluded that higher PD‐L1 expression is associated with shorter survival time in EGFRm patients or quicker development of EGFR‐TKI resistance. The underlying mechanism is yet to be clarified. A preclinical study summarized that PD‐L1 expression could be upregulated through three classic resistant mechanisms of EGFR‐TKIs: T790M, c‐MET amplification and hepatocyte growth factor (HGF). Pathways including MAKP, PI3K and NF‐kappa B were involved in the aforementioned three mechanisms at various levels and induced PD‐L1 overexpression. 36 In this regard, the EGFRm subgroup with high PD‐L1 expression, especially in treatment‐naïve patients, represented a predisposed EGFR‐TKI resistant phenotype and finally caused unsatisfactory drug benefits. However, studies with distinct conclusions also exist. 15 The inconsistency may come from the heterogeneity of sample size, ethnicity, sample origin, PD‐L1 testing methods, the definition of positivity and the generation and application line of EGFR‐TKIs. Thus, we suggest that stratified analysis based on the PD‐L1 expression level should be preplanned in future prospective trials aiming to evaluate the clinical efficacy of EGFR‐TKIs.
Correlation analysis revealed that EGFRm lung cancer was more likely to have negative rather than high PD‐L1 expression compared to EGFRw lung cancer, 4 , 5 , 37 which made the EGFRm patients who harbored high PD‐L1 expression a prominent subgroup to arouse special interest. In our study, we found that patients with L858R were more likely to have high PD‐L1 expression (33.9%) than 19del (10.8%) and other EGFR subtypes (13.3%) (p = 0.003). This has not previously been reported in other studies. Previous studies on tumor microenvironment analysis found that L858R showed a more inflamed immune profile (characterized by more activated tumor infiltration T cells and higher CD4 and CD8 expression on T cells) than 19del, 5 and high PD‐L1 expression and CD8+ immune profile have been found to be related to poor PFS and OS in EGFRm NSCLC in previous studies as well as in the current study. 37 , 38 This result may add to the mechanisms explaining why compared to 19del, L858R showed relatively worse PFS and OS with EGFR‐TKIs but better performance with immunotherapy. 1 , 39 , 40 , 41
Concurrent genomic alteration plays an important role in EGFRm NSCLC. In the current study, the most common concurrent mutation was TP53. As a well‐known tumor suppressor gene, TP53 mutation has been widely observed in various cancer types, causing the dysfunction of transcription factor p53 and a series of biological function disorders. 42 Previous studies have revealed that EGFRm patients harboring coexisting TP53 mutation had significantly shorter survival time and quicker development of drug resistance than those with TP53w, 43 , 44 , 45 which was verified in our study by showing a 7.6‐months shorter PFS in the TP53m subgroup than the TP53w subgroup. When stratifying the cohort according to the TP53 mutation status, the predictive effect of PD‐L1 expression on PFS of EGFR‐TKIs was only identified in the TP53m subgroup but not in the TP53w subgroup. To the best of our knowledge, we have taken the lead in reporting the difference in the ability of PD‐L1 to predict the PFS of EGFR‐TKIs in the TP53m and TP53w subgroup, leading to further queries regarding how the relationship and mutual interaction of p53 and PD‐L1 pathways make an impact on the efficacy of EGFR‐TKIs. Our further analysis of the combined predictive effect of TP53 mutation and PD‐L1 expression on treatment efficacy of EGFR‐TKIs provides preliminary evidence for the stratified treatment according to the TP53 and PD‐L1 defined stratification strategy, suggesting that the “Double+” group probably needs intensive treatment including targeted therapy in combination with antiangiogenetic therapy or chemotherapy at present. With the underlying mechanism of the effect of TP53 and PD‐L1 on efficacy of EGFR‐TKIs elucidated, more novel treatment methods would be expected.
Our study had some limitations. First, the retrospective nature of the study restricted the further investigation of the mechanism of PD‐L1 in affecting the efficacy of EGFR‐TKIs. Second, the mutation types and sites of TP53 were not available for further investigation. Third, although PD‐L1 expression evaluation was based on the Daco 22C3 test platform, the evaluation was done by pathologists from different testing organizations, which may have introduced heterogeneity in the final pooled analysis. Fourth, the overall survival data were not mature enough to enable further analysis and the limited sample size impeded the further analysis of several interesting subgroups.
In conclusion, the efficacy of EGFR‐TKIs was influenced by the PD‐L1 expression of tumor before TKI application. Specifically, higher PD‐L1 expression resulted in shorter PFS of EGFR‐TKIs. The combination of TP53 mutation status with PD‐L1 expression stratified patients into subgroups of divergent outcomes. However, the predictive effect of PD‐L1 on the efficacy of EGFR‐TKI treatment was not observed in the TP53w subgroup.
AUTHOR CONTRIBUTIONS
Conception and design: Si‐Yu Lei, Hai‐Yan Xu, Yan Wang. Administrative support: Hai‐Yan Xu, Jun‐Ling Li, Zhi‐Jie Wang, Pu‐Yuan Xing, Xue‐Zhi Hao, Yan Wang. Provision of study materials or patients: Hai‐Yan Xu, Jun‐Ling Li, Zhi‐Jie Wang, Pu‐Yuan Xing, Xue‐Zhi Hao, Yan Wang. Collection and assembly of data: Si‐Yu Lei, Hai‐Yan Xu. Data analysis and interpretation: All authors. Manuscript writing: All authors. Final approval of manuscript: All authors.
CONFLICT OF INTEREST STATEMENT
All authors have completed the ICMJE uniform disclosure form. The authors have no conflicts of interest to declare.
Supporting information
Figure S1. ORR and DCR of EGFR‐TKIs in treatment‐naïve patients stratified by different PD‐L1 expression levels.
Figure S2. Kaplan–Meier curves of PFS of EGFR‐TKIs stratified by different PD‐L1 expression groups in treatment‐naïve patients.
Figure S3. Kaplan–Meier curves of PFS of EGFR‐TKIs in L858R and 19del subgroups stratified by PD‐L1 expression groups using a cutoff value of 50%.
Table S1. PFS of PD‐L1 subgroups with different cutoff values.
Table S2. Cox survival analysis for PFS with different PD‐L1 cutoff values in TP53m and TP53w subgroups.
Lei S‐Y, Xu H‐Y, Li H‐S, Yang Y‐N, Xu F, Li J‐L, et al. Influence of PD‐L1 expression on the efficacy of EGFR‐TKIs in EGFR ‐mutant non‐small cell lung cancer. Thorac Cancer. 2023;14(24):2327–2337. 10.1111/1759-7714.15021
DATA AVAILABILITY STATEMENT
The clinical data would be shared with researchers who are interested in the current paper by email request to the corresponding author after publication. The data should be used only for scientific research.
REFERENCES
- 1. Soria J‐C, Ohe Y, Vansteenkiste J, Reungwetwattana T, Chewaskulyong B, Lee KH, et al. Osimertinib in untreated EGFR‐mutated advanced non–small‐cell lung cancer. N Engl J Med. 2018;378(2):113–25. [DOI] [PubMed] [Google Scholar]
- 2. Rodríguez‐Abreu D, Powell SF, Hochmair MJ, Gadgeel S, Esteban E, Felip E, et al. Pemetrexed plus platinum with or without pembrolizumab in patients with previously untreated metastatic nonsquamous NSCLC: protocol‐specified final analysis from KEYNOTE‐189. Ann Oncol. 2021;32(7):881–95. [DOI] [PubMed] [Google Scholar]
- 3. Qiao M, Jiang T, Liu X, Mao S, Zhou F, Li X, et al. Immune checkpoint inhibitors in EGFR‐mutated NSCLC: dusk or Dawn? J Thorac Oncol. 2021;16(8):1267–88. [DOI] [PubMed] [Google Scholar]
- 4. Schoenfeld AJ, Rizvi H, Bandlamudi C, Sauter JL, Travis WD, Rekhtman N, et al. Clinical and molecular correlates of PD‐L1 expression in patients with lung adenocarcinomas. Ann Oncol. 2020;31(5):599–608. [DOI] [PMC free article] [PubMed] [Google Scholar]
- 5. Toki MI, Mani N, Smithy JW, Liu Y, Altan M, Wasserman B, et al. Immune marker profiling and programmed death ligand 1 expression across NSCLC mutations. J Thorac Oncol. 2018;13(12):1884–96. [DOI] [PMC free article] [PubMed] [Google Scholar]
- 6. Dong ZY, Zhang JT, Liu SY, Su J, Zhang C, Xie Z, et al. EGFR mutation correlates with uninflamed phenotype and weak immunogenicity, causing impaired response to PD‐1 blockade in non‐small cell lung cancer. OncoImmunology. 2017;6(11):e1356145. [DOI] [PMC free article] [PubMed] [Google Scholar]
- 7. Sugiyama E, Togashi Y, Takeuchi Y, Shinya S, Tada Y, Kataoka K, et al. Blockade of EGFR improves responsiveness to PD‐1 blockade in EGFR‐mutated non‐small cell lung cancer. Sci Immunol. 2020;5:31. [DOI] [PubMed] [Google Scholar]
- 8. Li J, Chen Y, Shi X, le X, Feng F, Chen J, et al. A systematic and genome‐wide correlation meta‐analysis of PD‐L1 expression and targetable NSCLC driver genes. J Thorac Dis. 2017;9(8):2560–71. [DOI] [PMC free article] [PubMed] [Google Scholar]
- 9. Akbay EA, Koyama S, Carretero J, Altabef A, Tchaicha JH, Christensen CL, et al. Activation of the PD‐1 pathway contributes to immune escape in EGFR‐driven lung tumors. Cancer Discov. 2013;3(12):1355–63. [DOI] [PMC free article] [PubMed] [Google Scholar]
- 10. Bellucci R, Martin A, Bommarito D, Wang K, Hansen SH, Freeman GJ, et al. Interferon‐γ‐induced activation of JAK1 and JAK2 suppresses tumor cell susceptibility to NK cells through upregulation of PD‐L1 expression. OncoImmunology. 2015;4(6):e1008824. [DOI] [PMC free article] [PubMed] [Google Scholar]
- 11. Lan B, Wang Y, Wu J, Wang K, Wang P. The predictive and prognostic effects of PD‐L1 expression on TKI treatment and survival of EGFR‐mutant NSCLC: a meta‐analysis. Med. 2021;100(34):E27038. [DOI] [PMC free article] [PubMed] [Google Scholar]
- 12. Liu J, Itchins M, Nagrial A, Cooper WA, de Silva M, Barnet M, et al. Relationship between PD‐L1 expression and outcome in EGFR‐mutant lung cancer patients treated with EGFR tyrosine kinase inhibitors. Lung Cancer. 2021;155:28–33. [DOI] [PubMed] [Google Scholar]
- 13. Kang M, Park C, Kim SH, Yoon SW, Suh KJ, Kim YJ, et al. Programmed death‐ligand 1 expression level as a predictor of EGFR tyrosine kinase inhibitor efficacy in lung adenocarcinoma. Transl Lung Cancer Res. 2021;10(2):699–711. [DOI] [PMC free article] [PubMed] [Google Scholar]
- 14. Chang CY, Lai YC, Wei YF, Chen CY, Chang SC. PD‐L1 expression and outcome in patients with metastatic non‐small cell lung cancer and EGFR mutations receiving EGFR‐TKI as frontline treatment. Onco Targets Ther. 2021;14:2301–9. [DOI] [PMC free article] [PubMed] [Google Scholar]
- 15. Dissing JG, Ulhøi MP, Sorensen BS, Meldgaard P. Tumoral PD‐L1 does not impact time to treatment discontinuation in EGFR mutated non‐small cell lung cancer patients treated with EGFR tyrosine kinase inhibitor‐a Danish cohort study. Transl Lung Cancer Res. 2022;11(9):1796–808. [DOI] [PMC free article] [PubMed] [Google Scholar]
- 16. Pan ZK, Ye F, Wu X, An HX, Wu JX. Clinicopathological and prognostic significance of programmed cell death ligand1 (PD‐L1) expression in patients with non‐small cell lung cancer: a meta‐analysis. J Thorac Dis. 2015;7(3):462–70. [DOI] [PMC free article] [PubMed] [Google Scholar]
- 17. Zhou ZJ, Zhan P, Song Y. PD‐L1 over‐expression and survival in patients with non‐small cell lung cancer: a meta‐analysis. Transl Lung Cancer Res. 2015;4(2):203–8. [DOI] [PMC free article] [PubMed] [Google Scholar]
- 18. Mori S, Motoi N, Ninomiya H, Matsuura Y, Nakao M, Mun M, et al. High expression of programmed cell death 1 ligand 1 in lung adenocarcinoma is a poor prognostic factor particularly in smokers and wild‐type epidermal growth‐factor receptor cases. Pathol Int. 2017;67(1):37–44. [DOI] [PubMed] [Google Scholar]
- 19. Lin C, Chen X, Li M, Liu J, Qi X, Yang W, et al. Programmed death‐ligand 1 expression predicts tyrosine kinase inhibitor response and better prognosis in a cohort of patients with epidermal growth factor receptor mutation‐positive lung adenocarcinoma. Clin Lung Cancer. 2015;16(5):e25–35. [DOI] [PubMed] [Google Scholar]
- 20. Cho JH, Zhou W, La CY, et al. Retrospective molecular epidemiology study of PD‐L1 expression in patients with EGFR‐mutant non‐small cell lung cancer. Cancer Res Treat. 2018;50(1):95–102. [DOI] [PMC free article] [PubMed] [Google Scholar]
- 21. Saw SPL, Ng WP, Zhou S, Lai GGY, Tan AC, Ang MK, et al. PD‐L1 score as a prognostic biomarker in asian early‐stage epidermal growth factor receptor‐mutated lung cancer. Eur J Cancer. 2023;178:139–49. [DOI] [PubMed] [Google Scholar]
- 22. Peng Z, Lin H, Zhou K, Deng S, Mei J. Predictive value of pretreatment PD‐L1 expression in EGFR‐mutant non‐small cell lung cancer: a meta‐analysis. World J Surg Oncol. 2021;19(1):145. [DOI] [PMC free article] [PubMed] [Google Scholar]
- 23. Tang Y, Fang W, Zhang Y, Hong S, Kang S, Yan Y, et al. The association between PD‐L1 and EGFR status and the prognostic value of PD‐L1 in advanced non‐small cell lung cancer patients treated with EGFR‐TKIs. Oncotarget. 2015;6(16):14209–19. [DOI] [PMC free article] [PubMed] [Google Scholar]
- 24. Kim T‐J, Auck Hong S, Kim O, et al. Changes in PD‐L1 expression according to tumor infiltrating lymphocytes of acquired EGFR‐TKI resistant EGFR‐mutant non‐small‐cell lung cancer. Oncotarget. 2017;8:107630–9. [DOI] [PMC free article] [PubMed] [Google Scholar]
- 25. Hsu KH, Huang YH, Sen TJ, et al. High PD‐L1 expression correlates with primary resistance to EGFR‐TKIs in treatment naïve advanced EGFR‐mutant lung adenocarcinoma patients. Lung Cancer. 2019;127:37–43. [DOI] [PubMed] [Google Scholar]
- 26. Kobayashi K, Zou F, Noro R, et al. Prognostic significance of NSCLC and response to EGFR‐TKIs of EGFR‐mutated NSCLC based on PD‐L1 expression. Anticancer Res. 2018;38(2):753–62. [DOI] [PubMed] [Google Scholar]
- 27. D'Incecco A, Andreozzi M, Ludovini V, Rossi E, Capodanno A, Landi L, et al. PD‐1 and PD‐L1 expression in molecularly selected non‐small‐cell lung cancer patients. Br J Cancer. 2015;112(1):95–102. [DOI] [PMC free article] [PubMed] [Google Scholar]
- 28. Yoon BW, Chang B, Lee SH. High pd‐l1 expression is associated with unfavorable clinical outcome in egfr‐mutated lung adenocarcinomas treated with targeted therapy. Onco Targets Ther. 2020;13:8273–85. [DOI] [PMC free article] [PubMed] [Google Scholar]
- 29. Yoneshima Y, Ijichi K, Anai S, Ota K, Otsubo K, Iwama E, et al. PD‐L1 expression in lung adenocarcinoma harboring EGFR mutations or ALK rearrangements. Lung Cancer. 2018;118:36–40. [DOI] [PubMed] [Google Scholar]
- 30. Soo RA, Kim HR, Asuncion BR, Fazreen Z, Omar MFM, Herrera MC, et al. Significance of immune checkpoint proteins in EGFR‐mutant non‐small cell lung cancer. Lung Cancer. 2017;105:17–22. [DOI] [PubMed] [Google Scholar]
- 31. Kim T, Cha YJ, Chang YS. Correlation of PD‐L1 expression tested by 22C3 and SP263 in non‐small cell lung cancer and its prognostic effect on EGFR mutation‐positive lung adenocarcinoma. Tuberc Respir Dis. 2020;83(1):51–60. [DOI] [PMC free article] [PubMed] [Google Scholar]
- 32. Yang CY, Liao WY, Ho CC, Chen KY, Tsai TH, Hsu CL, et al. Association between programmed death‐ligand 1 expression, immune microenvironments, and clinical outcomes in epidermal growth factor receptor mutant lung adenocarcinoma patients treated with tyrosine kinase inhibitors. Eur J Cancer. 2020;124:110–22. [DOI] [PubMed] [Google Scholar]
- 33. Inomata M, Matsumoto M, Mizushima I, et al. Association of tumor PD‐L1 expression with time on treatment using EGFR‐TKIs in patients with EGFR‐mutant non‐small cell lung cancer. CDP. 2022;2(3):324–9. [DOI] [PMC free article] [PubMed] [Google Scholar]
- 34. Su S, Dong ZY, Xie Z, Yan LX, Li YF, Su J, et al. Strong programmed death ligand 1 expression predicts poor response and De novo resistance to EGFR tyrosine kinase inhibitors among NSCLC patients with EGFR mutation. J Thorac Oncol. 2018;13(11):1668–75. [DOI] [PubMed] [Google Scholar]
- 35. Chang CH, Shih ACC, Chang YH, Chen H, Chao YT, Hsu YC. The prognostic significance of PD1 and PDL1 gene expression in lung cancer: a meta‐analysis. Front Oncologia. 2021;11:11. [DOI] [PMC free article] [PubMed] [Google Scholar]
- 36. Peng S, Wang R, Zhang X, Ma Y, Zhong L, Li K, et al. EGFR‐TKI resistance promotes immune escape in lung cancer via increased PD‐L1 expression. Mol Cancer. 2019;18(1):165. [DOI] [PMC free article] [PubMed] [Google Scholar]
- 37. Liu SY, Yi DZ, Pei WS, et al. Clinical relevance of PD‐L1 expression and CD8+ T cells infiltration in patients with EGFR‐mutated and ALK‐rearranged lung cancer. Lung Cancer. 2018;125:86–92. [DOI] [PubMed] [Google Scholar]
- 38. Matsumoto Y, Sawa K, Fukui M, Oyanagi J, Izumi M, Ogawa K, et al. Impact of tumor microenvironment on the efficacy of epidermal growth factor receptor‐tyrosine kinase inhibitors in patients with EGFR‐mutant non‐small cell lung cancer. Cancer Sci. 2019;110(10):3244–54. [DOI] [PMC free article] [PubMed] [Google Scholar]
- 39. Fukuoka M, Wu YL, Thongprasert S, Sunpaweravong P, Leong SS, Sriuranpong V, et al. Biomarker analyses and final overall survival results from a phase III, randomized, open‐label, first‐line study of gefitinib versus carboplatin/paclitaxel in clinically selected patients with advanced non‐small‐cell lung cancer in Asia (IPASS). J Clin Oncol. 2011;29:2866–74. [DOI] [PubMed] [Google Scholar]
- 40. Yang JCH, Wu YL, Schuler M, Sebastian M, Popat S, Yamamoto N, et al. Afatinib versus cisplatin‐based chemotherapy for EGFR mutation‐positive lung adenocarcinoma (LUX‐lung 3 and LUX‐lung 6): analysis of overall survival data from two randomised, phase 3 trials. Lancet Oncol. 2015;16(2):141–51. [DOI] [PubMed] [Google Scholar]
- 41. Mazieres J, Drilon A, Lusque A, Mhanna L, Cortot AB, Mezquita L, et al. Immune checkpoint inhibitors for patients with advanced lung cancer and oncogenic driver alterations: results from the IMMUNOTARGET registry. Ann Oncol. 2019;30(8):1321–8. [DOI] [PMC free article] [PubMed] [Google Scholar]
- 42. Wang H, Guo M, Wei H, Chen Y. Targeting p53 pathways: mechanisms, structures, and advances in therapy. Signal Transduct Target Ther. 2023;8(1):92. [DOI] [PMC free article] [PubMed] [Google Scholar]
- 43. Vokes NI, Chambers E, Nguyen T, Coolidge A, Lydon CA, le X, et al. Concurrent TP53 mutations facilitate resistance evolution in EGFR‐mutant lung adenocarcinoma. J Thorac Oncol. 2022;17(6):779–92. [DOI] [PMC free article] [PubMed] [Google Scholar]
- 44. Kim Y, Lee B, Shim JH, Lee SH, Park WY, Choi YL, et al. Concurrent genetic alterations predict the progression to target therapy in EGFR‐mutated advanced NSCLC. J Thorac Oncol. 2019;14(2):193–202. [DOI] [PubMed] [Google Scholar]
- 45. Canale M, Petracci E, Delmonte A, Bronte G, Chiadini E, Ludovini V, et al. Concomitant TP53 mutation confers worse prognosis in EGFR‐mutated non‐small cell lung cancer patients treated with TKIs. J Clin Med. 2020;9(4):1047. [DOI] [PMC free article] [PubMed] [Google Scholar]
Associated Data
This section collects any data citations, data availability statements, or supplementary materials included in this article.
Supplementary Materials
Figure S1. ORR and DCR of EGFR‐TKIs in treatment‐naïve patients stratified by different PD‐L1 expression levels.
Figure S2. Kaplan–Meier curves of PFS of EGFR‐TKIs stratified by different PD‐L1 expression groups in treatment‐naïve patients.
Figure S3. Kaplan–Meier curves of PFS of EGFR‐TKIs in L858R and 19del subgroups stratified by PD‐L1 expression groups using a cutoff value of 50%.
Table S1. PFS of PD‐L1 subgroups with different cutoff values.
Table S2. Cox survival analysis for PFS with different PD‐L1 cutoff values in TP53m and TP53w subgroups.
Data Availability Statement
The clinical data would be shared with researchers who are interested in the current paper by email request to the corresponding author after publication. The data should be used only for scientific research.