

Abstract
Background
Circular RNAs (circRNAs) are closely associated with the development of breast cancer (BC). In this study, we aimed to clarify how differentially expressed circRNAs affect the development of BC.
Methods
Quantitative real‐time polymerase chain reaction (qRT‐PCR) was used to detect the expression of circADAM9, miR‐1236‐3p and fibroblast growth factor 7 (FGF7). Colony formation, 5‐ethynyl‐2′‐deoxyuridine (EdU), wound healing, transwell, and flow cytometry were used to assess cell proliferation, migration, invasion, and apoptosis. Glucose consumption, lactic acid production and ATP levels were assessed using glycolysis metabolism analysis. Dual‐luciferase reporter assay and RNA immunoprecipitation (RIP) assay were carried out to verify the relationship between miR‐1236‐3p and circADAM9 or FGF7. The roles of cirADAM9 on tumor growth were analyzed using a xenograft tumor model. Ki‐67 and FGF7 expression was measured via immunohistochemistry (IHC) assay. Apoptosis‐related proteins and exosome markers were detected by western blot.
Results
CircADAM9 was highly expressed in BC cells, and circADAM9 silencing inhibited BC cell proliferation, migration, invasion, and glycolysis, and promoted cell apoptosis. Furthermore, miR‐1236‐3p inhibition could overturn circADAM9 knockdown‐mediated BC inhibition. Moreover, the negative influences of miR‐1236‐3p overexpression on BC progression were restrained via FGF7 overexpression. CircADAM9 silence also inhibited BC tumor growth in vivo.
Conclusion
CircADAM9 promoted BC development partly by the miR‐1236‐3p/FGF7 axis, highlighting a potential prognostic biomarker and therapeutic target for BC patients.
Keywords: breast cancer, circADAM9, FGF7, miR‐1236‐3p, People’s Hospital of Shenzhen Baoan District
CircADAM9 was remarkably increased in BC tumors and cell lines. Furthermore, circADAM9 overexpression might promote BC cell proliferation, metastasis, glycolysis, and hinder cell apoptosis partly by the miR‐1236‐3p/FGF7 axis.

INTRODUCTION
Breast cancer (BC) remains a major cause of suffering and premature mortality among women worldwide. 1 Radiation therapy and chemotherapy are common treatment methods at present, but the lack of targeted treatment means that the recurrence and survival rates of BC remain unsatisfactory. 2 , 3 Hence, it is vital to find new targeted methods for BC treatment.
Circular RNAs (CircRNAs) are typical non‐coding RNAs, which are very stable in cells due to their unique reverse shearing ring structure. 4 , 5 In addition, there is growing evidence that circRNAs play an important role in the processes regulating cancer cell viability, metastasis, and drug resistance. 6 , 7 , 8 , 9 It has become apparent that circRNAs are associated with the development of BC. 10 Hsa_circ_001783 regulated miR‐200C‐3p to promote BC development. 11 In one study, circ_0053063 inhibited the proliferation of BC via regulating PDCD4. 12 In another study, circADAM9 promoted cell autophagy in diabetic endothelial progenitors via targeting the miR‐20a‐5p/PTEN axis and ATG7. 13 However, the regulatory mechanism of circRNAs in BC is still unclear. We aimed to screen the specifically expressed circRNAs in BC to find new target sites for BC treatment.
In the circRNAs/miRNAs/mRNA axis, miRNAs also play an important role in regulatory processes. 14 MiRNAs are directly regulated by circRNAs, which affect the transcription of key mRNA downstream and the synthesis of key proteases. 15 It has been determined that miR‐507 can repress metastasis of human BC cells by regulating FLT‐1. 16 The has‐miR‐146A rs2910164 polymorphism in Europe led to an increased risk of BC associated with the CC genotype. 17 In another study, miRNA‐96‐5p promoted cell proliferation and played a tumor‐promoting role by negatively regulating the tumor suppressor gene FOXO3. 18 In addition, oncogenic miRNAs have been found in tear exosomes from patients with metastatic BC. 19
In this study, highly expressed circRNAs in BC were screened and analyzed, and their function was verified by a series of functional experiments. In addition, the mechanism of circRNAs in BC was determined. Exosomes were isolated from the cell microenvironment and validated for function.
METHODS
Clinical samples
Clinical BC tissue samples (n = 39) and normal tissues (n = 39) were collected from People's Hospital of Shenzhen Baoan District with written informed consent obtained from patients. Once the samples had been collected, they were frozen and stored at −80°C in a refrigerator for preparation. This study was approved by the Ethics Committee of People's Hospital of Shenzhen Baoan District.
Cell lines and cell culture
The BC cells (MDA‐MB‐468, SKBR3, BT549, MCF‐7, and MDA‐MB‐231) and normal human breast epithelial cell line (MCF‐10A) from ATCC (Manassas) were incubated in Dulbecco's modified Eagle medium (DMEM: Solarbio) containing 10% fetal bovine serum (FBS: Biosera) and 0.5% penicillin–streptomycin (Thermo Fisher Scientific) at 37°C in an incubator with 5% CO2.
Quantitative real‐time polymerase chain reaction (qRT‐PCR)
Total RNAs were collected from tissues or treated cells using Taraka RNAiso Plus, followed by reverse transcription using a reverse transcription system. Then, qRT‐PCR was executed with a one‐step Superscript qRT‐PCR kit (Invitrogen). Primers for qRT‐PCR are shown in Table 1. 2−ΔΔCt method was applied to analyze relative RNA expression, with the normalization to β‐actin and U6.
TABLE 1.
Primers sequences used for quantitative real‐time polymerase chain reaction (qRT‐PCR).
| Name | Primers for qRT‐PCR (5′‐3′) | |
|---|---|---|
| circADAM9 | Forward | GGTGATGTGCTGGGGAACTT |
| Reverse | CCCATCATGTCATAAGAACTAGCTG | |
| FGF7 | Forward | ACCAAGCTGCTGCTTTCAATG |
| Reverse | TTGGAAAGAGGCTAGGACTGT | |
| miR‐1236‐3p | Forward | GCCGAGCCTCTTCCCCTTGTC |
| Reverse | CTCAACTGGTGTCGTGGAG | |
| β‐actin | Forward | TGGATCAGCAAGCAGGAGTA |
| Reverse | TCGGCCACATTGTGAACTTT | |
| U6 | Forward | GCTTCGGCAGCACATATACTAA |
| Reverse | AACGCTTCACGAATTTGCGT | |
| ADAM9 | Forward | TGTGTCTCCTAGTAGCTTCCT |
| Reverse | CCATTGTGCACACTTTGGCA |
Subcellular fraction assay
A subcellular fraction assay was performed using the protocol of the PARIS kit (Thermo Fisher). After trypsin (Sigma–Aldrich) treatment, cells were washed twice with phosphate buffered saline (PBS). The cells were resuspended and incubated on ice for 8 min. After centrifugation, the cytoplasm was contained in the supernatant and the nucleus was located in the pellet. Finally, RNA extraction and qRT‐PCR were performed on cytoplasmic and nuclear fractions to detect the expression of circADAM9 in each fraction, using β‐actin and U6 as the reference gene in the cytoplasm and nucleus.
RNase R and actinomycin D treatment
RNAs were abstracted using a commercial kit (Aidlab). Then, 3 μg RNA was isolated and incubated with RNase R (3 U/mg, IVDSHOW) for 24 h. The contents of circADAM9 and linear ADAM9 were quantified by qRT‐PCR. For actinomycin D treatment, 1 × 10⁵ MCF‐7 and MDA‐MB‐231 cells in a six‐well plate were exposed to 2 mg/mL actinomycin D (Sigma‐Aldrich) for 0, 4, 12, and 24 h. Then, the collected cells were subjected to RT‐qPCR analysis of circADAM9 and linear ADAM9.
Cell transfection
Recombinant plasmids including the small hairpin RNA against circADAM9 (sh‐circADAM9#1 and sh‐circADAM9#1), circADAM9 upregulation (circADAM9), the mimics/inhibitor of (miR‐1236‐3p/in‐miR‐1236‐3p), FGF7 overexpression (FGF7) and their negative controls: short hairpin (sh)‐NC, pCD5‐ciR, miR‐NC mimics (miR‐NC), miR‐NC inhibitor (in‐miR‐NC) and (pcDNA) were constructed by Jrdun Biotechnology Company. These recombinant plasmids were transferred into tumor cells using lipofectamine 3000 reagent (Invitrogen).
Colony formation assay
The treated cells were inoculated into 24‐well plates (Corning) at 2 × 10⁴ cells/well and cultured for 10 days. Then, the cells were washed with PBS, fixed with formalin, and stained with crystal violet (Beyotime). The colony numbers of each well were observed and counted under the microscope.
5‐ethynyl‐2′‐deoxyuridine (EdU) assay
The cells were loaded in 24‐well plates and cultivated at 37°C. The cells were incubated with EdU solution (50 μM) in each well, followed by fixture with 4% paraformaldehyde (PFA: Beyotime). The nuclei were stained with 4, 6‐diamidino‐2‐phenylindole dihydrochloride (DAPI), and three randomly selected fields were photographed and analyzed by fluorescence microscopy to measure EdU‐positive cells.
Wound healing assay
First, the plates were coated with Matrigel and after the Matrigel had solidified, the cells were spread on it. A scratch was created on the cell layer with pipette tips. After 36 h, the cell scratch was observed and photographed under a microscope (Leica).
Transwell assay
Cell migration and invasion were assessed using transwell chambers (BD Biosciences) with 8 μm pores inserts and transwell chambers with Matrigel (Bedford) precoated inserts, respectively. In brief, the treated cells in nonserum medium were inoculated into the upper chamber, while 10% FBC was added to the bottom counterpart. Then, 24 h later, the cells remaining on the bottom surface were fixed for 30 min with 600 μL 4% PFA and stained, followed by visualization under a microscope (Leica) and numbering with Image J software (NIH).
Cell apoptosis analysis
In short, tumor cells were cultured in 24‐well plates with FBS‐free medium for 12 h for starvation treatment. After washing and resuscitation, the cells were stained with annexin V‐FITC and PI (Solarbio) successively. After incubation for 15 min, the apoptosis of cells was monitored using flow cytometry.
Western blot assay
Total proteins obtained with a total protein extraction kit were isolated and quantified using a BCA protein assay kit (Beyotime). After being screened by 10% sodium dodecyl sulfate‐polyacrylamide gel electrophoresis (SDS‐PAGE), the proteins were transferred to polyvinylidene fluoride (PVDF) membranes and blocked in 5% nonfat milk. The PVDF membranes were incubated with primary antibodies overnight at 4°C and then incubated with secondary antibody (ab6721, 1:5000, Abcam). Immunoreactive proteins were observed using enhanced chemiluminescence (ECL) reagent (Millipore). The primary antibodies used for western blot from Abcam (UK) are shown in Table 2.
TABLE 2.
Primary antibody for western blot.
| Name | No. | Dilution |
|---|---|---|
| Anti‐Bcl‐2 | ab218123 | 1/5000 |
| Anti‐Bax | ab182733 | 1/2000 |
| Anti‐β actin | ab241153 | 1 μg/mL |
| Anti‐FGF‐7 | ab131162 | 0.1 μg/mL |
| Anti‐CD63 | ab134045 | 1/1000 |
| Anti‐CD9 | ab236630 | 1/1000 |
| Anti‐TSG101 | ab125011 | 1.0 μg/mL |
Glycolysis metabolism analysis
Glycolysis metabolic analysis included the detection of glucose consumption, lactic acid production, and ATP detection. In short, transfected cells were seeded into 96‐well plates with medium containing 10% FBS. Then, the supernatants of the medium were collected after 24 h and the glucose consumption, lactate production, and ATP levels in cells were measured using a glucose assay kit (ab65333, Abcam), L‐lactate assay kit (ab65331, Abcam), and ATP assay kit (Sigma‐Aldrich), respectively.
Dual‐luciferase reporter assay
The binding sites were analyzed using CircInteractome (https://circinteractome.nia.nih.gov/) and TargetScan (http://www.targetscan.org/vert_72/). Tumor cells were cotransfected with miR‐NC/miR‐1236‐3p mimics and circADAM9 wild‐type‐(WT)/mutant (MUT) or FGF7 3′UTR WT/MUT from Hanbio, followed by analysis using a dual reporter assay system (Promega).
RNA immunoprecipitation (RIP) assay
The cells were cleaved in RIP lysis buffer (Millipore) and the lysed mixture was incubated with bound magnetic beads containing anti‐AGO2 antibody or anti‐IgG. The RNAs were washed off the beads and purified, and then enrichment of circADAM9 and miR‐1236‐3p was analyzed using qRT‐PCR.
Xenograft model
To further determine the effect of circADAM9 on tumor growth in vivo, MDA‐MB‐231 cells (2 × 10⁶ cells) with sh‐NC and sh‐circADAM9#1 were subcutaneously injected into nude mice (Vital River Laboratory, Beijing, China, 5 mice in each group). The width and length of the tumor was measured every 7 days. After 28 days, the tumors removed from the euthanized mice were weighed. Assessment of circADAM9 and miR‐1236‐3p in tumors was implemented using qRT‐PCR. Western blot and immunohistochemistry (IHC) assay were used to detect MSI1 and Ki‐67 levels. Volume (mm3) = width2 × length/2. All animal testing procedures were performed according to the guidance of the Animal Care and Use Committee of the People's Hospital of Shenzhen Baoao District.
Immunohistochemistry (IHC) assay
Tumors removed from mice were blocked with 4% paraformaldehyde (PFA), embedded in paraffin, and sliced into 4 μm sections. After being dewaxed, tumor sections were incubated with primary antibodies (Anti‐FGF7, ab214178, 1:300; Anti‐Ki‐67 ab15580, 5 μg/mL) and secondary antibody overnight at 4°C. Slides were then incubated with 3, 3′‐diaminobenzidine (DAB), restrained with hematoxylin, and a microscope was used for examination.
Statistical analysis
All data were analyzed using SPSS version 24.0 (IBM) and GraphPad Prism 8.0, and expressed as mean ± standard deviation (SD). The significant differences between groups were assessed using a student's t‐test or one‐way analysis of variance (ANOVA) with a statistically significant level of p < 0.05.
RESULTS
CircADAM9 was markedly promoted in BC
The circADAM9 was remarkably increased in BC tumors compared to the normal group (Figure 1a). The BC sufferers at different stages were divided into two groups including I + II group (n = 17) and III group (n = 22), and the expression level of circADAM9 in III group was significantly improved versus the I + II group (Figure 1b). qRT‐PCR results showed that relative circADAM9 levels in MCF‐7 and MDA‐MB‐231 cells were notably enhanced versus other cell lines, thus MCF‐7 and MDA‐MB‐231 cell lines were chosen for the following study (Figure 1c). CircADAM9 was highly expressed in the cytoplasm, with β‐actin as the reference gene in the cytoplasm and U6 as the reference gene in the nucleus (Figure 1d,e). After RNase R treatment, the level of linear ADAM9 was distinctly decreased, while there had been little change in circADAM9 (Figure 1f,g), and the half‐life of circADAM9 transcript exceeded 24 h in the actinomycin D assay (Figure 1h,i), which indicated that circADAM9 was much more stable than linear ADAM9. Overall, circADAM9 was significantly overexpressed in BC.
FIGURE 1.

CircADAM9 was obviously elevated in breast cancer (BC) tissues and cells. (a–c) Quantitative real‐time polymerase chain reaction (qRT‐PCR) was employed to detect the level of circADAM9 detected in BC tumors (n = 39) and paracancerous tissues (n = 39) (a), in BC patients in I + II stage (n = 17) and III stage (n = 22) (b), in BC cell lines (MDA‐MB‐468, SKBR3, BT549, MCF‐7 and MDA‐MB‐231) and human normal breast epithelial cell line (MCF‐10A) (c). (d and e) The circADAM9 expression was measured by qRT‐PCR in the cytoplasm and nucleus of MCF‐7 and MDA‐MB‐231 cells, with β‐actin and U6 as reference genes. (f and g) The levels of circADAM9 and linear ADAM9 in MCF‐7 and MDA‐MB‐231 cells after RNase R treatment were quantified by qRT‐PCR. (h and i) The relative levels of circADAM9 and linear ADAM9 were analyzed by qRT‐PCR after treatment with actinomycin D for 0, 4, 8, 12, and 24 h. *p < 0.05.
Inhibition of circADAM9 suppressed the development of BC
In order to further explore the effect of circADAM9 on BC, we knocked down circADAM9 in MCF‐7 and MDA‐MB‐231 cells. The transfection of shRNAs targeting circADAM9 (circADAM9#1 and circADAM9#2) significantly inhibited the expression of circADAM9 in tumor cells (Figure 2a). Functional experiments showed when circADAM9 was downregulated, the relative colony formation rate of tumor cells was decreased versus the sh‐NC group (Figure 2b). EdU assay showed that cell proliferation was weakened by the knockdown of circADAM9 in si‐circADAM9 transfected cells (Figure 2c). The migration ability was notably suppressed under circADAM9 downregulation in the wound healing and transwell migration assays (Figure 2d,e). Transwell invasion assay indicated that the cell invasion ability was distinctly repressed after si‐circADAM9 was transfected into tumor cells (Figure 2f). The apoptosis rate of tumor cells was remarkably enhanced in the si‐circADAM9 group (Figure 2g). Furthermore, an apparent decrease in Bcl‐2 (apoptosis‐inhibiting protein) protein level and an increase in Bax (apoptosis‐promoting protein) protein level was detected in si‐circADAM9 transfected cells (Figure 2h,i). Apart from that, circADAM9 silencing might significantly reduce tumor cell glucose consumption, lactate production, and ATP level, suggesting circADAM9 absence inhibited tumor cell glycolysis (Figure 2j–l). Meanwhile, sh‐circADAM9#1 was selected for subsequent experiments due to its high efficiency of knockdown. In addition, our results indicated that the upregulation of circADAM9 might promote BC proliferation, migration, and invasion in vitro (Figure S1). Overall, the downregulation circADAM9 blocked BC cell malignant behaviors and glycolysis.
FIGURE 2.

CircADAM9 knockdown inhibited the progression of breast cancer (BC). MCF‐7 and MDA‐MB‐231 cells were transfected with sh‐NC, sh‐circADAM9#1 or sh‐circADAM9#2. (a) The level of circADAM9 was measured in MCF‐7 and MDA‐MB‐231 cells by quantitative real‐time polymerase chain reaction (qRT‐PCR). (b) Relative colony formation rate was detected by colony formation assay. (c) 5‐ethynyl‐2′‐deoxyuridine (EdU) assay was used to detect cell viability and proliferation. (d) Wound healing assay was employed to assess the migration ability of cells. (e and f) A transwell assay was used to measure the migration and invasion of cells. (g) Cell apoptosis rate was assessed by flow cytometry analysis. (h and i) The expression of apoptosis‐related proteins (Bcl‐2 and Bax) was detected using western blot. (j and k) The glucose consumption and lactate production were measured by glycolysis metabolism analysis. (l) The ATP level was quantified with ATP assay kit. *p < 0.05.
CircADAM9 served as a sponge for miR‐1236‐3p in BC
CircInteractome revealed the existence of target sites between circADAM9 and miR‐1236‐3p (Figure 3a). MiR‐1236‐3p expression was prominently elevated via the MiR‐1236‐3p expression was prominently elevated by miR‐1236‐3p overexpression, but evidently repressed by miR‐1236‐3p inhibitor (Figure 3b). Dual luciferase reporter assay revealed that the luciferase activity in the circADAM9 WT and miR‐1236‐3p group was drastically decreased compared with the circADAM9 WT and miR‐NC group (Figure 3c,d). In the RIP assay, circADAM9 and miR‐1236‐3p were enriched using Anti‐Ago2 antibody relative to Anti‐IgG and Input group (Figure 3e,f). In addition, the level of miR‐1236‐3p was prominently higher in tumor tissues and BC cell lines (MCF‐7 and MDA‐MB‐231) than in normal tissues and normal cell lines (MCF‐10A) (Figure 3g,h). Silencing of circADAM9 caused an increase in miR‐1236‐3p; however, this effect was reversed via miR‐1236‐3p inhibition (Figure 3i). Altogether, circADAM9 might interact with miR‐1236‐3p in BC.
FIGURE 3.
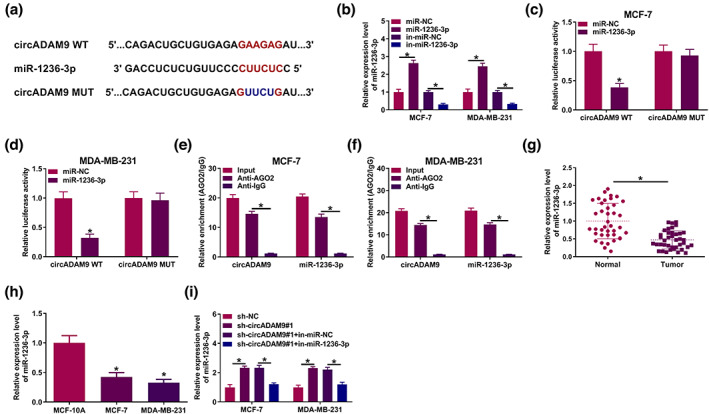
CircADAM9 acted as a sponge of miR‐1236‐3p. (a) The binding sites of miR‐1236‐3p in circADAM9 sequences were predicted by CircInteractome. (b) Quantitative real‐time polymerase chain reaction (qRT‐PCR) was employed to detect the level of miR‐1236‐3p in MCF‐7 and MDA‐MB‐231 cells. (c and d) Luciferase activity of MCF‐7 and MDA‐MB‐231 cells cotransfected with circADAM9 WT (circADAM9 MUT) and miR‐1236‐3p (miR‐NC) was detected by dual‐luciferase reporter assay. (e and f) qRT‐PCR was employed to detect the enrichments of circADAM9 and miR‐1236‐3p in Ago2‐ or IgG‐immunoprecipitated complexes. (g and h) qRT‐PCR was employed to measure the level of miR‐1236‐3p in tumor and breast cancer (BC) cell lines (MCF‐7 and MDA‐MB‐231). (i) The expression of miR‐1236‐3p was measured using qRT‐PCR in MCF‐7 and MDA‐MB‐231 cells transfected with sh‐NC, sh‐circADAM9#1, sh‐circADAM9#1 + in‐miR‐NC, or sh‐circADAM9#1 + in‐miR‐1236‐3p. *p < 0.05.
CircADAM9 knockdown regulated BC progression by targeting miR‐1236‐3p
The regulatory effects of circADAM9 on miR‐1236‐3p in BC were detected using the following functional experiment. As exhibited in Figure 4a, the silencing of circADAM9 inhibited the colony formation rate, which was abolished by miR‐1236‐3p silencing. EdU assay showed that cell proliferation was curbed by circADAM9 downregulation, but this effect was reverted by miR‐1236‐3p inhibition (Figure 4b). Wound healing and transwell migration assays elucidated that cell migration depletion caused by circADAM9 knockdown was overturned by miR‐1236‐3p downregulation (Figure 4c,d). In addition, circADAM9 deficiency‐triggered invasion suppression was evidently counteracted via miR‐1236‐3p knockdown (Figure 4e). Furthermore, cell apoptosis was significantly enhanced in the si‐circADAM9#1 group, whereas in the si‐circADAM9#1+ in‐miR‐1236‐3p group, this promotion effect was absolutely abrogated (Figure 4f). CircADAM9 blocking caused a decline in Bcl‐2 (apoptosis‐inhibiting protein) and an increase in Bax (apoptosis‐promoting protein) protein level in tumor cells, which were neutralized via miR‐1236‐3p depression (Figure 4g,h). Beyond all that, glycolysis analysis revealed the reduction in glucose production, lactic acid production and ATP level in the circADAM9 silencing group, and these effects were restrained by miR‐1236‐3p repression (Figure 4i–k). In other words, miR‐1236‐3p downregulation might reverse the inhibitory effect of circADAM9 silencing on BC development.
FIGURE 4.

Downregulation of miR‐1236‐3p overturned the effects of circADAM9 knockdown on breast cancer (BC) progression. MCF‐7 and MDA‐MB‐231cells were transfected with sh‐NC, sh‐circADAM9#1, sh‐circADAM9#1 + in‐miR‐NC, sh‐circADAM9#1 + in‐miR‐1236‐3p. (a) Colony formation assay was used to measure colony rate. (b) 5‐ethynyl‐2′‐deoxyuridine (EdU) assay was applied to detect cell viability. (c) A wound healing assay was conducted to examine cell migration. (d and e) A transwell assay was used to evaluate the migration and invasion of cells. (f) Flow cytometry analysis of cell apoptosis rate. (g and h) Western blot was performed to evaluate Bcl‐2 and Bax protein expression. (i–k) Glycolysis metabolism analysis was used to assess glucose consumption (i), lactate production (j) and ATP level (k). *p < 0.05.
MiR‐1236‐3p targeted FGF7 in BC cells
Binding sites of miR‐1236‐3p in FGF7 were identified using the TargetScan database (http://www.targetscan.org/vert_72/) (Figure 5a). There was a significant depletion in luciferase activity in the miR‐1236‐3p and FGF7 3′UTR WT groups, which validated their targeted relationship (Figure 5b,c). FGF7 content was significantly higher in tumor samples (Figure 5d,e). FGF7 protein level in tumor cells was also remarkably enhanced (Figure 5f). Moreover, overexpression of miR‐1236‐3p caused an obvious decrease in FGF7 protein level in MCF‐7 and MDA‐MB‐231 cells, and FGF7 overexpression overturned this influence (Figure 5g). Meanwhile, western blot assay exhibited that the downregulation of miR‐1236‐3p might partly abolish the repression role of circADAM9 on FGF7 expression (Figure 5h). In summary, miR‐1236‐3p targeted FGF7 and negatively regulated the expression of FGF7 in BC cells.
FIGURE 5.

MiR‐1236‐3p directly targeted FGF7. (a) The putative binding sites between miR‐1236‐3p and FGF7 were analyzed by TargetScan. (b and c) Dual‐luciferase reporter assay was used to identify the interaction between miR‐1236‐3p and FGF7 in MCF‐7 and MDA‐MB‐231 cells. (d) Quantitative real‐time polymerase chain reaction (qRT‐PCR) assay was performed to detect the level of FGF7 in BC tumors and normal tissues. (e and f) A western blot assay was executed to measure the protein expression of FGF7 in breast cancer (BC) tumors and cell lines (MCF‐7 and MDA‐MB‐231). (g) A western blot assay was utilized to detect the expression of FGF7 in MCF‐7 and MDA‐MB‐231 cells transfected with miR‐NC, miR‐1236‐3p, miR‐1236‐3p + pcDNA and miR‐1236‐3p + FGF7. (h) A western blot assay was applied to test the expression of FGF7 in MCF‐7 and MDA‐MB‐231 cells transfected with sh‐NC, sh‐circADAM9#1, sh‐circADAM9#1 + in‐miR‐NC, and sh‐circADAM9#1 + in‐miR‐1236‐3p. *p < 0.05.
FGF7 alleviated the inhibitory of miR‐1236‐3p on BC progression
A striking decrease in colony formation number was observed in cells with the transfection of miR‐1236‐3p mimics, but this effect was restrained by overexpression of FGF7 (Figure 6a). In the EdU assay, enhanced miR‐1236‐3p excited a decline in cell proliferation, and FGF7 overexpression relieved this influence (Figure 6b). Meanwhile, FGF7 overexpression could reverse the suppression of cell migration viability caused by miR‐1236‐3p overexpression (Figure 6c,d). The inhibition phenomenon of miR‐1236‐3p overexpression on invasion viability was also restored by FGF7 overexpression (Figure 6e). In addition, the promotion of cell apoptosis caused by miR‐1236‐3p upregulation was partly relieved by the introduction of FGF7 (Figure 6f), as proved by increased Bcl‐2 and reduced Bax (Figure 6g,h). In the miR‐1236‐3p overexpression group, glucose production, lactic acid production, and ATP level were drastically constrained, whereas the influences were regained by the overexpression of FGF7 (Figure 6i–k). Hence, miR‐1236‐3p‐mediated BC development suppression was mitigated via regulating FGF7.
FIGURE 6.

The negative influence on breast cancer (BC) progression caused by miR‐1236‐3p upregulation was alleviated by overexpression of FGF7. MCF‐7 and MDA‐MB‐231 cells were transfected with miR‐NC, miR‐1236‐3p, miR‐1236‐3p + pcDNA or miR‐1236‐3p + FGF7. (a) Colony formation rate was detected by colony formation assay. (b) Proliferation was measured by 5‐ethynyl‐2′‐deoxyuridine (EdU) assay. (c and d) Cell migration was quantified by wound healing and transwell migration assays. (e) Cell invasion ability was detected through transwell invasion assay. (f) Cell apoptosis rate in MCF‐7 and MDA‐MB‐231 cells was measured via flow cytometry analysis. (g and h) The expression of proteins associated with apoptosis (Bcl‐2 and Bax) was assessed by western blot. (i–k) The glucose consumption (i), lactate production (j) and ATP level (k) were evaluated by glycolysis metabolism analysis. *p < 0.05.
CircADAM9 silencing inhibited BC tumor growth in vivo
The biological effects of circADAM9 on tumors growth in vivo were investigated in a mouse xenotransplantation model. Twenty‐eight days after the mice were injected with MDA‐MB‐231 cells with sh‐circADAM9, tumors volume and weight were signally reduced (Figure 7a,b). Additionally, circADAM9 level dwindled in tumor tissues derived from the sh‐circADAM9 group, while miR‐1236‐3p was increased (Figure 7c,d). FGF7 protein in tumors was suppressed in xenograft tumor tissues of the sh‐circADAM9 group (Figure 7e). IHC assay also expounded that the expression of FGF7 and Ki‐67 were inhibited by circADAM9 deficiency (Figure 7f). Altogether, the downregulation of circADAM9 impeded cell growth of BC in vivo.
FIGURE 7.

CircADAM9 promoted breast cancer (BC) tumor formation in vivo. (a and b) The volume and weight of tumors were recorded. (c and d) Quantitative real‐time polymerase chain reaction (qRT‐PCR) assay was used to measure the expression of circADAM9 and miR‐1236‐3p in tumors. (e) Western blot was applied to quantify the protein level of FGF7 in tumors. (f) Immunohistochemistry (IHC) assay was used to detect the level of FGF7 and Ki‐67 in tumors. *p < 0.05.
DISCUSSION
CircRNAs have been identified as a novel tumor markers in recent years. 20 As a new type of regulatory RNA, circRNAs are involved in the tumor process. 21 For example, absence of circDENND4C enhanced the level of miR‐200b/C, thus inhibiting glycolysis and metastasis of BC. 22 Blocking circ_0000520 partially inhibited the growth and metastasis of BC cells. 23 Silencing of circ_0004771 activated miR‐653 by targeting the ZEB2 pathway, inhibited BC cell proliferation, and induced apoptosis. 24 In another study, circADAM9 was highly expressed in BC tissues and might therefore be a diagnostic biomarker for the early detection of BC. 25 Consistent with this previous report, our data proved that circADAM9 expression was obviously increased in BC samples. Functionally, the current study verified that the silencing of circADAM9 could suppress the cell proliferation, migration, invasion, angiogenesis, and glycolysis of BC, and promote cell apoptosis in vitro. Also, the repression of circADAM9 deficiency on tumor growth was also proven in vivo. These findings implied that circADAM9 might play an oncogenic role in BC development, which brings new light to the investigation of BC.
Mechanistically, miRNAs could be targeted by circRNAs and then regulated mRNA to influence BC progression. For example, CircACAP2 was an miR‐29A sponge, targeting B‐3P‐COL5A1 and promoting BC proliferation and metastasis. 26 E2F1 and EIF4A3 mediated circSEPT9 promoted the development of TNBC. 27 The reduction of miR‐143 induced by hsa_circ_0001982 facilitated the carcinogenesis of BC cells. 28 In our study, miR‐1236‐3p was predicted as a circADAM9 target using a bioinformatic tool and a series of experiments, and was negatively regulated by circADAM9. In addition, miR‐1236‐3p inhibition overturned circADAM9 silencing‐caused BC progression repression. In addition, a recent study indicated that circADAM9 might boost pancreatic cancer cell growth and metastasis via modulating miR‐217. 29 The above data suggested that circADAM9 might partake in complex regulatory networks and confer cell‐type‐specific modulation of cell function in various tumors.
FGF7, which belongs to the FGF7 subfamily, is a specific interstitial growth factor. 30 , 31 FGF7 and its specific receptor FGF receptor 2 (FGFR2) is involved in the development of many cancers. 32 , 33 , 34 We have verified that there were targeting sites between miR‐1236‐3p and FGF7, and miR‐1236‐3p overexpression‐mediated BC progression was regained by FGF7 overexpression. Beyond that, circADAM9 depletion‐mediated FGF7 expression repression in BC cell lines was partly overturned via sponging miR‐1236‐3p, further supporting the regulatory mechanism of circADAM9/miR‐1236‐3p/FGF7 in BC cell lines. Additionally, this research was limited by the small sample size and in future studies we will try to recruit more respondents.
In conclusion, in this study the downregulation of circADAM9 suppressed the progression of BC via the miR‐1236‐3p/FGF7 pathway, which may provide novel strategies and potential targets for BC therapy in the future.
AUTHOR CONTRIBUTIONS
Jianshan Lin designed and supervised the study. Bo Huang and Cunchuan Wang conducted the experiments and drafted the manuscript. Yichao Zhang collected and analyzed the data, Peng Sun prepared the figures and edited the manuscript. All authors reviewed the manuscript.
CONFLICT OF INTEREST STATEMENT
The authors declare that they have no conflicts of interest.
Supporting information
FIGURE S1. Overexpression of circADAM9 might boost the progression on BC. MCF‐7 and MDA‐MB‐231 cells were transfected with pCD5‐ciR or circADAM9. (a) The expression level of circADAM9 was detected in MCF‐7 and MDA‐MB‐231 cells using qRT‐PCR. (b) Relative colony formation rate was assessed using colony formation assay. (c) EdU assay was applied to measure cell viability and proliferation. (d) Wound healing assay was performed to determine cell migration ability. (e and f) A transwell assay was performed to examine cell migration and invasion. (g) Cell apoptosis rate was detected using flow cytometry assay. (h and i) The expression of apoptosis‐related proteins (Bcl‐2 and Bax) was determined using western blot. (j and k) The glucose consumption and lactate production were assessed using glycolysis metabolism analysis. (l) The ATP level was quantified using ATP Assay Kit. *p < 0.05.
Huang B, Zhang Y, Sun P, Lin J, Wang C. Knockdown of circADAM9 inhibits cell progression and glycolysis by targeting the miR‐1236‐3p/FGF7 axis in breast cancer. Thorac Cancer. 2023;14(24):2350–2360. 10.1111/1759-7714.15025
Contributor Information
Jianshan Lin, Email: plftqfu@163.com.
Cunchuan Wang, Email: hmht90x@163.com.
DATA AVAILABILITY STATEMENT
The datasets used and analyzed during the current study are available from the corresponding author on reasonable request.
REFERENCES
- 1. DeSantis CE, Ma J, Goding Sauer A, Newman LA, Jemal A. Breast cancer statistics, 2017, racial disparity in mortality by state. CA Cancer J Clin. 2017;67:439–48. [DOI] [PubMed] [Google Scholar]
- 2. Anastasiadi Z, Lianos GD, Ignatiadou E, Harissis HV, Mitsis M. Breast cancer in young women: an overview. Updates Surg. 2017;69:313–7. [DOI] [PubMed] [Google Scholar]
- 3. Hattori M, Iwata H. Advances in treatment and care in metastatic breast cancer (MBC): are there MBC patients who are curable? Chin Clin Oncol. 2018;7:23. [DOI] [PubMed] [Google Scholar]
- 4. Ebbesen KK, Kjems J, Hansen TB. Circular RNAs: identification, biogenesis and function. Biochim Biophys Acta. 2016;1859:163–8. [DOI] [PubMed] [Google Scholar]
- 5. Qu S, Yang X, Li X, Wang J, Gao Y, Shang R, et al. Circular RNA: a new star of noncoding RNAs. Cancer Lett. 2015;365:141–8. [DOI] [PubMed] [Google Scholar]
- 6. Kristensen LS, Andersen MS, Stagsted LVW, Ebbesen KK, Hansen TB, Kjems J. The biogenesis, biology and characterization of circular RNAs. Nat Rev Genet. 2019;20:675–91. [DOI] [PubMed] [Google Scholar]
- 7. Shi Y, Fang N, Li Y, Guo Z, Jiang W, He Y, et al. Circular RNA LPAR3 sponges microRNA‐198 to facilitate esophageal cancer migration, invasion, and metastasis. Cancer Sci. 2020;111:2824–36. [DOI] [PMC free article] [PubMed] [Google Scholar]
- 8. Wei L, Sun J, Zhang N, et al. Noncoding RNAs in gastric cancer: implications for drug resistance. Mol Cancer. 2020;19:62. [DOI] [PMC free article] [PubMed] [Google Scholar]
- 9. Li J, Sun D, Pu W, Wang J, Peng Y. Circular RNAs in cancer: biogenesis, function, and clinical significance. Trends Cancer. 2020;6:319–36. [DOI] [PubMed] [Google Scholar]
- 10. Li Z, Chen Z, Hu G, Jiang Y. Roles of circular RNA in breast cancer: present and future. Am J Transl Res. 2019;11:3945–54. [PMC free article] [PubMed] [Google Scholar]
- 11. Liu Z, Zhou Y, Liang G, Ling Y, Tan W, Tan L, et al. Circular RNA hsa_circ_001783 regulates breast cancer progression via sponging miR‐200c‐3p. Cell Death Dis. 2019;10:55. [DOI] [PMC free article] [PubMed] [Google Scholar]
- 12. Ji C, Hu J, Wang X, Zheng W, Deng X, Song H, et al. Hsa_circ_0053063 inhibits breast cancer cell proliferation via hsa_circ_0053063/hsa‐miR‐330‐3p/PDCD4 axis. Aging (Albany NY). 2021;13:9627–45. [DOI] [PMC free article] [PubMed] [Google Scholar]
- 13. Tian D, Xiang Y, Tang Y, Ge Z, Li Q, Zhang Y. Circ‐ADAM9 targeting PTEN and ATG7 promotes autophagy and apoptosis of diabetic endothelial progenitor cells by sponging mir‐20a‐5p. Cell Death Dis. 2020;11:526. [DOI] [PMC free article] [PubMed] [Google Scholar]
- 14. Zhang M, Bai X, Zeng X, et al. circRNA‐miRNA‐mRNA in breast cancer. Clin Chim Acta. 2021;523:120–30. [DOI] [PubMed] [Google Scholar]
- 15. Kabekkodu SP, Shukla V, Varghese VK, D' Souza J, Chakrabarty S, Satyamoorthy K. Clustered miRNAs and their role in biological functions and diseases. Biol Rev Camb Philos Soc. 2018;93:1955–86. [DOI] [PubMed] [Google Scholar]
- 16. Jia L, Liu W, Cao B, Li H, Yin C. MiR‐507 inhibits the migration and invasion of human breastcancer cells through Flt‐1 suppression. Oncotarget. 2016;7:36743–54. [DOI] [PMC free article] [PubMed] [Google Scholar]
- 17. Lian H, Wang L, Zhang J. Increased risk of breast cancer associated with CC genotype of has‐miR‐146a Rs2910164 polymorphism in Europeans. PLoS One. 2012;7:e31615. [DOI] [PMC free article] [PubMed] [Google Scholar]
- 18. Yin Z, Wang W, Qu G, Wang L, Wang X, Pan Q. MiRNA‐96‐5p impacts the progression of breast cancer through targeting FOXO3. Thorac Cancer. 2020;11:956–63. [DOI] [PMC free article] [PubMed] [Google Scholar]
- 19. Inubushi S, Kawaguchi H, Mizumoto S, et al. Oncogenic miRNAs identified in tear exosomes from metastatic breast cancer patients. Anticancer Res. 2020;40:3091–6. [DOI] [PubMed] [Google Scholar]
- 20. Nair AA, Niu N, Tang X, Thompson KJ, Wang L, Kocher JP, et al. Circular RNAs and their associations with breast cancer subtypes. Oncotarget. 2016;7:80967–79. [DOI] [PMC free article] [PubMed] [Google Scholar]
- 21. Memczak S, Jens M, Elefsinioti A, Torti F, Krueger J, Rybak A, et al. Circular RNAs are a large class of animal RNAs with regulatory potency. Nature. 2013;495:333–8. [DOI] [PubMed] [Google Scholar]
- 22. Ren S, Liu J, Feng Y, et al. Knockdown of circDENND4C inhibits glycolysis, migration and invasion by up‐regulating miR‐200b/c in breast cancer under hypoxia. J Exp Clin Cancer Res. 2019;38:388. [DOI] [PMC free article] [PubMed] [Google Scholar]
- 23. Zang H, Li Y, Zhang X, Huang G. Blocking circ_0000520 suppressed breast cancer cell growth, migration and invasion partially via miR‐1296/SP1 Axis both in vitro and in vivo. Cancer Manag Res. 2020;12:7783–95. [DOI] [PMC free article] [PubMed] [Google Scholar]
- 24. Xie R, Tang J, Zhu X, Jiang H. Silencing of hsa_circ_0004771 inhibits proliferation and induces apoptosis in breast cancer through activation of miR‐653 by targeting ZEB2 signaling pathway. Biosci Rep. 2019;39:BSR20181919. [DOI] [PMC free article] [PubMed] [Google Scholar]
- 25. Ameli‐Mojarad M, Ameli‐Mojarad M, Nourbakhsh M, Nazemalhosseini‐Mojarad E. Circular RNA hsa_circ_0005046 and hsa_circ_0001791 may become diagnostic biomarkers for breast cancer early detection. J Oncol. 2021;2021:2303946. [DOI] [PMC free article] [PubMed] [Google Scholar]
- 26. Zhao B, Song X, Guan H. CircACAP2 promotes breast cancer proliferation and metastasis by targeting miR‐29a/b‐3p‐COL5A1 axis. Life Sci. 2020;244:117179. [DOI] [PubMed] [Google Scholar]
- 27. Zheng X, Huang M, Xing L, et al. The circRNA circSEPT9 mediated by E2F1 and EIF4A3 facilitates the carcinogenesis and development of triple‐negative breast cancer. Mol Cancer. 2020;19:73. [DOI] [PMC free article] [PubMed] [Google Scholar]
- 28. Tang YY, Zhao P, Zou TN, Duan JJ, Zhi R, Yang SY, et al. Circular RNA hsa_circ_0001982 promotes breast cancer cell carcinogenesis through decreasing miR‐143. DNA Cell Biol. 2017;36:901–8. [DOI] [PubMed] [Google Scholar]
- 29. Xing C, Ye H, Wang W, Sun M, Zhang J, Zhao Z, et al. Circular RNA ADAM9 facilitates the malignant behaviours of pancreatic cancer by sponging miR‐217 and upregulating PRSS3 expression. Artif Cells Nanomed Biotechnol. 2019;47:3920–8. [DOI] [PubMed] [Google Scholar]
- 30. Zinkle A, Mohammadi M. Structural biology of the FGF7 subfamily. Front Genet. 2019;10:102. [DOI] [PMC free article] [PubMed] [Google Scholar]
- 31. Zhang F, Zhang J, Linhardt RJ. Interactions between nattokinase and heparin/GAGs. Glycoconj J. 2015;32:695–702. [DOI] [PMC free article] [PubMed] [Google Scholar]
- 32. Huang T, Wang L, Liu D, Li P, Xiong H, Zhuang L, et al. FGF7/FGFR2 signal promotes invasion and migration in human gastric cancer through upregulation of thrombospondin‐1. Int J Oncol. 2017;50:1501–12. [DOI] [PMC free article] [PubMed] [Google Scholar]
- 33. Kwabi‐Addo B, Ozen M, Ittmann M. The role of fibroblast growth factors and their receptors in prostate cancer. Endocr Relat Cancer. 2004;11:709–24. [DOI] [PubMed] [Google Scholar]
- 34. Yamayoshi T, Nagayasu T, Matsumoto K, Abo T, Hishikawa Y, Koji T. Expression of keratinocyte growth factor/fibroblast growth factor‐7 and its receptor in human lung cancer: correlation with tumour proliferative activity and patient prognosis. J Pathol. 2004;204:110–8. [DOI] [PubMed] [Google Scholar]
Associated Data
This section collects any data citations, data availability statements, or supplementary materials included in this article.
Supplementary Materials
FIGURE S1. Overexpression of circADAM9 might boost the progression on BC. MCF‐7 and MDA‐MB‐231 cells were transfected with pCD5‐ciR or circADAM9. (a) The expression level of circADAM9 was detected in MCF‐7 and MDA‐MB‐231 cells using qRT‐PCR. (b) Relative colony formation rate was assessed using colony formation assay. (c) EdU assay was applied to measure cell viability and proliferation. (d) Wound healing assay was performed to determine cell migration ability. (e and f) A transwell assay was performed to examine cell migration and invasion. (g) Cell apoptosis rate was detected using flow cytometry assay. (h and i) The expression of apoptosis‐related proteins (Bcl‐2 and Bax) was determined using western blot. (j and k) The glucose consumption and lactate production were assessed using glycolysis metabolism analysis. (l) The ATP level was quantified using ATP Assay Kit. *p < 0.05.
Data Availability Statement
The datasets used and analyzed during the current study are available from the corresponding author on reasonable request.