

Abstract
Based on survey data conducted in Guangzhou in 2021, this study employs canonical correlation analysis (CCA) to evaluate the relationship between neighborhood green space, residents’ green space use behavior, and their mental health. The results show that compared with the objectively measured accessibility, residents’ subjective perceived accessibility of neighborhood green space plays a greater role in promoting green space use behavior and mental health. Meanwhile, the plant diversity, safety, and the number of recreational facilities in a green space can promote the frequency of green space use, improve residents’ mental health status and reduce their perceived stress. Although perceived accessibility is more related to green space use behavior than green space quality indicators, green space safety and recreational facilities have many more benefits on mental health than perceived accessibility. In addition, residents’ green space use behavior, especially green space visit frequency, can promote mental health and reduce perceived stress.
Keywords: Neighborhood green space, Accessibility, Quality, Mental health, Canonical correlation analysis
Introduction
As informatization progresses and transforms modern lifestyles, people worldwide, especially in cities, are under increasing stress, and their mental health is facing severe challenges [1, 2]. Green space plays an essential role in urban sustainability and public health. Studies have substantiated the positive effect of green space on air quality, biodiversity, and reducing heat island effects [3–5]. The potential association between green space and mental health has recently become an important issue. Green space exposure positively impacts social interaction, enhances attachment to place, and restores attention [6–8], thereby improving positive changes in mood and relieving mental stress [9–11].
Neighborhood green space provides outdoor recreational spaces for residents’ activities and social interaction in their daily lives. Green space in neighborhoods has been confirmed as a critical element for promoting residents’ mental well-being [12]. However, with the acceleration of urbanization, increased residential densities are gradually depriving residents of access to green space and its mental health benefits [13]. Against the background of a high-density urban environment and its limited spatial resources, the increasing demand for high-quality green space near neighborhoods has also inspired extensive research on what characteristics of green space can more effectively improve mental health [14–16]. Studies have contributed to understanding the relationship between green space accessibility and residents’ mental well-being, and have revealed accessible green space is associated with better mental status and less stress [17–20]. However, less attention has been paid to the relationship between perceived and objectively measured green space accessibility and mental health. Proximity to green space is associated with the frequency and duration of green space exposure, which is associated with mental health [13, 21]. Green space quality, like biological diversity, safety, and cleanliness, has also been found to be related to residents’ green space use behavior and mental health. In addition, the concepts of mental health and stress are composed of multiple dimensions [22, 23]. However, it is unclear in existing studies what the relationship is between green space accessibility, green space quality, and particular dimensions of mental health or stress.
To address these issues above, this study employs canonical correlation analysis (CCA) to explore the association between the accessibility and quality of neighborhood green space and residents’ mental health. Based on the above background, this paper, using 2021 questionnaire survey data from Guangzhou, China, investigates the following two questions: Firstly, are there differences in the effects of perceived and objective green space accessibility on residents’ green space use behavior and mental health? Secondly, which green space quality indicators promote residents’ green space visiting and mental health? The findings of this study will help to insightfully recognize the relationship between green space, green space use behavior, and public health and provide scientific guidance for optimizing the urban green space system and building green, livable, and healthy neighborhoods.
The remainder of the paper is organized as follows. The literature on green space accessibility, quality, use behavior, and mental health is briefly reviewed in the “Literature Review” section. The “Methodology” section introduces the study data and methods used in the analysis. The “Results” section presents the results of the CCA, while the “Discussion” section discusses the CCA estimation results. The “Conclusions” section summarizes the key findings.
Literature Review
Green Space Accessibility and Mental Health
Although many researchers have suggested a positive association between green space accessibility and mental health [24–27], mixed results were observed, especially the objective accessibility measured by green space proximity [12, 20, 28, 29]. For instance, according to Noordzij et al. [29], proximity to green space is associated with higher mental health levels. Yet, there was no evidence for relationships between green space accessibility and mental health in these samples during follow-up.
As highlighted by previous studies, the perceived accessibility of green space is not necessarily equal to the actual level [30]. Differences in transportation modes for green space visiting, travel ability, and familiarity with their neighborhood shape the diverse range of daily activities of residents in the same neighborhood. Research has pointed out the strength of perceived dimensions in measuring green space accessibility and the health effects of green space [13]. They emphasized the importance of perceived green space or vegetation affecting residents’ health [31]. However, studies seldom compare the different effects of perceived and objective green space accessibility on residents’ mental health.
The Quality of Green Space and Mental Health
Green space quality reflects the potential attractiveness of the green space to provide services to the surrounding residents. In addition to accessibility, the quality characteristics of green space have been proven to be key predictors of mental health [32]. Higher quality green space is associated with better social cohesion, perceived restorativeness, and mental health [33–36]. According to previous studies, green space quality generally includes surrounding architecture, activity facilities, amenities, aesthetics and attractiveness, safety, and biological diversity [37, 38]. Some studies have emphasized that the presence of specific facilities is associated with increased physical activity in children and adolescents [39, 40]. The green space aesthetic has been recognized as an essential aspect of improving public health and well-being [41, 42]. Uncivilized behavior and insecurity can lead to a rejection of green space and thus a reduction in use [43, 44]. Additionally, many studies have confirmed that green space naturalness and biodiversity positively impact the restoration potential and mental health benefits [14, 36, 45–48]. These studies explored the impact of one or several aspects of green space quality on residents’ green space use behavior and health or well-being. However, the concept of green space “quality” is composite and multidimensional [49, 50] and each of these dimensions may have a different impact on residents’ green space use and mental health. Therefore, to guide green space planning and design more microcosmically, it is significant to comprehensively identify and compare the direction and strength of associations between multiple quality characteristics and residents’ green space use behavior and mental health.
Green Space Use Behavior and Mental Health
Previous epidemiological studies have focused on the relationship between green space exposure and mental health, and in recent years, scholars have considered residents’ actual green space use behavior [8]. Studies have constructed research frameworks that include green space characteristics, residents’ green space use behavior, and mental health and found potential associations between them [13, 21, 51, 52]. It has been suggested that visiting green space helps to improve mental health by relaxing and calming people and relieving anxiety, tension, depression, and fatigue [53–56].
The frequency and duration of green space visiting are the most fundamental variables in relevant research on green space use behavior and public health [57]. Evidence has been revealed in previous studies that people who spend more time in green space tend to report higher scores on mental health [58, 59]. Frequent visits to green space are negatively associated with a mental disorder [60]. However, findings also vary on whether the frequency and duration of green space visiting contribute to mental health and its different aspects [33, 57, 61–63]. It is worth examining how and to what extent the frequency and duration of green space visits affect residents’ mental health.
Methodology
Study Data
This study is based on survey data on green space and health in seven districts of Guangzhou, China. The formal survey was conducted from January 2021 to February 2021 after a pre-survey in December 2020 during which we revised and refined the questionnaire design based on the feedback. The respondents were permanent residents over 16 years old living in these districts. To ensure the randomness of the sample space and the balance of the socio-economic characteristics of the respondents, the survey was conducted by a combination of online and offline methods. A total of 1391 questionnaires were collected, of which 1265 were valid (effective rate 90.94%), distributed in 560 neighborhoods (Fig. 1). Table 1 presents the socio-economic characteristics of the sample population.
Fig. 1.
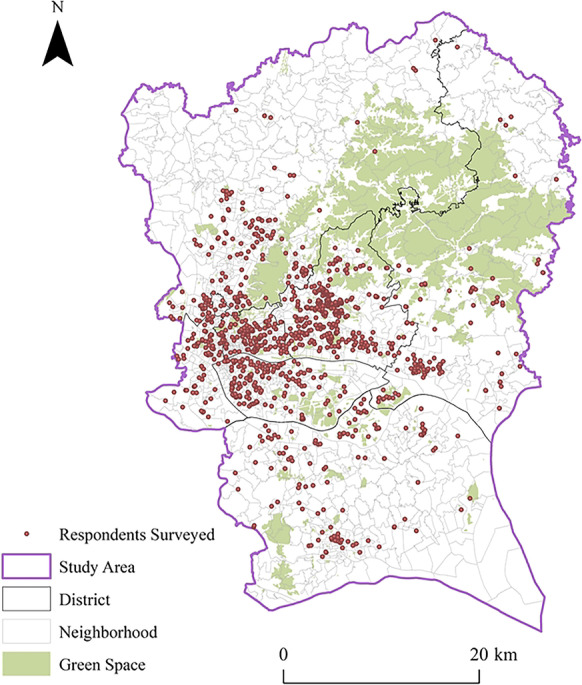
Spatial distribution of survey respondents
Table 1.
Socio-economic characteristics of the sample population
| Variable | Level | N | Percent (%) |
|---|---|---|---|
| Gender | Male | 561 | 44.35 |
| Female | 704 | 55.65 | |
| Age | 16–24 | 349 | 27.59 |
| 25–34 | 498 | 39.37 | |
| 35–49 | 253 | 20.00 | |
| 50–64 | 125 | 9.88 | |
| ≥ 65 | 40 | 3.16 | |
| Any child under 16 | No | 803 | 63.48 |
| Yes | 462 | 36.52 | |
| Education level | Junior middle school and below | 121 | 9.57 |
| Senior high school | 196 | 15.49 | |
| Junior college | 174 | 13.76 | |
| Bachelor’s degree | 471 | 37.23 | |
| Master’s degree or above | 303 | 23.95 | |
| Work status | Employed | 844 | 66.72 |
| Unemployed | 325 | 25.69 | |
| Retired | 96 | 7.59 | |
| Car ownership | No | 610 | 48.22 |
| Yes | 655 | 51.78 | |
| Household monthly income per capita | ≤ 2999 RMB | 113 | 8.93 |
| 3000–3999 RMB | 135 | 10.67 | |
| 4000–5999 RMB | 265 | 20.95 | |
| 6000–7999 RMB | 203 | 16.05 | |
| 8000–9999 RMB | 139 | 10.99 | |
| 10,000–14,999 RMB | 204 | 16.13 | |
| ≥ 15,000 RMB | 206 | 16.28 |
Measures of Residents’ Mental Health and Perceived Stress
The Mental Health Inventory-5 (MHI-5) and Perceived Stress Scale-4 (PSS-4) items were used to measure residents’ mental health status and perceived stress levels, respectively. The MHI-5, deriving from the MHI-38 [64], was developed to measure overall emotion [23]. It included five questions to report the frequency of symptoms during the previous month: how much of the time have you (1) “been a very nervous person?”, (2) “felt so down in the dumps that nothing could cheer you up?”, (3) “felt downhearted and blue?”, (4) “felt calm and peaceful?”, and (5) “been a happy person?”. PSS-4 was used to assess psychological stress, including the following items: in the last month, how often have you (1) “felt that you were unable to control the important things in your life?”, (2) “felt confident about your ability to handle your personal problems?”, (3) “felt that things were going your way?”, and (4) “felt difficulties were piling up so high that you could not overcome them?” [22]. The responses to MHI-5 and PSS-4 were made on a 5-point Likert scale, ranging from never to always/very often, which were scaled from 1 to 5. We conducted reliability tests on the results of the MHI-5 and PSS-4 (reverse-scoring the first three questions of MHI-5 and the first two questions of PSS-4 in reliability tests), and the Cronbach’s α coefficients (0.843 and 0.712, respectively) showed adequate internal consistency.
Accessibility of Neighborhood Green Space
Objective accessibility and perceived accessibility of neighborhood green space were both explored. The green space data was obtained from OpenStreetMap 2020. The Neighborhood Green Accessibility Index (NGAI) was constructed based on the area and residents’ travel distance to nearby green space within 20 min of walking from the residence. The NGAI is calculated as:
| 1 |
where NGAIi is the neighborhood green accessibility index of sample i; Mj is the area of green space j that is within 20-min walking distance of this sample; Dij is the actual walking travel distance from the residence of sample i to the edge of green space j; and b is the friction of distance, which describes as the distance between the sample’s residence and the green space increases, the possibility for the sample to access the green space decreases. The value of the friction of distance is usually 1 or 2. In this study, its value was set as 1.
We also considered the perceived accessibility of neighborhood green space to compare the impact of subjective and objective green space accessibility. Data on the perceived accessibility of neighborhood green space were obtained through the questionnaire (Table 2). The responses were made on a 5-point Likert scale, ranging from “very inconvenient” to “very convenient” on a scale from 1 to 5.
Table 2.
Indicators of neighborhood green space
| Dimension | Measurement | Indicator | Index/ questionnaire questions |
|---|---|---|---|
| Accessibility | Geographic Information System | Objective accessibility | Neighborhood Green Accessibility Index |
| Questionnaire survey | Perceived accessibility | “How convenient to reach, access, and visit are the green spaces near your neighborhood?” | |
| Green space quality | Questionnaire survey | Plant diversity | “How about the plant diversity (plant color, species, etc.) of green spaces near your neighborhood?” |
| Animal diversity | “How about the animal diversity (birds, butterflies, etc.) of green spaces near your neighborhood?” | ||
| Cleanliness | “How clean and maintained is the green space near your neighborhood?” | ||
| Safety | “How safe is the green space near your neighborhood?” | ||
| Aesthetics | “How beautiful is the green space near your neighborhood?” | ||
| Recreation facilities | “How many recreational facilities (sports field, park bench, toilets, park trash can, etc.) are in the green spaces near your neighborhood?” |
The Quality of the Green Space
Based on previous studies on green space quality related to residents’ behavior or mental health, the vegetation diversity, animal diversity, cleanliness, safety, aesthetics, and recreation facilities of green space were used to characterize green space quality (Table 2) through a questionnaire survey. These indicators were evaluated and scored with a 5-point Likert scale. The higher the score, the higher the quality of the green space in this regard. For example, plant diversity was rated from 1 to 5 on a scale from “very homogeneous” to “very rich”.
Green Space Use Behavior
The visit frequency and duration were two major dimensions to reflect residents’ use behavior of neighborhood green space in this study, which were obtained by the survey through the following levels. The green space visit frequency: hardly ever or several times a year, once or twice a month, once a week, several times a week, and daily or almost daily, scored by 1 to 5, respectively. The green space visit duration: < 15 min, 15–30 min, 0.5–1 h, 1–2 h, and > 2 h, scored by 1 to 5, respectively.
Canonical Correlation Analysis
Canonical correlation analysis (CCA) is a statistical method to identify and measure the linear relationship between two datasets of multidimensional variables [65]. Although CCA has been widely used in social sciences, the method has been seldom applied to green space and health studies [55]. Based on the dimensionality reduction technique to linearly transform the two groups of variables, CCA can extract the linear combination with the greatest correlation to reflect the correlation between the two groups of multidimensional variables [66].
For a given two sets of variables, X = [x1,x2,x3…xp] and Y = [y1,y2,y3…yq], CCA searches for the linear combination of them and obtains the coefficients of the linear combination, ak1, ak2, ak3, …, akp and bk1, bk2, bk3, …, bkq. It generates a pair of canonical variates, Uk and Vk, to maximize the correlation between the projections of the variables on the canonical variates [67]. The linear combinations of two sets of variables can be defined as follows:
| 2 |
| 3 |
where Uk and Vk are the kth pair of canonical variates generated from X and Y, respectively, and akp and bkq are the canonical coefficients. We report and analyze the standardized akp and bkq generated from CCA estimation so as to compare the contributions of variables more intuitively and more easily. The standardization method used here is the Z-score method.
The specific algorithm flow of CCA is as follows. In the first step, the first pair of canonical variates (U1, V1) is formed as the linear combination with the greatest correlation. Thereafter, the linear combination uncorrelated with the first pair of canonical variates is selected among the remaining linear combinations of variables, while ensuring that the canonical correlation coefficient is the largest. This process continues until all correlations between the two sets of variables are extracted, n pairs of canonical variates combinations are obtained, and n ≤ min (p, q) [66]. The likelihood-ratio method was used to test whether the canonical correlation coefficient between Uk and Vk was significantly different from 0. In this paper, we only analyze the estimation results of the first pair of canonical variates combinations because the canonical correlation between them is the greatest. The canonical correlation coefficient (r1) between U1 and V1 can be calculated as follows [68]:
| 4 |
To explore the relationship between neighborhood green space, residents’ green space use behavior, and mental health (including perceived stress), we construct and estimate 5 canonical correlation models: Model 1 “neighborhood green space–residents’ green space use behavior,” Model 2 “residents’ green space use behavior–residents’ mental health (MHI-5),” Model 3 “residents’ green space use behavior–residents’ perceived stress (PSS-4),” Model 4 “neighborhood green space–residents’ mental health (MHI-5),” and Model 5 “neighborhood green space–residents’ perceived stress (PSS-4)”(Fig. 2).
Fig. 2.

Framework diagram of canonical correlation models construction
Results
The Association Between Neighborhood Green Space and Residents’ Green Space Use Behavior
Figure 3 presents the result of Model 1 and the correlation between neighborhood green space and residents’ green space use behavior. The canonical correlation coefficient (r1) of the first pair of canonical variates is 0.392 and statistically significant (P < 0.001) (Table 3). If the variables in the two groups are the same color (red vs blue), it indicates a positive correlation between them. Otherwise, they are negatively correlated. The gradation of color represents the weight of the variable to the canonical variate.
Fig. 3.

Canonical correlation model of neighborhood green space and residents’ green space use behavior (Model 1)
Table 3.
The results of the first pair of canonical variates in five canonical correlation models
| X–Y | Canonical correlation coefficient (r1) | Eigenvalue | Wilks statistic | F-value | DF | Sig. of r1 |
|---|---|---|---|---|---|---|
| Neighborhood green space–Residents’ green space use behavior | 0.392 | 0.181 | 0.8154 | 16.856 | 16 | < 0.001 |
| Residents’ green space use behavior–Residents’ mental health (MIH-5) | 0.331 | 0.123 | 0.8876 | 15.461 | 10 | < 0.001 |
| Residents’ green space use behavior–Residents’ perceived stress (PSS-4) | 0.312 | 0.108 | 0.9013 | 16.782 | 8 | < 0.001 |
| Neighborhood green space–Residents’ mental health (MIH-5) | 0.250 | 0.066 | 0.9204 | 2.622 | 40 | < 0.001 |
| Neighborhood green space–Residents’ perceived stress (PSS-4) | 0.233 | 0.057 | 0.9356 | 2.631 | 32 | < 0.001 |
It can be seen from the results in Fig. 3 that the main contribution variables of neighborhood green space (U1) are perceived accessibility, plant diversity, safety, and recreational facilities, and their standardized coefficients are 0.606, 0.370, 0.277, and 0.218, respectively. The main contributing factor to residents’ green space use behavior (V1) is green space visit frequency (standardized coefficient 1.036). This shows that residents’ perceived accessibility, plant diversity, safety, and recreational facilities of neighborhood green space have the greatest correlation with residents’ green space use behavior, especially green space visit frequency. Although animal diversity is positively correlated with the frequency of green space visits, its contribution is much less than plant diversity (the standardization coefficient is only 0.013).
Compared with the frequency of green space visits, the above neighborhood green space variables correlate opposite with green space visit duration. This is probably because, in many cases, residents’ length of green space visits is negatively correlated with the frequency of green space visits. People usually tend to stay shorter in the green space where they can access it easily or visit frequently, and conversely, in the green space that is hard to access or they visit less, they are more likely to stay longer. Specifically, the objective accessibility, cleanliness, and aesthetics of the green space are positively correlated with the green space visit duration. However, the objective accessibility of the green space only has a tiny effect on residents’ green space use behavior because of its small, standardized coefficient (-0.008), which is the smallest of all the green space variables we consider.
The Association Between Residents’ Green Space Use Behavior and Mental Health
In Model 2 and Model 3, we explored the correlation of residents’ green space use behavior with mental health (MHI-5) and perceived stress (PSS-4). The results (Table 3) show that the canonical correlation coefficients of the first pair of canonical variates combinations are 0.331 and 0.312, respectively, and both are statistically significant (P < 0.001).
On the whole, residents’ green space use behavior is beneficial to promoting residents’ mental health status and reducing perceived stress levels. Both the green space visit frequency and green space visit duration play a positive role, although the former’s impact is greater. Specifically, residents who visit green spaces more frequently and stay longer can feel happy, calm, and peaceful and can alleviate their down, blue and nervous emotions. Meanwhile, they are more likely to feel in control of their own lives and tend to be less bothered by stress (Fig. 4).
Fig. 4.

Canonical correlation models of residents’ green space use behavior-mental health (a) and residents’ green space use behavior-perceived stress (b)
The Association Between Neighborhood Green Space and Mental Health
The associations between neighborhood green space and residents’ mental health (MHI-5) and perceived stress (PSS-4) are analyzed, whose canonical correlation coefficient for the first pair of canonical variates combinations are 0.250 (P < 0.001) (Model 4) and 0.233 (P < 0.001) (Model 5), respectively (Fig. 5).
Fig. 5.

Canonical correlation models of neighborhood green space-mental health (a) and neighborhood green space-perceived stress (b)
Comparing the results of these two models, we can derive from the standardized coefficient that the perceived accessibility of neighborhood green space plays a greater role in both mental health status and perceived stress level than objective accessibility. Moreover, the perceived accessibility and the objective accessibility of the green space play different roles in mental health, having an impact in different directions. Residents’ subjective perception of the accessibility of neighborhood green space can make them feel happier, calmer, and more peaceful. It can also improve their confidence in handling personal problems and life satisfaction.
In terms of green space quality indicators, the safety of green space, the recreational facilities, cleanliness, and plant diversity have a positive impact on residents’ mental health (MHI-5) and perceived stress (PSS-4), especially in increasing happiness, calmness and peace, and improving confidence to handle personal problems and difficulties. However, the aesthetics and animal diversity of the green space are positively correlated with downcast mood, nervous emotion, and depression, as well as feeling a lot of difficulties and being unable to overcome them. In other words, these two quality indicators may have adverse effects on residents’ mental health status and perceived stress levels. From the above, different green space quality characteristics play different roles in residents’ mental health status and perceived stress levels.
Discussion
Previous studies on perceived and objective green space accessibility also confirm that perceived accessibility is more effective in promoting physical activity and public health than objective accessibility [69]. Perceived accessibility is a combination of physical proximity and the transportation mode for visiting, neighborhood safety, and perceived convenience [70, 71]. Among all the neighborhoods, we observed those neighborhoods with large gaps between objective and perceived green space accessibility. It was found that neighborhoods with more developed transport infrastructure and built environments tend to have better perceived green space accessibility than objective green space accessibility. The possible explanations are, on the one hand, that developed transportation facilities promote various and convenient travel modes; on the other hand, the walkable environment may shorten residents’ perceived time to access the green space. Residents living near a larger green space are more likely to have lower perceived accessibility than objective accessibility to green space than those living near a small green space. This may be because that large area of green space usually has multiple entrances or access points, and the residence may be much closer to the location of the green space entrances than to the nearest green space edge as measured objectively. The residence may be far away from the green space entrance than the nearest green space edge measured objectively. In addition, some large parks, especially parks with entrance fees or forest parks, are not preferred by residents for their daily activities, so residents are likely to ignore the closest but less accessible green spaces when making subjective evaluations of green space accessibility and instead evaluate the green spaces that are accessible routinely. This shows that green space close to the scale of residents’ daily activities plays a vital role in perceived accessibility. These results also suggest that, while it is difficult to improve the spatial accessibility of green spaces, it is also effective to promote the visiting frequency if the perceived accessibility of green spaces can be improved by increasing and highlighting green space entrances, optimizing the walking environment and public transportation infrastructure near green spaces, and creating a safe neighborhood.
In terms of the green space plant and animal diversity, previous studies have shown that biodiversity positively affects resident green space use, restoration of attention capability, and mental well-being [45, 47, 48, 72]. However, this study showed that plant diversity was a positive contributing factor to the frequency of green space visits and mental health. Conversely, animal diversity was negatively associated with green space visit duration and the mental health of residents. This finding is consistent with the research of Wang et al. [73], where mental well-being was found not to be influenced by animals such as fish and birds. Some studies have also shown that some animals (pigeons, bats, and squirrels) may negatively affect green space visiting because they are associated with the accumulation of garbage and the spread of infectious diseases, which advances the understanding of our case [55, 74]. We found that there were generally more insects and birds, especially mosquitoes, in the green spaces considered diverse in animals, and therefore respondents tended to stay for shorter periods.
In addition, green space safety and recreational facilities are also key factors influencing residents’ green space use behavior and mental health. In terms of safety, uncivilized behavior and insecurity can lead to the rejection of green space and consequently reduce its use [43, 44, 75] and cause anxiety. Our results demonstrated that the green space recreational facilities have a positive association with green space visit frequency and residents’ mental health, consistent with previous studies [39, 40]. Abundant recreational facilities provide more diverse recreational activities and space, creating interaction opportunities among residents of different ages and interests and contributing to neighborhood social cohesion and mental health [55, 76]. Regarding the aesthetics of green spaces, previous studies have shown that aesthetics contribute to promoting quality of life and mental health [77]. However, in this case, when examining a combination of multiple green space accessibility and quality characteristics, the role of aesthetics was weaker and negatively correlated with mental health. Respondents perceived aesthetics of green spaces may be more related to their aesthetic standards and preferences than other green space quality characteristics. The negative association between green space aesthetics and mental health may be explained by these unmeasured social and environmental factors, which influence mental health.
Perceived accessibility of green space was more strongly correlated with green space use behavior. In contrast, green space quality was more strongly correlated with mental health. We found that most dimensions of green space quality were positively correlated with green space use and mental health. Previous studies pointed out that compared with green space availability, quality may be a more critical factor in promoting leisure time physical activity, social cohesion, and restorative experience [78, 79]. Policymakers and managers must evaluate green space quality and maintain high-quality green space regularly to maximize their mental health benefits instead of only considering green space abundance and accessibility.
Also, we found that both residents’ green space visit frequency and duration positively improved mental health and reduced perceived stress, with the former being more significant. Therefore, making people aware of the health benefits of green spaces and encouraging residents to visit green spaces frequently may be a necessary means of promoting residents’ mental health and reducing perceived stress. On the other hand, given the perceived and objective accessibility and different quality characteristics of green spaces that contribute to residents’ green space visit frequency and duration, the potential mediating role of residents’ green space use behavior in the effects of green space on residents’ mental health and perceived stress can be further examined in future studies.
Conclusions
This study investigates the relationship between neighborhood green space, residents’ green space use behavior, and mental health with the use of CCA and a green space and health survey data in Guangzhou, China. The main findings are as follows. The perceived accessibility of neighborhood green space has a stronger association with residents’ green space use behavior and mental health than the objective accessibility. In addition, the safety, recreational facilities, cleanliness, and plant diversity of green spaces play a positive role in promoting residents’ mental health and reducing psychological stress. Compared with green space quality characteristics, the green space perceived accessibility is more related to residents’ green space use behavior. However, some green quality indicators, such as safety and recreational facilities, have greater benefits in improving residents’ mental health than perceived accessibility. These conclusions indicate that land use and transport planning and community design should consider not only where to build new green spaces but also how to improve the subjective perception of accessibility of green spaces among residents. Improvement of the neighborhood walking environment, like improving the safety of sidewalks, the landscape quality and aesthetics of the street, and adding more street trees and shade, may be a potent measure to facilitate more green space visits and thus improve public health. Moreover, the safety of green spaces, the number of recreational facilities, the cleanliness, and the diversity of plants also play a positive role in the mental health of residents. Therefore, the landscape design of green spaces should pay more attention to these key factors, so that the health effect of green spaces can be maximized.
Acknowledgements
This work was supported by the Guangdong Basic and Applied Basic Research Foundation (2022A1515011259), the Innovation Project of Universities in Guangdong Province (2021WTSCX013), the 2021 Annual Planning Project of Philosophy and Social Science of Guangzhou (2021GZGJ210), and the Humanities and Social Sciences Foundation of Ministry of Education of China (21YJC840032). The authors are grateful for the receipt of these funds.
Footnotes
Publisher's Note
Springer Nature remains neutral with regard to jurisdictional claims in published maps and institutional affiliations.
References
- 1.Evans GW. The built environment and mental health. J Urban Health. 2003;80(4):536–555. doi: 10.1093/jurban/jtg063. [DOI] [PMC free article] [PubMed] [Google Scholar]
- 2.Rivera-Segarra E, Mascayano F, Alnasser L, van der Ven E, Martínez-Alés G, Durand-Arias S, Moro MF, Karam E, Hernández-Torres R, Alarcón S, et al. Global mental health research and practice: a decolonial approach. Lancet Psychiatry. 2022;9(7):595–600. doi: 10.1016/S2215-0366(22)00043-8. [DOI] [PubMed] [Google Scholar]
- 3.Diener A, Mudu P. How can vegetation protect us from air pollution? A critical review on green spaces’ mitigation abilities for air-borne particles from a public health perspective - with implications for urban planning. Sci Total Environ. 2021;796:148605. doi: 10.1016/j.scitotenv.2021.148605. [DOI] [PubMed] [Google Scholar]
- 4.Wang C, Ren Z, Dong Y, Zhang P, Guo Y, Wang W, Bao G. Efficient cooling of cities at global scale using urban green space to mitigate urban heat island effects in different climatic regions. Urban For. Urban Green. 2022;74:127635. doi: 10.1016/j.ufug.2022.127635. [DOI] [Google Scholar]
- 5.Castelli KR, Silva AM, Dunning JB. Improving the biodiversity in urban green spaces: a nature based approach. Ecol. Eng. 2021;173:106398. doi: 10.1016/j.ecoleng.2021.106398. [DOI] [Google Scholar]
- 6.Liu Y, Wang R, Grekousis G, Liu Y, Yuan Y, Li Z. Neighbourhood greenness and mental wellbeing in Guangzhou, China: what are the pathways? Landsc. Urban Plan. 2019;190:103602. doi: 10.1016/j.landurbplan.2019.103602. [DOI] [Google Scholar]
- 7.Kaplan S. The restorative benefits of nature: toward an integrative framework. J Environ Psychol. 1995;15(3):169–182. doi: 10.1016/0272-4944(95)90001-2. [DOI] [Google Scholar]
- 8.Zhang R, Zhang C, Rhodes RE. The pathways linking objectively-measured greenspace exposure and mental health: a systematic review of observational studies. Environ. Res. 2021;198:111233. doi: 10.1016/j.envres.2021.111233. [DOI] [PubMed] [Google Scholar]
- 9.Staats H, Gatersleben B, Hartig T. Change in mood as a function of environmental design: arousal and pleasure on a simulated forest hike. J Environ Psychol. 1997;17(4):283–300. doi: 10.1006/jevp.1997.0069. [DOI] [Google Scholar]
- 10.McCormick R. Does access to green space impact the mental well-being of children: a systematic review. J Pediatr Nurs. 2017;37:3–7. doi: 10.1016/j.pedn.2017.08.027. [DOI] [PubMed] [Google Scholar]
- 11.Yao W, Zhang X, Gong Q. The effect of exposure to the natural environment on stress reduction: a meta-analysis. Urban For. Urban Green. 2021;57:126932. doi: 10.1016/j.ufug.2020.126932. [DOI] [Google Scholar]
- 12.Ekkel ED, de Vries S. Nearby green space and human health: evaluating accessibility metrics. Landsc Urban Plan. 2017;157:214–220. doi: 10.1016/j.landurbplan.2016.06.008. [DOI] [Google Scholar]
- 13.Lau KK, Yung CC, Tan Z. Usage and perception of urban green space of older adults in the high-density city of Hong Kong. Urban For. Urban Green. 2021;64:127251. doi: 10.1016/j.ufug.2021.127251. [DOI] [Google Scholar]
- 14.Reyes-Riveros R, Altamirano A, De La Barrera F, Rozas-Vásquez D, Vieli L, Meli P. Linking public urban green spaces and human well-being: a systematic review. Urban For. Urban Green. 2021;61:127105. doi: 10.1016/j.ufug.2021.127105. [DOI] [Google Scholar]
- 15.Yoo E, Roberts JE, Eum Y, Li X, Konty K. Exposure to urban green space may both promote and harm mental health in socially vulnerable neighborhoods: a neighborhood-scale analysis in New York City. Environ. Res. 2022;204:112292. doi: 10.1016/j.envres.2021.112292. [DOI] [PubMed] [Google Scholar]
- 16.Yang W, Yang R, Zhou S. The spatial heterogeneity of urban green space inequity from a perspective of the vulnerable: a case study of Guangzhou. China. Cities. 2022;130:103855. doi: 10.1016/j.cities.2022.103855. [DOI] [Google Scholar]
- 17.Sarkar C, Webster C, Gallacher J. Residential greenness and prevalence of major depressive disorders: a cross-sectional, observational, associational study of 94 879 adult UK Biobank participants. Lancet Planet Health. 2018;2(4):e162–e173. doi: 10.1016/S2542-5196(18)30051-2. [DOI] [PubMed] [Google Scholar]
- 18.Dzhambov AM, Iana M, Terry H, Boris T, Zlatoslav A, Drozdstoj S, Penka G, Dimitrova DD. Multiple pathways link urban green- and bluespace to mental health in young adults. Environ Res. 2018;166:223–233. doi: 10.1016/j.envres.2018.06.004. [DOI] [PubMed] [Google Scholar]
- 19.Houlden V, Porto De Albuquerque J, Weich S, Jarvis S. A spatial analysis of proximate greenspace and mental wellbeing in London. Appl. Geogr. 2019;109:102036. doi: 10.1016/j.apgeog.2019.102036. [DOI] [Google Scholar]
- 20.van den Berg AE, Maas J, Verheij RA, Groenewegen PP. Green space as a buffer between stressful life events and health. Soc. Sci. Med. 2010;70(8):1203–1210. doi: 10.1016/j.socscimed.2010.01.002. [DOI] [PubMed] [Google Scholar]
- 21.Krols J, Aerts R, Vanlessen N, Dewaelheyns V, Dujardin S, Somers B. Residential green space, gardening, and subjective well-being: a cross-sectional study of garden owners in northern Belgium. Landsc. Urban Plan. 2022;223:104414. doi: 10.1016/j.landurbplan.2022.104414. [DOI] [Google Scholar]
- 22.Herrero J, Meneses J. Short Web-based versions of the perceived stress (PSS) and Center for Epidemiological Studies-Depression (CESD) Scales: a comparison to pencil and paper responses among Internet users. Comput Hum Behav. 2006;22(5):830–846. doi: 10.1016/j.chb.2004.03.007. [DOI] [Google Scholar]
- 23.Berwick DM, Murphy JM, Goldman PA, Jr, Ware JE, Barsky AJ, Weinstein MC. Performance of a five-item mental health screening test. Med. Care. 1991;29(2):169–176. doi: 10.1097/00005650-199102000-00008. [DOI] [PubMed] [Google Scholar]
- 24.Zhang YJ, Mavoa S, Zhao JF, Raphael D, Smith M. The association between green space and adolescents’ mental well-being: a systematic review. Int J Environ Res. 2020;17(18):6640. doi: 10.3390/ijerph17186640. [DOI] [PMC free article] [PubMed] [Google Scholar]
- 25.Geneshka M, Coventry P, Cruz J, Gilbody S. Relationship between green and blue spaces with mental and physical health: a systematic review of longitudinal observational studies. Int J Environ Res. 2021;18(17):9010. doi: 10.3390/ijerph18179010. [DOI] [PMC free article] [PubMed] [Google Scholar]
- 26.Sturm R, Cohen D. Proximity to urban parks and mental health. J Ment Health Policy Econ. 2014;17(1):19–24. [PMC free article] [PubMed] [Google Scholar]
- 27.Loder AKF, Schwerdtfeger AR, van Poppel MNM. Perceived greenness at home and at university are independently associated with mental health. BMC Public Health. 2020;20(1):802. doi: 10.1186/s12889-020-8412-7. [DOI] [PMC free article] [PubMed] [Google Scholar]
- 28.Reklaitiene R, Grazuleviciene R, Dedele A, Virviciute D, Vensloviene J, Tamosiunas A, Baceviciene M, Luksiene D, Sapranaviciute-Zabazlajeva L, Radisauskas R, et al. The relationship of green space, depressive symptoms and perceived general health in urban population. Scand J Public Health. 2014;42(7):669–676. doi: 10.1177/1403494814544494. [DOI] [PubMed] [Google Scholar]
- 29.Noordzij JM, Beenackers MA, Groeniger JO, Van Lenthe FJ. Effect of changes in green spaces on mental health in older adults: a fixed effects analysis. J Epidemiol Community Health. 2020;74(1):48–56. doi: 10.1136/jech-2019-212704. [DOI] [PMC free article] [PubMed] [Google Scholar]
- 30.Šiljeg S, Marić I, Nikolić G, Šiljeg A. Accessibility analysis of urban green spaces in the settlement of Zadar in Croatia. Sumar. List. 2018;142(910):487–496. doi: 10.31298/sl.142.9-10.4. [DOI] [Google Scholar]
- 31.Yang M, Dijst M, Faber J, Helbich M. Using structural equation modeling to examine pathways between perceived residential green space and mental health among internal migrants in China. Environ. Res. 2020;183:109121. doi: 10.1016/j.envres.2020.109121. [DOI] [PubMed] [Google Scholar]
- 32.van Dillen SME, De Vries S, Groenewegen PP, Spreeuwenberg P. Greenspace in urban neighbourhoods and residents’ health: adding quality to quantity. J. Epidemiol. Community Health. 2012;66(6):e8. doi: 10.1136/jech.2009.104695. [DOI] [PubMed] [Google Scholar]
- 33.Yakınlar N, Akpınar A. How perceived sensory dimensions of urban green spaces are associated with adults’ perceived restoration, stress, and mental health? Urban For. Urban Green. 2022;72:127572. doi: 10.1016/j.ufug.2022.127572. [DOI] [Google Scholar]
- 34.Sun P, Song Y, Lu W. Effect of urban green space in the hilly environment on physical activity and health outcomes: mediation analysis on multiple greenery measures. Land. 2022;11(5):612. doi: 10.3390/land11050612. [DOI] [Google Scholar]
- 35.Xu J, Wang F, Chen L, Zhang W. Perceived urban green and residents’ health in Beijing. SSM-Popul. Health. 2021;14:100790. doi: 10.1016/j.ssmph.2021.100790. [DOI] [PMC free article] [PubMed] [Google Scholar]
- 36.Huang S, Qi J, Li W, Dong J, van den Bosch CK. The contribution to stress recovery and attention restoration potential of exposure to urban green spaces in low-density residential areas. Int J Environ Res. 2021;18(16):8713. doi: 10.3390/ijerph18168713. [DOI] [PMC free article] [PubMed] [Google Scholar]
- 37.Knobel P, Dadvand P, Alonso L, Costa L, Español M, Maneja R. Development of the urban green space quality assessment tool (RECITAL) Urban For. Urban Green. 2020;57:126895. doi: 10.1016/j.ufug.2020.126895. [DOI] [Google Scholar]
- 38.Wang S, Yung EHK, Sun Y. Effects of open space accessibility and quality on older adults’ visit: planning towards equal right to the city. Cities. 2022;125:103611. doi: 10.1016/j.cities.2022.103611. [DOI] [Google Scholar]
- 39.Edwards N, Hooper P, Trapp GSA, Bull F, Boruff B, Giles-Corti B. Development of a Public Open Space Desktop Auditing Tool (POSDAT): a remote sensing approach. Appl Geogr. 2013;38:22–30. doi: 10.1016/j.apgeog.2012.11.010. [DOI] [Google Scholar]
- 40.Timperio A, Giles-Corti B, Crawford D, Andrianopoulos N, Ball K, Salmon J, Hume C. Features of public open spaces and physical activity among children: findings from the CLAN study. Prev Med. 2008;47(5):514–518. doi: 10.1016/j.ypmed.2008.07.015. [DOI] [PubMed] [Google Scholar]
- 41.Stoltz J, Grahn P. Perceived sensory dimensions: an evidence-based approach to greenspace aesthetics. Urban For. Urban Green. 2021;59:126989. doi: 10.1016/j.ufug.2021.126989. [DOI] [Google Scholar]
- 42.Wang R, Jiang W, Lu T. Landscape characteristics of university campus in relation to aesthetic quality and recreational preference. Urban For. Urban Green. 2021;66:127389. doi: 10.1016/j.ufug.2021.127389. [DOI] [Google Scholar]
- 43.Knapp M, Gustat J, Darensbourg R, Myers L, Johnson C. The relationships between park quality, park usage, and levels of physical activity in low-income, African American neighborhoods. Int J Environ Res. 2018;16(1):85. doi: 10.3390/ijerph16010085. [DOI] [PMC free article] [PubMed] [Google Scholar]
- 44.Lo AYH, Jim RY. Differential community effects on perception and use of urban greenspaces. Cities. 2010;27(6):430–442. doi: 10.1016/j.cities.2010.07.001. [DOI] [Google Scholar]
- 45.Wood E, Harsant A, Dallimer M, Cronin DCA, McEachan R, Hassall C. Not all green space is created equal: biodiversity predicts psychological restorative benefits from urban green space. Front Psychol. 2018;9:2320. doi: 10.3389/fpsyg.2018.02320. [DOI] [PMC free article] [PubMed] [Google Scholar]
- 46.Southon GE, Jorgensen A, Dunnett N, Hoyle H, Evans KL. Perceived species-richness in urban green spaces: cues, accuracy and well-being impacts. Landsc Urban Plan. 2018;172:1–10. doi: 10.1016/j.landurbplan.2017.12.002. [DOI] [Google Scholar]
- 47.Whitehouse S, Varni JW, Seid M, Cooper-Marcus C, Ensberg MJ, Jacobs JR, Mehlenbeck RS. Evaluating a children’s hospital garden environment: utilization and consumer satisfaction. J Environ Psychol. 2001;21(3):301–314. doi: 10.1006/jevp.2001.0224. [DOI] [Google Scholar]
- 48.Wood L, Hooper P, Foster S, Bull F. Public green spaces and positive mental health - investigating the relationship between access, quantity and types of parks and mental wellbeing. Health Place. 2017;48:63–71. doi: 10.1016/j.healthplace.2017.09.002. [DOI] [PubMed] [Google Scholar]
- 49.Khan AZ, Moulaert F, Schreurs J. Understanding spatial quality: a relational epistemology and transdisciplinary perspectives in planning and urban design: JUD Special issue. 2014; 19:393-510
- 50.Knobel P, Dadvand P, Maneja-Zaragoza R. A systematic review of multi-dimensional quality assessment tools for urban green spaces. Health Place. 2019;59:102198. doi: 10.1016/j.healthplace.2019.102198. [DOI] [PubMed] [Google Scholar]
- 51.Liu Q, Luo S, Shen Y, Zhu Z, Yao X, Li Q, Tarin MWK, Zheng J, Zhuo Z. Relationships between students’ demographic characteristics, perceived naturalness and patterns of use associated with campus green space, and self-rated restoration and health. Urban For. Urban Green. 2022;68:127474. doi: 10.1016/j.ufug.2022.127474. [DOI] [Google Scholar]
- 52.Ochodo C, Ndetei DM, Moturi WN, Otieno JO. External Built residential environment characteristics that affect mental health of adults. J Urban Health. 2014;91(5):908–927. doi: 10.1007/s11524-013-9852-5. [DOI] [PMC free article] [PubMed] [Google Scholar]
- 53.Roberts M, Irvine KN, McVittie A. Associations between greenspace and mental health prescription rates in urban areas. Urban For. Urban Green. 2021;64:127301. doi: 10.1016/j.ufug.2021.127301. [DOI] [Google Scholar]
- 54.Abdul Aziz NA, Shian LY, Mokhtar MDM, Raman TL, Saikim FH, Chen W, Nordin NM. Effectiveness of urban green space on undergraduates’ stress relief in tropical city: a field experiment in Kuala Lumpur. Urban For. Urban Green. 2021;63:127236. doi: 10.1016/j.ufug.2021.127236. [DOI] [Google Scholar]
- 55.Ayala-Azcárraga C, Diaz D, Zambrano L. Characteristics of urban parks and their relation to user well-being. Landsc Urban Plan. 2019;189:27–35. doi: 10.1016/j.landurbplan.2019.04.005. [DOI] [Google Scholar]
- 56.Yen H, Chiu H, Huang H. Green and blue physical activity for quality of life: a systematic review and meta-analysis of randomized control trials. Landsc. Urban Plan. 2021;212:104093. doi: 10.1016/j.landurbplan.2021.104093. [DOI] [Google Scholar]
- 57.van den Berg M, van Poppel M, Smith G, Triguero-Mas M, Andrusaityte S, van Kamp I, van Mechelen W, Gidlow C, Gražulevičiene R, Nieuwenhuijsen MJ, et al. Does time spent on visits to green space mediate the associations between the level of residential greenness and mental health? Urban For Urban Green. 2017;25:94–102. doi: 10.1016/j.ufug.2017.04.010. [DOI] [Google Scholar]
- 58.van den Berg M, van Poppel M, van Kamp I, Andrusaityte S, Balseviciene B, Cirach M, Danileviciute A, Ellis N, Hurst G, Masterson D, et al. Visiting green space is associated with mental health and vitality: a cross-sectional study in four european cities. Health Place. 2016;38:8–15. doi: 10.1016/j.healthplace.2016.01.003. [DOI] [PubMed] [Google Scholar]
- 59.van den Berg MM, van Poppel M, van Kamp I, Ruijsbroek A, Triguero-Mas M, Gidlow C, Nieuwenhuijsen MJ, Gražulevičiene R, van Mechelen W, Kruize H, et al. Do physical activity, social cohesion, and loneliness mediate the association between time spent visiting green space and mental health? Environ Behav. 2017;51(2):144–166. doi: 10.1177/0013916517738563. [DOI] [PMC free article] [PubMed] [Google Scholar]
- 60.White MP, Elliott LR, Grellier J, Economou T, Bell S, Bratman GN, Cirach M, Gascon M, Lima ML, Lõhmus M, et al. Associations between green/blue spaces and mental health across 18 countries. Sci Rep. 2021;11(1):8903. doi: 10.1038/s41598-021-87675-0. [DOI] [PMC free article] [PubMed] [Google Scholar]
- 61.Coldwell DF, Evans KL. Visits to urban green-space and the countryside associate with different components of mental well-being and are better predictors than perceived or actual local urbanisation intensity. Landsc Urban Plan. 2018;175:114–122. doi: 10.1016/j.landurbplan.2018.02.007. [DOI] [Google Scholar]
- 62.Maury-Mora M, Gómez-Villarino MT, Varela-Martínez C. Urban green spaces and stress during COVID-19 lockdown: a case study for the city of Madrid. Urban For. Urban Green. 2022;69:127492. doi: 10.1016/j.ufug.2022.127492. [DOI] [PMC free article] [PubMed] [Google Scholar]
- 63.Zhang J, Cui J, Astell-Burt T, Shi W, Peng J, Lei L, Xin X, Zhang J, Feng X, Jiang Y, et al. Weekly green space visit duration is positively associated with favorable health outcomes in people with hypertension: evidence from Shenzhen. China. Environ. Res. 2022;212:113228. doi: 10.1016/j.envres.2022.113228. [DOI] [PubMed] [Google Scholar]
- 64.Veit CT, Ware JE. The structure of psychological distress and well-being in general populations. J Consult Clin Psychol. 1983;51(5):730–742. doi: 10.1037/0022-006X.51.5.730. [DOI] [PubMed] [Google Scholar]
- 65.Hotelling H. Relations between two sets of variates. Biometrika. 1936;28(3/4):321–377. doi: 10.2307/2333955. [DOI] [Google Scholar]
- 66.Chen Y, Xu Z, Byrne J, Xu T, Wang S, Wu J. Can smaller parks limit green gentrification? Insights from Hangzhou. China. Urban For. Urban Green. 2021;59:127009. doi: 10.1016/j.ufug.2021.127009. [DOI] [Google Scholar]
- 67.Borga M. Canonical Correlation a Tutorial. 2001:1–12
- 68.Marubayashi Hidalgo A, Pinheiro Da Silva L, Reis Mota R, Nunes Martins E. Canonical-correlation analysis applied to selection-index methodology in quails. Livest. Sci. 2014;169:35–41. doi: 10.1016/j.livsci.2014.09.021. [DOI] [Google Scholar]
- 69.Zhang J, Tan PY. Demand for parks and perceived accessibility as key determinants of urban park use behavior. Urban For. Urban Green. 2019;44:126420. doi: 10.1016/j.ufug.2019.126420. [DOI] [Google Scholar]
- 70.McCormack GR, Cerin E, Leslie E, Du Toit L, Owen N. Objective versus perceived walking distances to destinations: correspondence and predictive validity. Environ Behav. 2007;40(3):401–425. doi: 10.1177/0013916507300560. [DOI] [Google Scholar]
- 71.Wang D, Brown G, Liu Y. The physical and non-physical factors that influence perceived access to urban parks. Landsc Urban Plan. 2015;133:53–66. doi: 10.1016/j.landurbplan.2014.09.007. [DOI] [Google Scholar]
- 72.Fisher JC, Irvine KN, Bicknell JE, Hayes WM, Davies ZG. Perceived biodiversity, sound, naturalness and safety enhance the restorative quality and wellbeing benefits of green and blue space in a neotropical city. Sci. Total Environ. 2020;755:143095. doi: 10.1016/j.scitotenv.2020.143095. [DOI] [PubMed] [Google Scholar]
- 73.Wang R, Zhao J, Meitner MJ, Hu Y, Xu X. Characteristics of urban green spaces in relation to aesthetic preference and stress recovery. Urban For Urban Green. 2019;41:6–13. doi: 10.1016/j.ufug.2019.03.005. [DOI] [Google Scholar]
- 74.Garza Aguilar JA. Manual de Procedimientos de Control de Fauna Nocina Urbana. Coahuila, México: Universidad Autonoma Agraria Antonio Narro; 2010. [Google Scholar]
- 75.Misiune I, Julian JP, Veteikis D. Pull and push factors for use of urban green spaces and priorities for their ecosystem services: case study of Vilnius. Lithuania. Urban For. Urban Green. 2021;58:126899. doi: 10.1016/j.ufug.2020.126899. [DOI] [Google Scholar]
- 76.Päcke SR, Figueroa Aldunce IM. Distribución, superficie y accesibilidad de las áreas verdes en Santiago de Chile. 2010; 36(109):89-110
- 77.Kothencz G, Kolcsár R, Cabrera-Barona P, Szilassi P. Urban green space perception and its contribution to well-being. Int J Environ Res. 2017;14(7):766. doi: 10.3390/ijerph14070766. [DOI] [PMC free article] [PubMed] [Google Scholar]
- 78.Stessens P, Canters F, Huysmans M, Khan AZ. Urban green space qualities: an integrated approach towards GIS-based assessment reflecting user perception. Land Use Pol. 2020;91:104319. doi: 10.1016/j.landusepol.2019.104319. [DOI] [Google Scholar]
- 79.Annear MJ, Cushman G, Gidlow B. Leisure time physical activity differences among older adults from diverse socioeconomic neighborhoods. Health Place. 2009;15(2):482–490. doi: 10.1016/j.healthplace.2008.09.005. [DOI] [PubMed] [Google Scholar]