

Abstract
Various haematological markers have been shown to be diagnostic and prognostic in oral cancer. This study compares the values of the inflammatory metrics neutrophil/lymphocyte ratio (NLR), platelet/lymphocyte ratio (PLR), ESR and HB in precancerous and cancerous lesions to see if one of them can be utilised to make an early diagnosis of oral squamous cell carcinoma. To compare haematological markers as a diagnostic marker to differentiate healthy individuals, oral potentially malignant disorders from oral squamous cell carcinoma patients. One hundred fifty patients were divided into three groups which includes 50 apparently healthy individuals (group A), 50 individuals with premalignant disorders (group B) and 50 individuals with oral squamous cell carcinoma (OSCC) (group C). The levels of various haematological parameters obtained from 5 ml of intravenous blood was drawn from each subject were compared between these three groups. Using Kruskal Wallis and the Mann Whitney post hoc U test, comparisons between the NLR values were examined. A total of number of 150 individuals were included in the current study. The mean age is 43.3 years out of which 49 (81.6%) were male and 11(18.3%) were female. The mean NLR in group 1, 2 and 3 were 2.16, 3.12 and 3.67 respectively and mean PLR were 91.1, 110.3 and 160.6 respectively. The mean Hb content was 14.8, 13.77 and 12.76 respectively. The mean ESR was 9.65, 17.2 and 27.4 respectively. These parameters can be used as valuable adjuvant in identifying and understanding the nature of disease of both potentially malignant diseases and oral cancer.
Keywords: Oral squamous cell carcinoma, NLR, PLR, Pre-malignant disorders, Prognostic markers
Introduction
Tobacco smoking, chewing and alcohol consumption has been heavily associated with oral potentially malignant disorders which has the potential for malignant transformation. The prevalence of oral sub mucous fibrosis in India varies between 0.03 and 3.2%. A higher occurrence of Leukoplakia, Erythroplakia and cancer are observed in oral sub mucous fibrosis patients and considered as an important risk factor for oral cancer. Prevalence of oral leukoplakia in India varies from 0.2 to 5.2%. According to an Indian study, the prevalence of oral lichen planus ranges between 0.02 and 0.4% [1].
Oral cancer accounts for more than 50% of newly diagnosed cancers in India which is a one of the major public health concerns. Despite advances in diagnosis and treatment modalities, the overall 5-year survival rate of oral cancer is less than 50%. Even treated successfully for oral cancer, the patients have to deal with devastating consequences such as residual defects and adverse effects of radiotherapy and chemotherapy [2].
Potentially malignant disorders and chronic inflammatory state are heavily associated. These conditions result in faster turnover of neutrophils as there are immature myeloid cells of granulocytic or monocytic lineages and are elevated in cancer. These reduce anti-tumor immune activity and help in the progression of cancer cells. Neutrophils are considered to be pro-tumorigenic as they secrete pro-angiogenic substances such as vascular endothelial growth factor, platelet derived growth factor and several others such as cytokines and chemokines. Platelets support tumor growth by increased angiogenesis and increased capillary permeability, thereby causing extravasation of cancer cells [3]. The release of lymphocytes is decreased and tumor growth is increased and metastasis probability. The lymphocyte proliferation shows better prognosis [3, 4].
Elevated inflammatory biomarkers such as increased NLR and PLR are associated with poor prognosis in malignancy, using NLR and PLR along with other inflammatory markers such as elevated Erythrocyte sedimentation rate (ESR) and C-reactive protein (CRP) can be a potential biomarker for stratification of oral malignancy [5]. Some inflammatory markers like ESR and CRP are too common to identify a malignant transformation or a malignant lesion but can be used to rule out a malignancy [6]. It has been shown that oral squamous cell carcinoma patients have decreased hemoglobin and the patients tend to be anemic [7, 8]. Increased NLR values was associated with laryngeal squamous cell carcinoma than precancerous laryngeal lesion and benign laryngeal lesions [9].
Early detection of oral squamous cell carcinoma can improve the survival rate, quality of life, decreased morbidity and mortality. This concept of chronic inflammation, increased NLR, PLR and ESR in cancer patients has laid the ground for the current study. The aim of the study is to compare hematological changes as a diagnostic marker to differentiate healthy individuals, oral potentially malignant disorders from oral squamous cell carcinoma patients
Materials and Methods
A prospective and comparative clinical study was carried out to to compare hematological changes as a prognostic marker to differentiate healthy individuals, oral potentially malignant disorders from oral squamous cell carcinoma patients in a sample of Ninety patients between the age of 18–60 years. 50 apparently healthy individuals (group A), 50 individuals with premalignant disorders (group B) and 50 individuals with Oral squamous cell carcinoma (OSCC) (group C) were included in the study. A written consent was taken from the subjects prior to the treatment. The patients excluded are with past history of any major uncontrolled systemic illness such as liver disease, tuberculosis, diabetes and hypertension. Patients with history of trauma less than 2 months back. Patients with acute illness, infection or pregnancy. Patients undergoing radiotherapy/chemotherapy for treatment of cancer. Patients with history of malignancy other than oral squamous cell carcinoma. Patients with recurrent oral squamous cell carcinoma and terminally ill patients. Group A, B and C patients underwent evaluation of haematological changes (NLR, PLR, Hb, ESR). The neutrophil-to-lymphocyte ratio (NLR) was calculated by dividing the neutrophil count by the lymphocyte count, and PLR was calculated as the number of platelets divided by the lymphocyte count.
Results
The required parameters were recorded in the Department of Oral and Maxillofacial Surgery, KVG Dental College and Hospital by same investigator and the data was analysed statistically using Independent T test for comparison of the two groups, p < 0.05 was considered as level of significance.
The data was checked for normality using Normality tests (Kolmogorov Smirnov and Shapiro Wilk test). (Table 1)The data follows “Normal distribution” (p value > 0.05) for age, neutrophil count and platelets count. Hence parametric tests of significance were applied for comparisons between groups. The data shows “Non- normal distribution” (p < 0.05) for lymphocyte count, N/L, PLR, Hb count and ESR. Hence, non-parametric tests of significance were applied for group comparisons (Table 2). There were 40 males (80%) and 10 females (20%) in group A and B. In group C, there were 42 (83%) males and 8 (17%) females (Table 2).
Table 1.
Normality distribution table
| Tests of normality | |||||||
|---|---|---|---|---|---|---|---|
| Group | Kolmogorov–Smirnova | Shapiro–Wilk | |||||
| Statistic | df | Sig. | Statistic | df | Sig. | ||
| AGE | Group A (Healthy) | .064 | 50 | .200* | .984 | 50 | .974 |
| Group B (Premalignant lesions) | .120 | 50 | .200* | .946 | 50 | .310 | |
| Group C (Oral squamous cell carcinoma) | .146 | 50 | .200* | .937 | 50 | .211 | |
| Neutrophil | Group A (Healthy) | .156 | 50 | .200* | .923 | 50 | .112 |
| Group B (Premalignant lesions) | .112 | 50 | .200* | .971 | 50 | .769 | |
| Group C (OSCC) | .135 | 50 | .200* | .919 | 50 | .094 | |
| Lymphocytes | Group A (Healthy) | .297 | 50 | .000 HS | .590 | 50 | .000 HS |
| Group B (Premalignant lesions) | .148 | 50 | .200* | .949 | 50 | .357 | |
| Group C (Oral squamous cell carcinoma) | .188 | 50 | .063 | .931 | 50 | .164 | |
| N/L | Group A (Healthy) | .137 | 50 | .200* | .960 | 50 | .550 |
| Group B (Premalignant lesions) | .234 | 50 | .005 HS | .770 | 50 | .000 HS | |
| Group C (Oral squamous cell carcinoma) | .112 | 50 | .200* | .964 | 50 | .632 | |
| Platelets | Group A (Healthy) | .106 | 50 | .200* | .970 | 50 | .746 |
| Group B (Premalignant lesions) | .111 | 50 | .200* | .938 | 50 | .221 | |
| Group C (Oral squamous cell carcinoma) | .141 | 50 | .200* | 973 | 50 | .816 | |
| PLR | Group A (Healthy) | .089 | 50 | .200* | .961 | 50 | .570 |
| Group B (Premalignant lesions) | .226 | 50 | .009 HS | .826 | 50 | .002 HS | |
| Group C (Oral squamous cell carcinoma) | .197 | 50 | .040 S | .921 | 50 | .102 | |
| HB | Group A (Healthy) | .120 | 50 | .200* | .973 | 50 | .824 |
| Group B (Premalignant lesions) | .224 | 50 | .010 S | .861 | 50 | .008 HS | |
| Group C (Oral squamous cell carcinoma) | .155 | 50 | .200* | .936 | 50 | .204 | |
| ESR | Group A (Healthy) | .175 | 50 | .110 | .935 | 50 | .191 |
| Group B (Premalignant lesions) | .109 | 50 | .200* | .976 | 50 | .879 | |
| Group C (Oral squamous cell carcinoma) | .161 | 50 | .189 | .900 | 50 | .042 S | |
Statistical test applied: Kolmogorov Smirnov and Shapiro Wilk test
HS highly significant at p < 0.01; S significant at p < 0.05, * significance
Table 2.
Sex distribution
| SEX | Total | ||
|---|---|---|---|
| Male | Female | ||
| Group | |||
| Group A (Healthy) | |||
| Count | 40 | 10 | 50 |
| % | 80.0% | 20.0% | 100.0% |
| Group B (Premalignant lesions) | |||
| Count | 40 | 10 | 50 |
| % | 80.0% | 20.0% | 100.0% |
| Group C (Oral squamous cell carcinoma) | |||
| Count | 42 | 8 | 50 |
| % | 84.0% | 16.0% | 100.0% |
The mean age of group A is 38 ± 10.07; group B is 43.7 ± 15.71 and group C is 48.9 ± 13.39. The mean age was highest for group C and lowest for group A. One Way Anova test detected significant difference between the three groups (p-0.041). Tukey test was applied for pair wise comparisons. Significant difference was observed only between group A and group C (p-0.03) (Tables 3, 4, Fig. 1).
Table 3.
Age comparison
| N | Mean | Std. deviation | F value | Sig. | |
|---|---|---|---|---|---|
| Group A (Healthy) | 50 | 38.0000 | 10.07864 | 3.379 | 0.041 S |
| Group B (Premalignant lesions) | 50 | 43.7000 | 15.71154 | ||
| Group C (Oral squamous cell carcinoma) | 50 | 48.9000 | 13.39246 |
Statistical test applied: one way ANOVA; S significant at p < 0.05
Table 4.
Pair wise comparisons (age)
| (I) group | (J) group | Sig |
|---|---|---|
| Group A (Healthy) | Group B (Premalignant lesions) | .369 |
| Group C (Oral squamous cell carcinoma) | .031 S | |
| Group B (Premalignant lesions) | Group A (Healthy) | .369 |
| Group C (Oral squamous cell carcinoma) | .435 | |
| Group C (Oral squamous cell carcinoma) | Group A (Healthy) | .031 S |
| Group B (Premalignant lesions) | .435 |
Statistical test applied: Tukey test (post hoc); S significant at p < 0.05
Fig. 1.
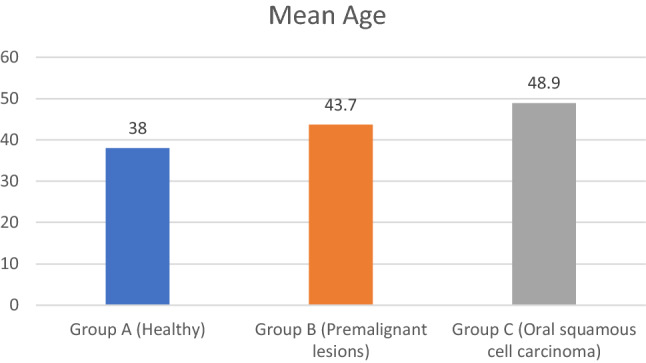
Mean age
The mean Neutrophil count of group A is 61.2 ± 5.56; group B is 65.93 ± 7.02 and Group C is 67.39 ± 8.01. The mean neutrophil count was highest for Group C and lowest for Group A. One Way Anova test detected significant difference between the three groups (p-0.018). Tukey test was applied for pair wise comparisons. Significant difference was observed only between group A and group C (p-0.019) (Tables 5, 6).
Table 5.
Neutrophil count comparison
| N | Mean | Std. deviation | F value | Sig | |
|---|---|---|---|---|---|
| Group A (Healthy) | 50 | 61.2000 | 5.56672 | 4.305 | 0.018 S |
| Group B (Premalignant lesions) | 50 | 65.9300 | 7.02118 | ||
| Group C (Oral squamous cell carcinoma) | 50 | 67.3500 | 8.01495 |
Statistical test applied: one way ANOVA; S significant at p < 0.05
Table 6.
Pair wise comparisons (neutrophil count)
| (I) group | (J) group | Sig |
|---|---|---|
| Group A (Healthy) | Group B (Premalignant lesions) | .088 |
| Group C (Oral squamous cell carcinoma) | .019 S | |
| Group B (Premalignant lesions) | Group A (Healthy) | .088 |
| Group C (Oral squamous cell carcinoma) | .795 | |
| Group C (Oral squamous cell carcinoma) | Group A (Healthy) | .019 S |
| Group B (Premalignant lesions) | .795 |
Statistical test applied: tukey test (post hoc); S significant at p < 0.05
The median lymphocyte count of group A is 27.6, group B is 24.2 and group C is 18.5. The median lymphocyte count was highest for group A and lowest for group C. Kruskal Wallis Anova test detected highly significant difference between the three groups (p-0.000). Mann Whitney U test was applied for pair wise comparisons. Highly significant difference was observed between all groups except between Group B and Group C (p-0.07) (Tables 7, 8). The median N/L count of group A is 2.2, group B is 2.8 and group C is 3.65. The median N/L count was highest for group C and lowest for group A. Kruskal Wallis Anova test detected highly significant difference between the three groups (p-0.000). Mann Whitney U test was applied for pair wise comparisons. Highly significant difference was observed between all groups except between group B and group C (p-0.1) (Tables 9, 10, Fig. 2).
Table 7.
Lymphocyte count comparison
| N | Mean | Std. deviation | Median | Chi square | Sig. | |
|---|---|---|---|---|---|---|
| Group A (Healthy) | 50 | 28.8750 | 4.68029 | 27.6000 | 17.447 | 0.000 HS |
| Group B (Premalignant lesions) | 50 | 23.6250 | 6.19336 | 24.2000 | ||
| Group C (Oral squamous cell carcinoma) | 50 | 20.3500 | 6.08946 | 18.5000 |
Statistical test applied: Kruskal Wallis ANOVA; HS highly significant at p < 0.01
Table 8.
Pair wise comparisons (lymphocyte count)
| (I) group | (J) group | Sig. |
|---|---|---|
| Group A (Healthy) | Group B (Premalignant lesions) | .009 HS |
| Group C (Oral squamous cell carcinoma) | .000 HS | |
| Group B (Premalignant lesions) | Group A (Healthy) | .009 HS |
| Group C (Oral squamous cell carcinoma) | .072 | |
| Group C (Oral squamous cell carcinoma) | Group A (Healthy) | .009 HS |
| Group B (Premalignant lesions) | .072 |
Statistical test applied: Mann Witney test (post hoc); HS highly significant at p < 0.01
Table 9.
NLR comparison
| N | Mean | Std. deviation | Median | Chi square | Sig | |
|---|---|---|---|---|---|---|
| Group A (Healthy) | 50 | 2.1642 | .36794 | 2.2083 | 16.211 | 0.000 HS |
| Group B (Premalignant lesions) | 50 | 3.1290 | 1.46904 | 2.8016 | ||
| Group C (Oral squamous cell carcinoma) | 50 | 3.6758 | 1.38391 | 3.6579 |
Statistical test applied: Kruskal Wallis ANOVA; HS highly significant at p < 0.01
Table 10.
Pair wise comparison (NLR comparison)
| (I) group | (J) group | Sig. |
|---|---|---|
| Group A (Healthy) | Group B (Premalignant lesions) | 0.005 HS |
| Group C (Oral squamous cell carcinoma) | 0.000 HS | |
| Group B (Premalignant lesions) | Group A (Healthy) | 0.005 HS |
| Group C (Oral squamous cell carcinoma) | 0.102 | |
| Group C (Oral squamous cell carcinoma) | Group A (Healthy) | 0.000 HS |
| Group B (Premalignant lesions) | 0.102 |
Statistical test applied: Mann Witney test (post hoc); HS highly significant at p < 0.01
Fig. 2.
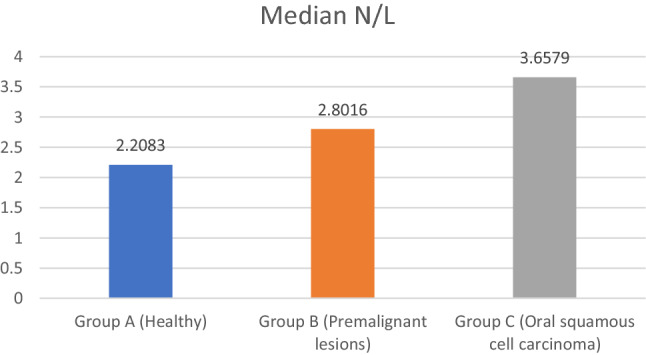
Median nuetrophil lymphocytes ratio
The mean platelets count of group A is 258.7 ± 65.3; group B is 233.7 ± 54.7 and group C is 307.1 ± 108.7. The mean platelets count was highest for group C and lowest for group B. One Way Anova test detected significant difference between the three groups (p-0.017). Tukey test was applied for pair wise comparisons. Significant difference was observed only between group B and group C (p-0.014) (Tables 11, 12).
Table 11.
Platelets count comparison
| N | Mean | Std. deviation | F value | Sig. | |
|---|---|---|---|---|---|
| Group A (Healthy) | 50 | 258.7000 | 65.35498 | 4.375 | 0.017 S |
| Group B (Premalignant lesions) | 50 | 233.7000 | 54.78100 | ||
| Group C (Oral squamous cell carcinoma) | 50 | 307.1000 | 108.73478 |
Statistical test applied: One Way ANOVA; S significant at p < 0.05
Table 12.
Pair wise comparisons (platelets count)
| (I) group | (J) group | Sig. |
|---|---|---|
| Group A (Healthy) | Group B (Premalignant lesions) | .586 |
| Group C (Oral squamous cell carcinoma) | .143 | |
| Group B (Premalignant lesions) | Group A (Healthy) | .586 |
| Group C (Oral squamous cell carcinoma) | .014 S | |
| Group C (Oral squamous cell carcinoma) | Group A (Healthy) | .143 |
| Group B (Premalignant lesions) | .014 S |
Statistical test applied: Tukey test (post hoc); S significant at p < 0.05
The median PLR of group A is 90.7, group B is 99.0 and group C is 162.8. The median P/L count was highest for group C and lowest for group A. Kruskal Wallis Anova test detected highly significant difference between the three groups (p-0.001). Mann Whitney U test was applied for pair wise comparisons. Highly significant difference was observed between all groups except between group A and group B (p-0.383) (Tables 13, 14, Fig. 3).
Table 13.
PLR comparison
| N | Mean | Std. deviation | Median | Chi square | Sig. | |
|---|---|---|---|---|---|---|
| Group A (Healthy) | 50 | 91.138 | 25.1647 | 90.761 | 0.797 | 0.001 HS |
| Group B (Premalignant lesions) | 50 | 110.355 | 55.6098 | 99.013 | ||
| Group C (Oral squamous cell carcinoma) | 50 | 160.651 | 73.3608 | 162.897 |
Statistical test applied: Kruskal Wallis ANOVA; HS highly significant at p < 0.01
Table 14.
Pair wise comparison (PLR comparison)
| (I) group | (J) group | Sig |
|---|---|---|
| Group A (Healthy) | Group B (Premalignant lesions) | 0.383 |
| Group C (Oral squamous cell carcinoma) | 0.000 HS | |
| Group B (Premalignant lesions) | Group A (Healthy) | 0.383 |
| Group C (Oral squamous cell carcinoma) | 0.01 S | |
| Group C (Oral squamous cell carcinoma) | Group A (Healthy) | 0.000 HS |
| Group B (Premalignant lesions) | 0.01 S |
Statistical test applied: Mann Witney test (pos hoc); HS Highly significant at p < 0.01; S Significant at p < 0.05
Fig. 3.
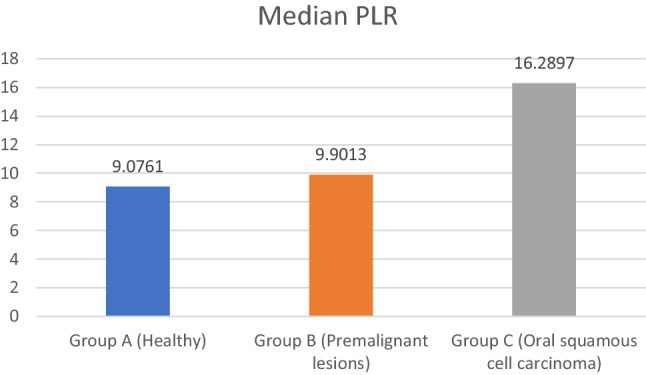
Median platelet lymphocyte ratio
The median Hb of group A is 14.4, group B is 14.8 and group C is 12.6. The median Hb count was highest for group A and lowest for group C. Kruskal Wallis Anova test detected no significant difference between the three groups (p-0.057). (Table 15, Fig. 4).
Table 15.
Hb comparison
| N | Mean | Std. deviation | Median | Chi square | Sig. | |
|---|---|---|---|---|---|---|
| Group A (Healthy) | 50 | 14.8050 | 1.85798 | 14.4000 | 5.723 | 0.057 |
| Group B (Premalignant lesions) | 50 | 13.7000 | 2.19017 | 14.8000 | ||
| Group C (Oral squamous cell carcinoma) | 50 | 12.7600 | 2.39943 | 12.6000 |
Statistical test applied: Kruskal Wallis ANOVA
Fig. 4.
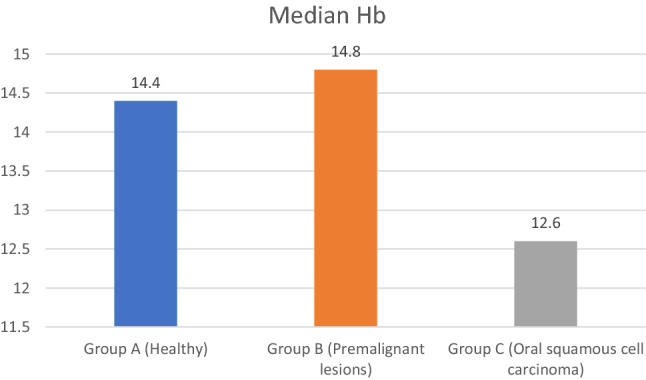
Median heamoglobulin
The median ESR of group A is 10, group B is 17 and group C is 21.5. The median ESR was highest for group C and lowest for group A. Kruskal Wallis Anova test detected highly significant difference between the three groups (p-0.004). Mann Whitney U test was applied for pair wise comparisons. Highly significant difference was observed between all groups except between group B and group C (p-0.383) (Tables 16, 17, Fig. 5).
Table 16.
ESR comparison
| N | Mean | Std. deviation | Median | Chi square | Sig. | |
|---|---|---|---|---|---|---|
| Group A (Healthy) | 50 | 9.6500 | 5.58452 | 10.0000 | 10.918 | 0.004 HS |
| Group B (Premalignant lesions) | 50 | 17.2000 | 7.81766 | 17.0000 | ||
| Group C (Oral squamous cell carcinoma) | 50 | 27.4000 | 22.32157 | 21.5000 |
Statistical test applied: Kruskal Wallis ANOVA; HS highly significant at p < 0.01
Table 17.
Pair wise comparison (ESR)
| (I) group | (J) group | Sig. |
|---|---|---|
| Group A (Healthy) | Group B (Premalignant lesions) | 0.002 HS |
| Group C (Oral squamous cell carcinoma) | 0.009 HS | |
| Group B (Premalignant lesions) | Group A (Healthy) | 0.002 HS |
| Group C (Oral squamous cell carcinoma) | 0.383 | |
| Group C (Oral squamous cell carcinoma) | Group A (Healthy) | 0.009 HS |
| Group B (Premalignant lesions) | 0.383 |
Statistical test applied: Mann Witney test (pos hoc); HS highly significant at p < 0.01; S significant at p < 0.05
Fig. 5.

Median erythrocyte sedimentation rate
Discussion
NLR and PLR can vary in many conditions and their value can be used in monitoring as a biomarker in diabetes, cancers, obesity, metabolic syndromes, cardiovascular disease, renal failure, any chronic malnutrition states, cerebrovascular disease, Alzheimer's, COPD and even psychiatric conditions like delirium, among others [10]. Subjects in the control group (group A) were chosen in such a way that circumstances linked with changes in haematological parameters were excluded from the investigation. The goal was to ensure that no other factor influenced haematological parameters in controls.
The mean age in group A, group B and group C was 38 ± 10.0, 43.7 ± 15.2 and 48.9 ± 13.3 respectively. Gender distribution was 80% male and 20% female, 80% male and 20% female and 83% male and 17% female in group 1, 2 and 3 respectively.
The mean age of the individuals in our study was found to be the greatest in the oral cancer group (48.9 ± 13.3 years) and the lowest in the control group (38 ± 10 years). There was significant difference in the mean age of the potentially malignant diseases group (group B) and the oral cancer group (group C), with Group B having a mean age of 43.7 ± 15.2 years. This finding is consistent with the findings of Chen et al. [11] and Kaja et al. [12], who discovered a rise in the incidence of potentially malignant illnesses in the middle age group with the mean age of 47.2 and less than 50 years, respectively. Our findings are similarly consistent with Huang et al.'s findings, which found a median age of 52.4 years in participants with oral cancer [13].
The mean NLR was 2.16 ± 0.4, 3.12 ± 1.4 and 3.67 ± 1.3 in group A, B and C respectively. The mean NLR was highest in patients with OSCC and least with healthy individuals with statistically significant difference in all three groups. Duzlu et al. [14] investigated NLR as a diagnostic marker in 95 patients with oral cavity cancer. With a threshold value of 2.88, he discovered that NLR were elevated in cases of oral malignancies. In a study of 100 instances of oral cancer, Phulari et al. [15] discovered a high NLR in oral cavity malignancies and got a cut off value of 2.84.
In a study by Singh et al. the cut-off NLR value for differentiating between control and disease conditions was 2.33, which was similar with earlier studies [16]. The cut-off NLR value was 3.20 between premalignant and malignant conditions. In our investigation, the cut-off NLR value for differentiating between control and disease conditions was 2.16, which was similar with earlier studies [17]. 3.67 was the cut-off NLR value between premalignant and malignant conditions. Kum et al. discovered that the NLR was higher in squamous cell carcinoma of the larynx than in benign and precancerous laryngeal lesions [9]. When compared to our study, our findings are comparable.
The mean PLR was 91.1 ± 25.1, 110.3 ± 55.6 and 160.6 ± 73.3 in group A, B and C respectively.The mean PLR was highest in patients with OSCC and least with healthy individuals which was with statistically significant difference in all three groups. The cut-off thresholds for NLR and PLR used in various studies ranged from 2.0 to 4.2 (NLR: 2.0 to 4.2, PLR: 105.3–170).
The threshold value for PLR and NLR in our investigation was 110.3 for PLR and 3.12 for NLR, as calculated by the statistical method provided. In a study of 98 individuals, Bulgurcu et al. [18] discovered that NLR and PLR levels were considerably greater in LSCC patients compared to premalignant laryngeal lesions. Kemal et al. evaluated NLR and PLR rates in small-cell lung cancer patients and healthy people, concluding that lung cancer patients had considerably higher rates [19]. Preoperative NLR and PLR levels were substantially associated with cancer development and survival, according to Hsueh et al. These haematological markers might be used as independent predictive values for OSCC patients [20].
The mean HB value in group A, B and C was 14.80 ± 1.85, 13.7 ± 2.19 and 12.76 ± 2.39 respectively. The mean ESR value in group A, B and C was 9.65 ± 5.58, 17.2 ± 7.8 and 27.4 ± 22.32 respectively. The mean ESR was highest in patients with OSCC and least with healthy individuals which was statistically significant difference in all three groups and there was no significant difference between the three groups in terms of Hb content.
Karthik et al. [21] and Narang et al. [22] both found a substantial drop in Hb and RBC as well as an increase in WBC and ESR, in patients with OSMF, which is consistent with findings of this current study. Iron deficiency anaemia in OSMF patients might be linked to the disease's precancerous character. Ramesh et al. [23] found that the mean ESR in potentially malignant disorders was 20 and in healthy controls was 6.5. The results were similar to the current study.
When the mean NLR, PLR, ESR and HB values of different degrees of oral epithelial dysplasia, clinical stages and histological grades of Oral Squamous Cell Carcinoma and potentially malignant disorders were compared, they were found to be nonsignificant except NLR and PLR values in group B between moderate and severe dysplasia. The findings of current study were similar to the study conducted by Singh et al. [16]. Mahalaxmi et al. [24] evaluated NLR levels among different grades of Oral Cancers and found that NLR values increased with increasing Carcinoma grade, however the results were statistically insignificant.
We discovered that NLR, PLR and ESR is greatly raised in both potentially malignant diseases and oral cancer throughout the course of this current research. Various investigations comparing NLR, PLR and ESR levels in oral cancer and PMDs separately have been undertaken. Few studies have compared the values side by side, as this one has.
The current study is a prospective study with a small number of patients, particularly those with invasive OSCC. As a result, these findings must be regarded with caution. Furthermore, the aetiologies of OSCC occurrences were not documented or examined, which might have obscured the influence of these variables on our patient’s inflammatory features. Finally, other inflammatory indicators such as CRP, Procalcitonin and systemic inflammatory index markers may have supplied further data for the assessment of our hypothesis however these markers were not assessed.
Conclusion
The current study discovered that elevated NLR, PLR and ESR levels are found in both potentially malignant disorders and oral squamous cell carcinoma. These values are ready available and less expensive. The current study also found that there was significant difference in values of NLR, PLR and ESR between healthy individuals, potentially malignant disorders and oral squamous cell carcinoma. Although these parameters are too common to identify a disease, they can be used to rule out a malignancy in suspected individuals or to know the aggressiveness of the particular lesion.
Acknowledgements
Nil.
Author Contributions
All the authors participated in concept and study design, participated in collection of data and wrote the manuscript. All authors read and the approved the manuscript.
Funding
Nil.
Declarations
Conflict of interest
The authors declare that they have no conflict of interest.
Ethical Approval
Accepted in presented form (KVGDCH institutional ethical committee, Ref. No -IECKVGDCH/SS28/2020–21.).
Footnotes
Publisher's Note
Springer Nature remains neutral with regard to jurisdictional claims in published maps and institutional affiliations.
References
- 1.Saraswathi TR, Ranganathan K, Shanmugam S, Sowmya R, Narasimhan PD, Gunaseelan R. Prevalence of oral lesions in relation to habits: cross-sectional study in South India. Indian J Dent Res. 2006;17(3):121. doi: 10.4103/0970-9290.29877. [DOI] [PubMed] [Google Scholar]
- 2.Warnakulasuriya S. Global epidemiology of oral and oropharyngeal cancer. Oral Oncol. 2009;45(4–5):309–316. doi: 10.1016/j.oraloncology.2008.06.002. [DOI] [PubMed] [Google Scholar]
- 3.Baba Y, Kato Y. Neutrophil to lymphocyte ratio as biomarkers in head and neck squamous cell carcinoma. Biomark J. 2018;4(3):14. doi: 10.21767/2472-1646.100052. [DOI] [Google Scholar]
- 4.Pergialiotis V, Oikonomou M, Damaskou V, Kalantzis D, Chrelias C, Tsantes AE, et al. Platelet to lymphocyte and neutrophil to lymphocyte ratio as predictive indices of endometrial carcinoma: Findings from a retrospective series of patients and meta-analysis. J Gynecol Obstet Hum Reprod. 2018;47(10):511–516. doi: 10.1016/j.jogoh.2018.08.016. [DOI] [PubMed] [Google Scholar]
- 5.Fang HY, Huang XY, Chien HT, Chang JT, Liao CT, Huang JJ, et al. Refining the role of preoperative C-reactive protein by neutrophil/lymphocyte ratio in oral cavity squamous cell carcinoma. Laryngoscope. 2013;123(11):2690–2699. doi: 10.1002/lary.24105. [DOI] [PubMed] [Google Scholar]
- 6.Menke JM, Ahsan MS, Khoo SP. More accurate oral cancer screening with fewer salivary biomarkers. Biomark Cancer. 2017;9:1179299X17732007. doi: 10.1177/1179299X17732007. [DOI] [PMC free article] [PubMed] [Google Scholar]
- 7.Cordella C, Luebbers HT, Rivelli V, Grätz KW, Kruse AL. An evaluation of the preoperative hemoglobin level as a prognostic factor for oral squamous cell carcinoma. Head Neck Oncol. 2011;3(1):35. doi: 10.1186/1758-3284-3-35. [DOI] [PMC free article] [PubMed] [Google Scholar]
- 8.Guo SS, Tang LQ, Chen QY, Zhang L, Liu LT, Huang PY, et al. Is hemoglobin level in patients with nasopharyngeal carcinoma still a significant prognostic factor in the era of intensity-modulated radiotherapy technology? PLoS ONE. 2015;10(8):e0136033. doi: 10.1371/journal.pone.0136033. [DOI] [PMC free article] [PubMed] [Google Scholar]
- 9.Kum RO, Ozcan M, Baklaci D, Kum NY, Yilmaz YF, Gungor V, et al. Elevated neutrophil- to-lymphocyte ratio in squamous cell carcinoma of larynx compared to benign and precancerous laryngeal lesions. Asian Pac J Cancer Prev. 2014;15(17):7351–7355. doi: 10.7314/APJCP.2014.15.17.7351. [DOI] [PubMed] [Google Scholar]
- 10.Ramesh S, Govindaraju P, Pachipalusu B. Evaluation of serum lipid profile and complete hemogram in patients with oral submucous fibrosis: a case control study. J Int Oral Health. 2020;12(5):427. doi: 10.4103/jioh.jioh_308_19. [DOI] [Google Scholar]
- 11.Singh S, Singh J, Ganguly R, Chandra S, Samadi FM, Suhail S. Diagnostic efficacy of neutrophil to lymphocyte ratio (NLR) in oral potentially malignant disorders and oral cancer. Indian J Pathol Microbiol. 2021;64(2):243–249. doi: 10.4103/IJPM.IJPM_114_20. [DOI] [PubMed] [Google Scholar]
- 12.Bedel C, Selvi F. Association of platelet to lymphocyte and neutrophil to lymphocyte ratios with in-hospital mortality in patients with type A acute aortic dissection. Braz J Cardiovasc Surg. 2019;34:694–698. doi: 10.21470/1678-9741-2018-0343. [DOI] [PMC free article] [PubMed] [Google Scholar]
- 13.Chen HH, Chen IH, Liao CT, Wei FC, Lee LY, Huang SF. Preoperative circulating C-reactive protein levels predict pathological aggressiveness in oral squamous cell carcinoma: a retrospective clinical study. Clin Otolaryngol. 2011;36(2):147–153. doi: 10.1111/j.1749-4486.2011.02274.x. [DOI] [PubMed] [Google Scholar]
- 14.Kaja S, Naga SK, Kumar KK, Dasari N, Kantheti LP, Reddy BV. Quantitative analysis of C-reactive protein in potentially malignant disorders: a pilot study. J Orofac Sci. 2015;7(1):3. doi: 10.4103/0975-8844.157355. [DOI] [Google Scholar]
- 15.Huang SF, Wei FC, Liao CT, Wang HM, Lin CY, Lo S, et al. Risk stratification in oral cavity squamous cell carcinoma by preoperative CRP and SCC antigen levels. Ann Surg Oncol. 2012;19(12):3856–3864. doi: 10.1245/s10434-012-2392-5. [DOI] [PubMed] [Google Scholar]
- 16.Düzlü ME, Karamert R, Tutar HA, Şahin M, Türkcan A, Yılmaz M. Diagnostic role of neutrophil-lymphocyte ratio in oral cavity cancers. Niger J Clin Pract. 2018;21(1):49–53. doi: 10.4103/1119-3077.224796. [DOI] [PubMed] [Google Scholar]
- 17.Phulari RG, Rathore RS, Shah AK, Agnani SS. Neutrophil: lymphocyte ratio and oral squamous cell carcinoma: a preliminary study. J Oral Maxillofac Pathol JOMFP. 2019;23(1):78. doi: 10.4103/jomfp.JOMFP_160_17. [DOI] [PMC free article] [PubMed] [Google Scholar]
- 18.Takenaka Y, Oya R, Kitamiura T, Ashida N, Shimizu K, Takemura K, et al. Prognostic role of neutrophil-to lymphocyte ratio in head and neck cancer: a meta analysis. Head Neck. 2018;40:647–655. doi: 10.1002/hed.24986. [DOI] [PubMed] [Google Scholar]
- 19.Bulgurcu S, Arslan İB, Dikilitaş B, Çukurova İ. Neutrophil to lymphocyte ratio and platelet to lymphocyte ratio in malignant and precancerous laryngeal lesions. Kulak BurunBogazIhtisDerg. 2017;27(3):122–127. [Google Scholar]
- 20.Kemal Y, Yucel I, Ekiz K, Demirag G, Yilmaz B, Teker F, et al. Elevated serum neutrophil to lymphocyte and platelet to lymphocyte ratios could be useful in lung cancer diagnosis. Asian Pac J Cancer Prev. 2014;15(6):2651–2654. doi: 10.7314/APJCP.2014.15.6.2651. [DOI] [PubMed] [Google Scholar]
- 21.Hsueh C, Tao L, Zhang M, Cao W, Gong H, Zhou J, et al. The prognostic value of preoperative neutrophils, platelets, lymphocytes, monocytes and calculated ratios in patients with laryngeal squamous cell cancer. Oncotarget. 2017;8(36):60514. doi: 10.18632/oncotarget.16234. [DOI] [PMC free article] [PubMed] [Google Scholar]
- 22.Karthik H, Nair P, Gharote HP, Agarwal K, Ramamurthy Bhat G, Kalyanpur RD. Role of hemoglobin and serum iron in oral submucous fibrosis: a clinical study. Sci World J. 2012;2012:254013. doi: 10.1100/2012/254013. [DOI] [PMC free article] [PubMed] [Google Scholar]
- 23.Narang D, Shishodiya S, Sur J, Khan NF. White blood cells count: as a pathological diagnostic marker for oral pre-cancerous lesions and conditions: a randomized blind trial. J Carcinog Mutagen. 2014;5:188. doi: 10.4172/2157-2518.1000188. [DOI] [Google Scholar]
- 24.Mahalakshmi R, Boaz K, Srikant N, Baliga M, Shetty P, Prasad M, et al. Neutrophil to lymphocyte ratio: a surrogate marker for prognosis of oral squamous cell carcinoma. Indian J Med Paediatr Oncol. 2018;39:8–12. doi: 10.4103/ijmpo.ijmpo_2_16. [DOI] [Google Scholar]