

Graphical abstract

Keywords: Paper, Cellulose, Synthesis, Copper, Silver, Bimetallic nanoparticles, Composite, Ultrasound, Sonochemistry
Highlights
-
•
Sonication improves the absorption of metallic salt in the paper.
-
•
Ultrasound catalyzes the synthesis of metallic nanoparticles.
-
•
A longer sonication time during salt absorption increases the number of nanoparticles obtained.
-
•
Nanoparticles obtained by sonochemistry are an easy and reproducible method to modify paper.
Abstract
This work focuses on a systematic method to produce Ag, Cu, and Ag/Cu metallic nanoparticles (MNPs) in situ assisted with ultrasound on cellulose paper. By tuning the concentration of AgNO3 and CuSO4 salt precursors and ultrasound time, combined with a fixed concentration of ascorbic acid (AA) as a reducing agent, it was possible to control the size, morphology, and polydispersity of the resulting MNPs on cellulose papers. Notably, high yield and low polydispersity of MNPs and bimetallic nanoparticles are achieved by increasing the sonication time on paper samples pre-treated with salt precursors before reduction with AA. Moreover, mechanical analysis on paper samples presenting well-dispersed and distributed MNPs showed slightly decreasing values of Young's modulus compared to neat papers. The strain at break is substantially improved in papers containing solely Ag or Cu MNPs. The latter suggests that the elastic/plastic transition and deformation of papers are tuned by cellulose and MNPs interfacial interaction, as indicated by mechanical analysis. The proposed method provides insights into each factor affecting the sonochemistry in situ synthesis of MNPs on cellulose papers. In addition, it offers a straightforward alternative to scale up the production of MNPs on paper, ensuring an eco-friendly method.
1. Introduction
Metallic nanoparticles (MNPs) are attractive in different scientific areas such as environmental remediation [1], biomedical application [2], food packaging [3], electrocatalysis [4], [5] energy storage, and conversion [6], to name a few. In many applications, MNPs have shown outstanding performance due to their area/volume ratio, drastically increasing the number of atoms on the surface compared to volume. Consequently, they give a more reactive surface than similar structures at the macroscopic scale [7], [8]. Silver (AgNPs) and copper (CuNPs) nanoparticles or bimetallic nanoparticles Ag/Cu (Ag/CuNPs) stand out for their antimicrobial capacity against viruses [9], [10], bacteria [11], [12], [13], and fungi [14]. Nevertheless, the relatively expensive commercial value of silver and the spontaneous oxidation of copper have limited their broad application at the industrial scale [15], [16]. To solve the problem, the simultaneous synthesis of Ag/CuNPs has become an alternative to maximize their intrinsic properties and diminish the market price [5], [6], [7], [8], [9], [10], [11], [12], [13], [14], [15], [16], [17], [18].
The performance of AgNPs, CuNPs, and Ag/CuNPs is directly connected to the chemical route used for synthesis [19], [20], [21], [22]. The most common methods are based on hydrothermal [23], [24], [25], coprecipitation [26], electrochemical [27], [28], [29], laser ablation [30], [31], [32], microwave assistance [33], [34], [35] and sonochemistry [19], [36], [37], [38]. Compared to the above methods, sonochemistry is a method in favor of the principles of green chemistry which allows the use of water as a nontoxic solvent and can be used for a wide variety of MNPs syntheses. The sonochemistry method allows a decrease in reaction time as well as tuning of selectivity, reactivity, and catalytic activity [39]. The sonochemical synthesis allows for obtaining different amorphous [36] or crystalline MNPs [37]. MNPs present shapes like spheres [19], [38], nanowires [36], or core–shell morphologies [40]. Those morphologies can be tuned by the local heating phenomena and high in situ pressure during the acoustic cavitation process [41]. This involves the formation and implosive collapsing of bubbles in solution, followed by a fast-cooling rate close to 1010 K s−14 [41]. Therefore, the ultrasound route could be considered a versatile and easy method to obtain desirable nanostructures [42]. Sonochemical techniques also diminish MNP agglomeration, improving their dispersion and distribution in different substrates [43]. In fact, this synthetic route could be performed on different supporting matrices such as electrode surfaces [44], [45], carbon nanotubes [46], [47], graphene or graphene oxide [48], [49], biological matrices [11], [50], [51] and cellulose [50], [52]. Cellulose paper is an exciting substrate composed of hydrocarbon fibers. Once dispersed in a solvent, its compression and drying render it to form thin and porous layer structures with many applications [53]. Currently, some applications of the paper include (i) hygienic activities, (ii) drawing or artistic development, (iii) packaging, (iv) laboratory filters [53] and (v) stimuli response to highly specialized materials [54]. The functionalization of cellulose paper with AgNPs and CuNPs has allowed its use in new applications such as photocatalyst [55], bactericide membranes in medicine [56], high-performance textiles [57], conducting paper for electronics [58], antibacterial and anticorrosion films [59], membranes for water treatment [60], antibacterial activity [61], and food packaging [62], among others.
Different research has modified cellulose surfaces by wet impregnating previously synthesized and in situ MNPs, thus taking advantage of cellulose wetting and porosity in water [63], [64], [65], [66], [67]. As a general procedure, cellulose paper is immersed in the metal salt solution. Then the MNPs are formed by adding some reducing agents. Notably, the in situ synthesis optimizes the rate of MNPs formation. However, it showed poor control of morphology and polydispersity of the resulting NPs on the cellulose fibers [63], [64], [65], [66], [67]. For instance, He et al. used paper as a substrate for generating MNPs using AgNO3 as a precursor and NaBH4 as a reducing agent. The resulting AgNPs showed a size of 4.4 ± 0.2 nm using 1 mM AgNO3 but increased to 7.9 ± 2.4 nm when the concentration was increased to 100 mM AgNO3 [68]. Biliuta et al. generated AgNPs on paper using the same precursor and reducing agent. The results showed AgNPs with diameters of 8.8 ± 4.8 nm and 8.4 ± 2.9 nm when using 1 and 100 mM of AgNO3, respectively [60]. Similar results can be found in another example [69]. Also, CuNPs have been obtained on cellulose fibers using CuSO4 as a precursor and ascorbic acid (AA) as a reducing agent [70]. In that work, CuNPs presented high aggregation with clusters ranging from 100 to 600 nm due to the weak reducing effect of AA.
On the other hand, the main drawback of the above synthetic route is the toxicity of the reducing agents, which renders non-eco-friendly alternatives to the in situ synthesis of MNPs in cellulose fibers [68], [60]. Alternatively, and to enhance the control of the environmentally friendly nanoparticle formation process, other authors have explored the pulsed laser deposition technic in a vacuum chamber [52] to anchor Cu and Ag nanoparticles to cellulose paper (previously modified with chitosan) [52]. Despite the modified paper’s optimal electric conductivity, the resulting MNPs did not present homogeneous size distributions, thus hindering its application.
Accordingly, the state-of-the-art revealed the necessity for more systematic studies for synthesizing AgNPs, CuNPs, and Ag/CuNPs on cellulose paper. It requires a deeper understanding of the mechanisms involved during the reduction and nucleation of metal ions to obtain MNPs but using an eco-friendly chemical route. Therefore, the present work focuses on synthesizing AgNPs, CuNPs, and Ag/CuNPs by tuning the concentration of salt precursors (AgNO3 and CuSO4) and AA as a weak reducing agent. Moreover, previously adsorbed metal ions in cellulose papers were subjected to different ultrasound times before metal reduction with AA. The latter allowed elucidation of the impact of the availability of salt precursors on the size, morphology, polydispersity, and distribution of MNPs in cellulose papers. It provided accurate insights about each factor affecting the synthetic in situ process of MNPs formation during sonication. Overall, the industrial scale by which these materials can be produced offers an eco-friendly and scalable method for MNPs synthesis using cellulose fibers as a substrate, which is suitable for generating nanocomposite papers.
2. Materials and methods
2.1. Materials
In this study, Whatman qualitative filter paper (Diameter 11 cm) CL-518 with a grammage of 140 g m−2 (Paper 1) and filter paper #1 M&N with less grammage of 61 g m−2 (Paper 2) were used as a substrate for the sonochemical synthesis of MNPs. AgNO3, CuSO4*5H2O, AA, ethanol p.a., distilled water, and NaOH are analytical grades purchased from Winkler and used as received to prepare the starting solutions for sonochemistry.
2.2. In situ synthesis of metal nanoparticles (MNPs)
The MNPs were synthesized on paper samples as stabilizing agents using metallic salts as precursor agents and AA as a reducing agent through ultrasound-assisted reduction chemistry. Papers 1 and 2 were divided into four equal parts with 23.74 cm2. Samples were named according to the formulation: p-AgNO3, p-CuSO4, and p-AgNO3/CuSO4 in the case of samples sonicated without AA and p-AgNP, p-CuNP and p-Ag/CuNP in the case of samples sonicated in the presence of AA.
The experiments were done in two stages as follows:
Stage 1 – Absorption of metallic salts on papers. In a standard recipe, paper samples were immersed in a beaker containing 100 mL [0.005 M] of each metallic salt or 50 mL [0.005 M of each salt into the mixing for both salts]. The samples were homogenized in the ultrasonic bath at 25 °C for 15 min (Isolab Laborgerate GMBH at 40 KHz). In the case of p-CuSO4, the metallic salt solution contained NaOH [0.005 M] to form a copper hydroxide species [19]. A non-sonicated sample for each system was kept as a control. After sonication, the paper samples were immersed in a beaker containing ethanol for 5 min. It was followed by a three times extra washing process with distilled water to ensure the remotion of non-absorbed metal ions in the papers.
Stage 2- Reduction of metallic salts on paper. From the previous stage, three paper samples were immersed in a beaker containing 100 mL of AA [0.05 M] and sonicated at 25 °C for 15 min. A non-sonicated sample was kept as a control. After that, the paper samples were washed with distilled water three times to remove non-absorbed components and dried in an oven at 50 °C for 30 min.
Three modifications in the synthesis were studied. The first modification corresponds to changes in the metallic salt concentration from 0.005 M to 0.0025 M and 0.00125 M. The second modification corresponds to changes in sonication time from 15-, 20-, 30-, and 60-min during Stage 1. The third modification was related to the type of paper, thus using two types of qualitative filter papers: CL-518 and #1 M&N.
2.3. Characterization of MNP-paper samples
The samples were characterized using High-Resolution Scanning Electron Microscope, HR-SEM (FEI, INSPECT‐F50), provided with Energy Dispersive Spectroscopy (EDS). The analysis of images was performed by using ImageJ software to obtain the particle distribution. Histograms of MNPs diameters were obtained for a population of at least 100 nanoparticles. The clusters were measured the same way as the particles. However, <100 particles were counted because a lower number of clusters were observed in micrographs. The MNPs embedded in sample p-Ag/CuNP were removed from 1 cm2 paper samples. The samples were immersed in 2 mL of water (18.2 MΩ·cm) and sonicated for 5 min. The obtained particles in suspension were disposed of on a silicon wafer. The MNPs were analyzed without metal coating using a low voltage (1 to 2 keV). Secondary electron and backscattered-type detectors were used to acquire the images.
X-ray fluorescence analysis (XRF) was used to determine the elemental composition of the papers. Circular samples of 2.5 cm. in diameter were taken and measured in the equipment Thermo Scientific™ Niton™ XL3t. X-ray diffraction analysis was performed to study the cellulose and identify the oxidation state of MNPs on paper using a Bruker D8 Advance, Ka1 Cu (k = 0.15406 nm). The d-spacings were calculated using the Bragg's equation [71].
| (1) |
where λ is the radiation wavelength (0.15406 nm), θ is the diffraction angle.
The average thickness of cellulose crystallites was estimated from the XRD patterns by using Scherrer's equation [71].
| (2) |
where L is crystallite size, k is the correction factor and usually taken to be 0.9, λ is 0.15406 nm, θ is the diffraction angle and β1/2 is the peak width at the half-maximum intensity.
The crystallinity index (CrI) of cellulose was determined by using X-ray diffraction curves based on the Segal method [72]:
| (3) |
where, CrI expresses the relative degree of crystallinity, I002 is the maximum intensity of the (2 0 0) lattice diffraction (2θ ≈ 22.7°), and Iam is the minimum intensity between the 200 and the 101 peaks (2θ ≈ 19°).
The optical properties of MNPs in the cellulose fibers were determined by UV–Vis spectroscopy using a Shimadzu UV 1280 spectrophotometer, following the previously reported procedure [61]. The UV–Vis spectra correspond to an average of 5 measurements. A Bruker Vertex 80v infrared spectrophotometer was used to perform Fourier transform infrared spectroscopy (FTIR) at a resolution of 0.2 cm−1 to identify changes in the cellulose spectrum to determine cellulose-MNPs interactions. The infrared spectra correspond to an average of 5 measurements.
The electrical resistance of each prepared material was evaluated by Electrochemical Impedance Spectroscopy (EIS). The experimental condition has included the use of 2.5 mM [Fe(CN)6]3−/4− in 0.1 M KNO3 as redox probe and supporting electrolyte. As an electrochemical cell, a typical three-neck round bottom glass flask was used. Saturated calomel electrode (SCE, Hg/Hg2Cl2, sat), and platinum wire was selected as reference and counter electrode, respectively. The working electrode was a paper rectangle with 9 mm × 23 mm as dimensions for each sample ((i) paper, (ii) p-AgNP, (iii) p-CuNP, and (iv) p-Ag/CuNP), additionally a paper flap section of 7 mm was modified by silver conductive paint (SPi-SUPPIES, 05002-AB) to provide an electric connection from paper to a potentiostat. Additionally, the back of the paper was coated (9 mm × 23 mm) with double-sided tape (3 M 467MP200MP adhesive) to avoid a progressive disintegration of paper in electrolytic media. The EIS was performed under an equilibrium condition with atmospheric O2 concentration, with a sinusoidal modulation of 5 mV. The experimental frequency range evaluation goes from 100 kHz to 1 Hz. Ps trade-palmsens4s software was used for EIS analysis, which includes the Kramers - Kronig transformation (KKt), and Randles as equivalent circuits. To corroborate the paper's in situ resistivity, as well as conductivity, also a CR UT-601 tester (Uni-T), was used, along with a piece of paper of 2 cm × 2 cm for each sample which was wetted by carbon-paint along the edge of the paper to make the electrical connectors. Then, the resistivity and conductivity were determined by the following equations [73].
| (4) |
| (5) |
In addition, the mechanical properties of p-MNP samples were determined using a universal tensile testing machine (Zwick/Roell Z005, Germany). Tests were performed on strips (∼5 cm × 1 cm) cut from the fabricated membranes using razor blades. Before the analysis, the strips were mounted onto cardboard testing cards and glued using two-part epoxy glue. The temperature and the relative humidity were 25 °C and 48%, respectively. The thickness of each specimen was measured at three different locations along the length of the sample using a digital micrometer gauge (Accud, 0–25 mm, resolution 0.001 mm). The crosshead displacement speed of the tensile tester was set to 1 mm min−1, and the gauge length was 20 mm. At least five samples were tested for each material. Average values are reported along with their associated standard deviations used as error values.
Finally, the stability of the papers (cellulose and MNPs) was studied, subjecting them to “extreme washing” with water. The experiment consisting of two steps where p-MNPs were immersed in water and washed with aliquots of water via vacuum filtration. Accordingly, a 2 × 2 cm piece of p-MNP was immersed in 5 mL of water for 10 min (Step 1), then vacuum filtration was performed using a fritted glass funnel, and the paper was washed with three 5-mL aliquots of water (Step 2). Finally, the paper was dried in an oven at 50 °C for 30 min. Subsequently, both the water associated to the washings and the paper samples were analyzed using UV–Vis and FTIR spectroscopy. In addition, the papers were analyzed by XRF, XRD and SEM.
3. Results
3.1. Synthesis of metal nanoparticles assisted by ultrasound
The acoustic cavitation generated during sonochemical procedures is a straightforward tool to assist the absorption, reduction, and nanoprecipitation of metal salts in solution [41]. In this work, MNPs were synthesized in situ on paper using ultrasound. The modified papers were analyzed for their elemental composition and optical, morphological, and mechanical properties. After stage 1, paper 1 turns into similar colors as the metallic salt solutions (see Fig. 1a, b, d, f). Once exposed to AgNO3 solution, the paper turned light brown in color. In the case of the CuSO4 solution, the paper displayed a light blue color. For the mixing of AgNO3 and CuSO4 salts solution, blue papers showing dark spots were obtained. The papers’ colors agree with the concentration of metal ions obtained by XRF (Table 1). The sample p-AgNO3 presents a concentration of Ag 1,117 ± 51 ppm of Ag absorbed (corresponding to 6.7% of the initial solution 0.005 M AgNO3) on the paper without forming any nano o micrometric-structure (Fig. 2.a). In the case of p-CuSO4, the sample presented a concentration of Cu 65,400 ± 14,218 ppm (69.7 % of the 0.005 M CuSO4 solution) in the form of flake-like clusters (Fig. 2.b) [74]. The concentration of both metallic salts differed substantially due to the addition of NaOH in the CuSO4 solution. NaOH was necessary to promote the synthesis process by forming copper hydroxide [19]. In turn, it generates the swelling of cellulose fibers facilitating the embedding of the salt [75]. As a result, the paper immersed in solutions containing both salts improved the absorption of Ag to 20.6 % as compared to the one immersed only in the AgNO3 solution. Also, the sample p-AgNO3/CuSO4 showed the formation of micron-sized particles highly aggregated on the fibers and a few spots displaying flake-like clusters as observed in sample p-CuSO4 (Fig. 2.c).
Fig. 1.
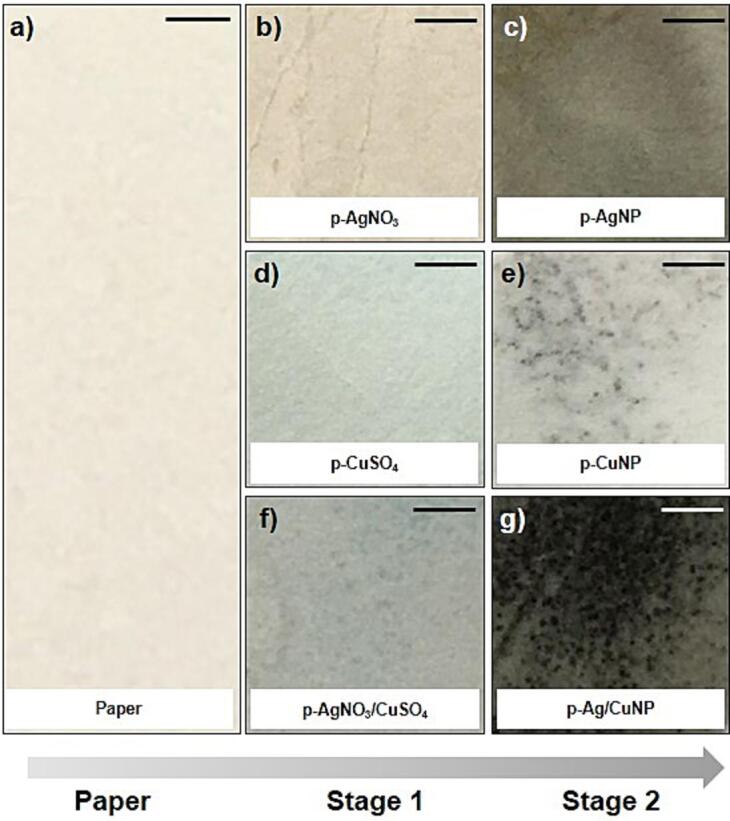
Optical images of Paper 1 immersed in different metallic salt solutions according to the procedure described in Stages 1 and 2. The scale bar corresponds to 1 cm.
Table 1.
Results of particle diameter were obtained from SEM micrographs according to concentration, sonication time, type of paper, and metal concentration determined by XRF.
| Sample | Concentration solution (M) | Diameter NP (nm) | Sonication time (min) | Type of paper | Metal concentration in a paper (ppm) |
|
|---|---|---|---|---|---|---|
| Ag | Cu | |||||
| p-AgNO3 | 0.005 | – | 0 | 1 |
468 ± 18 | – |
| 0.005 | – | 15 | 1,117 ± 51 | – | ||
| p-AgNP | 0.00125 | 44.9 ± 12.5 | 15 | 812 ± 49 | – | |
| 0.0025 | 54.9 ± 25.4 | 15 | 964 ± 68 | – | ||
| 0.005 | 80.7 ± 55.8 | 15 | 1,004 ± 48 | – | ||
| 0.005 | 102.4 ± 14.5 | 0 | 381 ± 14 | – | ||
| 0.005 | 80.7 ± 55.8 | 15 | 1,004 ± 48 | – | ||
| 0.005 | 47.7 ± 19.6 | 20 | 870 ± 56 | – | ||
| 0.005 | 12.0 ± 5.0 | 30 | 928 ± 42 | – | ||
| 0.005 | 57.1 ± 3.8 | 60 | 1,068 ± 30 | – | ||
| 0.005 | 43.2 ± 24.4 | 15 | 2 | 1,050 ± 50 | – | |
| p-CuSO4 | 0.005 | – | 0 | 1 | – | 749 ± 49 |
| 0.005 | – | 15 | – | 65,400 ± 14218 | ||
| p-CuNP | 0.00125 | – | 15 | – | 1,840 ± 219 | |
| 0.0025 | – | 15 | – | 2,533 ± 235 | ||
| 0.005 | 84.7 ± 48.3 | 15 | – | 7,289 ± 226 | ||
| 0.005 | – | 0 | – | 169 ± 43 | ||
| 0.005 | 84.7 ± 48.3 | 15 | – | 7,289 ± 226 | ||
| 0.005 | 72.7 ± 24.4 | 20 | – | 4,353 ± 315 | ||
| 0.005 | 123.5 ± 13.2 | 30 | – | 8,838 ± 501 | ||
| 0.005 | 79.6 ± 36.7 | 60 | – | 64,576 ± 1095 | ||
| 0.005 | – | 15 | 2 | – | 43,924 ± 149 | |
| p-AgNO3/CuSO4 | 0.005 | – | 0 | 1 | 134 ± 9 | 1027 ± 54 |
| 0.005 | – | 15 | 3,439 ± 79 | 37,763 ± 874 | ||
| p-Ag/CuNP |
0.00125 | 44.0 ± 3.3 | 15 | 410 ± 28 | 6,374 ± 157 | |
| 0.0025 | 53.7 ± 31.5 | 15 | 632 ± 45 | 7,248 ± 208 | ||
| 0.005 | 34.6 ± 12.7 | 15 | 807 ± 57 | 11,000 ± 458 | ||
| 0.005 | 273.6 ± 22,6 | 0 | 126 ± 9 | 409 ± 41 | ||
| 0.005 | 49.2 ± 40.4 | 15 | 2 | 683 ± 51 | 10,886 ± 440 | |
Fig. 2.

SEM micrographs of cellulose fibers ultrasonicated for 15 min in the presence of 0.005 M concentration of metallic salt solutions: without AA a) p-AgNO3, b) p-CuSO4, c) p-AgNO3/CuSO4 and in the presence of 0.05 M of AA showing the formation MNP d) p-AgNP, e) p-CuNP and, f) p-Ag/CuNP.
After stage 2, new colorations were obtained for all paper samples (see Fig. 1c, e, g). As observed, p-AgNO3 turns from light brown to gray color in p-AgNP. P-CuSO4 turns from light blue to light grey in p-CuNP. A more intense effect is observed for p-AgNO3/CuSO4, which turns from light grey to dark grey in p-Ag/CuNP. The samples also displayed many dark spots evidencing the formation of AgNPs, Cu macroaggregates, and Ag/CuNPs (Fig. 2d, e, f). The sample p-AgNP shows the homogenous dispersion of nanoparticles with spherical shapes (80.7 ± 55.8 nm, as observed in histograms in Figure S1) and uniformly distributed throughout the fiber surface. Instead, the sample p-CuNPs display highly aggregated NPs of 84.7 ± 48.3 nm forming clusters randomly distributed over the cellulose fibers. The average diameter of the clusters corresponds to 740.6 ± 30.5 nm. The difference between AgNPs and CuNPs can be explained by the standard reduction potential function where Ag+ has a value of + 0.80 V and Cu+2 + 0.34 V. Therefore, AgNPs are reduced easier than CuNPs in the presence of AA. AgNPs are isolated spherical particles; meanwhile, CuNPs are observed as clusters because their reduction, growth, and stabilization are still incomplete. The SEM micrography of p-Ag/CuNP (Fig. 2.f)) presents spherical shapes NPs of around 34.6 ± 12.7 nm homogeneously distributed around the cellulose fibers. Notably, the reduction and precipitation of both salts together diminished CuNPs’ agglomeration compared to results shown in Fig. 2.e). The early presence of AgNPs might explain the latter during the reduction reaction of both salts. Therefore, the presence of AgNPs in the immediate environment of the CuSO4 during reduction might limit the growth of CuNPs due to the synergistic interaction between the two metals [76] (Higher resolution image in Figure S2).
All the samples showed variations in the metal concentration (after stage 2), being the sample p-CuNPs the one that underwent the most significant metal leaching with 88.85% (7,289 ± 226 ppm of Cu remained in the paper). This phenomenon is explained by the change in the pH value from basic pH during Stage 1 (i.e., where the swelling of the cellulose fiber promoted higher metal salt absorption) to acid pH in Stage 2 during reduction. Thus, the presence of AA causes Cu to leach from the internal network of cellulose fibers and reduces the Cu salt to CuNPs on the paper’s surface [75]. The content of Ag imbibed in p-AgNP reached 1,004 ± 48 ppm and remained almost constant after the reduction process (only 10% is leached). In the case of the sample containing both MNPs (sample p-Ag/CuNP), the concentration of Ag and Cu decreased around 3,9 times compared to their initial concentration in p-AgNO3/CuSO4 (Table 1).
All samples were analyzed using UV–Vis absorption (Fig. 3). The figure shows the absorption bands of the control paper, paper with metallic salts, and paper with MNPs for systems containing Ag, Cu, and Ag/Cu. In the UV region, one can observe three absorption bands at 218, 293, and 395 nm characteristics to the neat paper (blue line) [61]. Fig. 3a in stage 1 (red line) shows an intense absorption band displaying three peaks. The first peak at 435 nm is a shift of the 395 nm band of the neat cellulose due to the aging of the paper in the salt solution during sonication [77], [78]. The successive peaks at 471 and 503 nm are related to the absorption of Ag+ ions bonded to cellulose fibers via short-range electrostatic interactions [68]. These absorption bands undergo bathochromic shifts compared to the AgNO3 band in solution (300 nm) (Figure S1). Stage 1 (red line) of Fig. 3b displays the aged band at 403 nm of cellulose with less intensity than the one observed for p-AgNO3. The latter is due to the less oxidative environment of the copper salt solution. The figure also shows new broadband associated with the CuSO4 centered at 722 nm, which undergoes a hypochromic shift of 86 nm compared to the salt solution (808 nm) (Figure S3). Fig. 3c displays the typical band of aged cellulose at 436 nm and a broad band centered at 553 nm related to the contribution of both metallic salts on the paper.
Fig. 3.

UV–Vis absorbance spectra of the control paper (blue lines), paper with metallic salt (Stage 1, red lines), and paper with MNP (Stage 2, black lines). Paper with a) Ag, b) Cu, and c) Ag/Cu.
After stage 2 (black lines), a new broad absorption band appeared with three peaks contribution. In Fig. 3a, the first peak at 435 nm is the aged peak as described before and is observed in the other samples (3b, c) with MNPs. The second peak at 490 nm is the typical maximum wavelength of the surface plasmon resonance (SPRmax) band of AgNPs of around 80 nm on some surfaces [79]. The SPRmax is an intrinsic characteristic of the metal type, size, shape, and distance between particles and the environment in which it is found. Therefore, the type of substrate where MNPs interact generates considerable influences on the SPRmax value. The third peak at 659 nm is associated with a broad range wavelength where the sample absorbed light according to the dark gray color of the paper (see Fig. 1c).
In the case of CuNPs (Fig. 3b), the SPRmax peak centered at 471 nm is consistent with the absorption band of copper oxide nanoparticles previously reported [80], [81]. The third band at 706 nm indicates the presence of copper ions, which did not react with the reducing agent, as seen in Stage 1 of the exact figure. Fig. 3c shows no characteristic SPR bands but only broadband with maximum absorption at 658 nm related to the synergistic absorption of both MNPs and the light absorption of the dark paper (see Fig. 1.g)). Besides, all the spectra of paper-MNPs present an increased baseline according to the dark color of the samples.
The interaction between cellulose fibers and Ag, Cu, or Ag/Cu was studied by FTIR (Figure S4). Characteristic cellulose peaks associated with O–H, C–H (3320, 2910 cm−1), and C–O–C (950 to 1200 cm−1) bonds were observed in all spectra [82]. FTIR spectra for papers with metallic salts or MNPs were similar to that obtained for the unmodified paper. New peaks associated with metal interaction were not observed [83], [84]. These results suggest that metallic salts and MNPs were probably adsorbed onto the cellulose fiber network through physical interactions because the chemical structure of cellulose remains intact. Only a new peak at 1740 cm -1 appears after stage 2 in the samples with p-MNPs related to the absorption peak of a keto group in AA [85]. In addition, the ratio between cellulose peak at 3332 cm−1 (attributed to OH stretching) and 993 cm−1 (attributed to C—O stretching) is used as an internal standard for the calculation of the hydrogen bonding intensity [86], [87]. Therefore, the ratio was calculated, and the results of each sample are shown in (Figure S4). The control paper sample presents an A3332/A993 ratio of 0.919. There is also observed that after stage 1, all papers impregnated with metallic salts showed an increasing tendency of A3332/A993 ratios corresponding to 0.925, 0.919, and 0.936 to p-AgNO3, p-CuSO4, and p-AgNO3/CuSO4, respectively. These results suggest the increase of hydrogen bonding for all samples due to the incorporation of monovalent and bivalent metal ions. After stage 2, samples p-AgNP, p-CuNP, and p-Ag/CuNP presented ratios of 0.841, 0.839, and 0.919, respectively. These lower intensities (compared to the control paper) suggest that the formation of MNPs in the paper quenched the hydrogen bonds between cellulose and metal ions in favour of metal nucleation [82].
All samples were characterized by X-ray diffraction measurements on the 2θ range from 2 to 80° to analyze the cellulose (Fig. 4a) and the crystalline structures of the MNPs in the paper (Fig. 4b). All diffractograms obtained for every sample exhibited four prominent peaks at 15,06, 16.35°, 22.68° and 34.4° corresponding to Miller index 1 0, 110, 200 and 004, respectively. These peaks are associated with cellulose type I [88]. The d-spacings, crystallite size, and crystallinity index were obtained using the information associated with those peaks and the results are showed in Table 2. The d-spacing values of the unmodified paper agree with those previously reported, validating the analysis method [89]. The results of the p-MNP show lower d-spacings than the unmodified paper, this result may be related to the fact that the cellulose fibers being modified with MNPs in all directions causes a greater proximity between the fibers and therefore a decrease in the distance between the planes. In relation to the crystallite size (L), of p-MNP indices (1 0) and (1 1 0), no trend in the changes is observed with respect to the unmodified paper. The L related to (2 0 0) increased independent of the MNP type. This result could infer that the MNPs present some type of preference for said plane. The crystallinity index of the cellulose in the control paper has a value of 81.4% and decreases slightly in the samples p-AgNPs and p-CuNPs (Table 2). This result demonstrates the use of ultrasound does not affect the cellulose integrity. However, in the sample with AgNP and CuNP (p-Ag/CuNP) the index is 78.5%. This decrease can be attributed to the intermolecular forces between cellulose fibers lessening due to the more significant adsorption of metals on its surface. It should be considered that the drying process of the paper samples (dried at 50 °C for 30 min) could also influence the crystallinity of the cellulose and contribute to the difference in crystalline parameters compared to unmodified paper, as previously reported [90]. Fig. 4b shows the diffractograms that present new peaks associated with the presence of MNPs. The two peaks at 34.26° and 46.39°, highlighted by black stars in the neat paper, remain constant in all p-MNPs corroborating that the synthesis process of MNPs does not disrupt the cellulose diffraction pattern. The p-AgNP presented four different peaks at 2θ values of 38.09°, 44.24°, 64.51°, and 77.49° (red stars) that can be assigned to the plane of (1 1 1), (2 0 0), (2 2 0), and (3 1 1), respectively. The latter indicates that the metallic AgNPs are fcc and crystalline (JCPDS file no. 84–0713 and 04–0783) [91]. The p-CuNP sample only exhibited two small peaks at 28.46° and 29.27° (green stars). The first peak fits with the Miller index (1 1 0) related to the reflections of standard Cu2O structures (JCPDS 78–2076) [92], [93]. This result is insufficient to determine the type of crystallinity of Cu structures, however, it allows comparing this result with the MNPs generated in the paper immersed in both salts, which present new peaks at 43.31°, 50.42°, and 74.03° (blue stars). All those peaks correspond to the reflections of standard (1 1 1), (2 0 0), and (2 2 0) characteristics of the fcc structure of metallic copper (JCPDS 85–1326) [61]. Moreover, the diffraction pattern of the p-Ag/CuNP sample shows the four peaks of metallic AgNP, but the two peaks assigned to Cu2O disappeared. These results demonstrate the formation of bimetallic Ag0 and Cu0 nanoparticles in the paper by the in situ chemical reduction. They also indicate that the presence of Ag in the paper diminished the intrinsic susceptibility of copper to form copper oxide species [76] Table 2.
Fig. 4.

X-ray powder diffraction patterns of control paper, paper with p-AgNP, p-CuNP, and p-Ag/CuNP. a) Diffractogram between 3 < 2θ < 80° to visualize the cellulose peaks. b) Diffractograms between 28 < 2θ < 80° to visualize the MNPs peaks.
Table 2.
Values of d-spacings, crystallite sizes, and crystallinity indices of cellulose in different paper-MNP.
| Sample |
dhkl (nm) |
L (nm) |
CrI% | ||||
|---|---|---|---|---|---|---|---|
| (1 0) | (1 1 0) | (2 0 0) | (1 0) | (1 1 0) | (2 0 0) | ||
| Paper | 0.591 | 0.533 | 0.393 | 4.637 | 5.940 | 5.313 | 81.4 |
| p-AgNP | 0.590 | 0.532 | 0.391 | 4.429 | 6.393 | 5.535 | 81.1 |
| p-CuNP | 0.591 | 0.532 | 0.391 | 4.535 | 5.731 | 5.792 | 81.0 |
| p-Ag/CuNP | 0.589 | 0.531 | 0.392 | 4.367 | 6.028 | 5.615 | 78.5 |
The EDS and scanning electronic microscopy analysis was performed to understand the type of bimetallic nanoparticles obtained. For brevity, only the sample p-Ag/CuNP was analyzed. SEM-EDS micrograph in Fig. 5 shows the aggregation of Ag and Cu NPs after their remotion from the p-Ag/CuNP sample. This result indicates the different forms of both MNPs during sonication according to EDS mapping in agreement with XRD results.
Fig. 5.

a) SEM Micrograph and b) EDS analysis of Ag and Cu NPs obtained from p-Ag/CuNP. The MNPs were removed from sample p-Ag/CuNP to optimize the analysis. Green and red colors represent Ag and Cu particles, respectively.
Due to the presence of MNPs within the paper and between cellulose fibers, there is the possibility of an electrochemical redox process occurring inside and affecting the stability of the material. To acquire information about intrinsic electrochemical phenomena, the resistance to charge transfer of each sample was evaluated by EIS [94]. Briefly, each paper was submersed in 2.5 mM [Fe(CN)6]3−/4− in 0.1 M KNO3, to obtain a Nyquist plot according to Fig. 6.
Fig. 6.

Nyquist for each paper sample in a 2.5 mM [Fe(CN)6]3−/4− in 0.1 M KNO3 as redox probe over a frequency range of 100 kHz to 100 mHz.
A decrease in circle size was shown in Fig. 6 according to paper > p-Ag/CuNP > p-AgNP > p-CuNP. Therefore, as we expected, the highest resistance to charge transfer (RCT) was for unmodified paper. Interestingly, as is depicted in the inset of Fig. 6 there is no evidence of a similar RCT for each sample which was summarized in Table S1. In this context, it is suggested that the electrochemical process is favored for p-CuNP (43.86 Ω*cm2), then p-Ag (6673 Ω*cm2), or even p-Ag/CuNP (7442 Ω*cm2) when the paper is wetted by supporting electrolyte. To corroborate the previous observation, a resistivity test was performed according to the reported in Table S1. The result shows the same behavior observed above by EIS. Along with this, a conductivity test was also carried out. As expected, the inversed order in conductivity was evidenced according to p-Ag/CuNP > p-AgNP > p-CuNP, which is consistent with the EIS results. This behavior could be understood by the possibility to establish a better interaction between molecular orbitals from cellulose and Fermi level in the formed MNP [95]. Therefore, there is plausible to consider that more points of contact are between p-CuNP than p-Ag/CuNP inside the fiber structure of paper, which concomitantly increases the respective conductivity. Consequently, is suggested that more electrochemical phenomena are occurring in p-CuNP (Cu0 → Cu2++2e-), which could impact the stability of the material. In this sense, p-Ag/CuNP is shown to be a more stable material from an electrochemical point of view.
Finally, the stability of the papers (cellulose and MNPs) was studied, subjecting them to “extreme washing” with water. When analyzing the water used in each washing step using UV–Vis and FTIR spectroscopy, it is evident that part of the cellulose is released into the water. The UV–Vis spectra of water associated with each washing step show a low absorption intensity in the UV zone. The UV intensity is higher in the waters collected after the filtration process (Figure S5 (top)). The latter is due to the absorption of paper fibres in that UV zone (see Fig. 3). This result indicates that the cellulose undergoes a partial detachment because of washing. The absence of other absorption bands associated with the MNPs indicates that very low quantities of MNPs are in the aqueous solution. Also, the presence of cellulose fibres in the aqueous solution modifies the structure of the nanoparticle (e.g. forming aggregates) hindering the appearance of SPR bands. Regarding the FTIR spectra (Figure S5 (down)), it is observed that the two waters samples analysed after the immersion of paper samples p-CuNP and p-Ag/CuNP present new bands between 2936 and –2838 cm−1 corresponding to C–H stretching vibrations characteristic of cellulose [96]. This result confirms that part of the cellulose has been removed from the paper that remained suspended in the waters samples. The effect is even magnified in the water collected from all papers after filtration showing higher absorbances (Figure S5, (bottom)).
Table 3 shows the analysis of p-MNP after extreme washing. The XRF results indicates that p-MNP samples present a lower concentration of each metal. p-CuNP samples only retained 5.74% of Cu meanwhile sample p-Ag/CuNP retained 30.25% of Cu. Regarding Ag, p-AgNP and p-Ag/CuNP samples retained 90.14% and 96.81% of Ag, respectively. These results demonstrate that MNPs are partially removed from cellulose fibres when subjected to extreme washing conditions.
Table 3.
Concentrations and crystallographic parameters of cellulose p-MNP samples subjected to extreme washing. Results were obtained by XRF and XRD.
| Samples | XRF (ppm and retention %) |
XRD |
|||||
|---|---|---|---|---|---|---|---|
| Ag | Cu | 1 0 | 110 | 200 | % CIr | ||
| p-AgNP | 905.1 ± 40.2 | – | dHKl (nm) | 0.612 | 0.546 | 0.391 | 80.7 |
| 90.14 | L (nm) | 4.407 | 5.840 | 5.214 | |||
| p-CuNP | – | 418.2 ± 42.7 | dHKl (nm) | 0.614 | 0.549 | 0.392 | 81.7 |
| 5.74 | L (nm) | 4.634 | 6.167 | 5.061 | |||
| p-Ag/CuNP | 781.3 ± 37.5 | 3328 ± 142 | dHKl (nm) | 0.615 | 0.548 | 0.391 | 82.9 |
| 96.81 | 30.25 | L (nm) | 4.758 | 5.518 | 5.158 | ||
Additionally, XRD measurement was performed to assess the stability of cellulose and MNPs. The diffractograms presented in Figure S6 (top) show decreasing intensities and displacement of all peaks towards higher 2θ values after the extreme washing process. The results in Table 3, suggest that the treatment modifies the crystalline structure of cellulose, which is confirmed by % CrI changes. When comparing the % CIr of the cellulose before and after being washed, a small decrease is observed from 81.1 to 80.7 % in the case of p-AgNP and an increase from 81.0 to 81.7 % for p-CuNP and from 78.5 to 82.9 %. for p-Ag/CuNP (Table 2). Since the p-AgNP sample is the only one that experiences metal desorption from the paper, it can be inferred that the decrease in crystallinity is clearly associated with the loss of cellulose as a result of washing. On the other hand, samples with copper, after the washing process, experience a considerable loss of metal and cellulose, which leads to a rearrangement of the material, decreasing the amorphous component of the system and causing an increase in crystallinity. In addition, the vacuum filtration process can contribute to a change in the intensity of the peaks resulting from the compression of the material, a comparative analysis was carried out using Whatman filter paper no. 40 versus the same crushed and compressed material [97]. Additionally, low intensity peaks indicate the partial degradation of the material, as suggested by UV–vis and FTIR spectroscopy analysis of the water samples (Figure S5). The shifted bands and the d-spacing calculations (Table 3), clearly indicate that the interplanar distance of cellulose crystals increases. This might be explained by the cellulose degradation during the vacuum filtration and drying process of the fibres. On the other hand, the XRD values between 28°< 2θ < 80° (Figure S6, (bottom)) show the area of peaks associated with the MNPs. The decreasing intensities of all peaks is observed, being much more evident in the case of the samples with Cu. It is impossible to determine if the CuNPs maintain their metallic character in the p-Ag/CuNP sample due to the low amount of metal and thus low periodicity. Regarding the Ag samples, the XRD maintains the most prominent peaks keeping their metallic character after the extreme washing.
Figure S7 shows the UV–Vis (top) and FTIR (bottom) spectra of p-MNPs after extreme washing. The intensity of absorption bands in both techniques is decreased as compared to untreated p-MNP samples. UV–Vis spectra shows both the UV area associated with cellulose and the SPR band associated to MNPs. These results confirm the release of fibres and MNPs after the extreme washing treatment. The FTIR results indicates that there are modifications in the cellulose bands. Notably, they correlate with XRD results where modifications in the crystallinity of the paper were observed (Figure S6). In addition, the Figure S8 shows that the SEM micrographs of p-MNP samples before (top) and after (bottom) the extreme washing with water shows the same tendency. After the washing process, a considerable amount of MNP is observed for p-AgNP and p-Ag/CuNP samples (Figure S8a and S8c, (bottom)). However, MNP are not observed in the p-CuNP sample after the extreme washing process (Figure S8b, (bottom)). The latter is consistent with the results obtained by XRF where only 5.74 % of Cu was retained after the washing process. It should be noticed that the micrographs do not show substantial deterioration of the cellulose fibers. These results indicate that systems with AgNP are more stable to extreme washing, maintaining more than 90% of the metal content and promoting copper retention in the case of the p-Ag/CuNP sample. In addition, the experiment demonstrated that the cellulose is partially lost, therefore, its use for applications in continuous contact with water is not suggested.
3.2. Concentration effect of metallic salts on the synthesis of MNPs in the paper
With the aim to determine the best experimental conditions to generate particles with homogenous distribution in the cellulose fibers different conditions of metal salt concentrations, sonication times, and types of papers were studied. SEM micrographs obtained the results of MNP diameters, and at<100 particles were analyzed. The metal concentration was obtained by XRF (Table 1). The first modification corresponds to decreasing the metallic salt concentration from 0.005 M to 0.0025 M and 0.00125 M. Fig. 7a-c shows SEM micrographs of p-AgNP obtained from systems prepared with different concentrations of AgNO3. The AgNPs generated from systems containing 0.005 M, 0.0025 M, and 0.00125 M of AgNO3 have particles of approximately 80, 55, and 45 nm, respectively. Samples with lower concentration of AgNO3 form clusters of NPs displaying sizes of around 300 nm rendered by the agglomeration of 45 nm NPs. The limited nucleation points might explain it due to the lower concentration of the precursor and the reducing agent (i.e., from 1:10 to 1:40, AgNO3: AA). Besides, the direct relationship between the number of particles, size, and the concentration of Ag displays the same tendency according to XRF results (Table 1). Similar results have been previously reported for the in situ production of AgNP on paper assisted by ultrasound using polyol as a reducing agent [63]. The work reported that AgNO3 concentrations of 100 and 25 mM in stage 1 of the salt impregnation rendered AgNPs of 89 ± 20 and 27 ± 7 nm, respectively. According to the results presented in Table 1, the concentration of Ag increases by increasing the concentration in the solutions. However, the ppm of Ag in the papers modified does not correlate with the two-fold decreasing concentration of the different solutions (0.005 M, 0.0025 M, 0.00125 M: 1004 ± 48 ppm, 964 ± 68 ppm, 812 ± 49 ppm, respectively).
Fig. 7.

SEM micrographs of p-AgNP samples were obtained by using different concentrations of AgNO3. a) 0.005 M, b) 0.0025 M, and c) 0.00125 M. SEM micrographs p-Ag/CuNP samples were obtained by using different concentrations of AgNO3 and CuSO4. a) 0.005 M, b) 0.0025 M, and c) 0.00125 M.
For p-CuNP samples, the micrographs do not show significant changes according to the different concentrations. The sample with the highest concentration (0.005 M) only showed the formation of few particles, mainly clusters, as observed in Fig. 2e. Nevertheless, there is a high amount of Cu absorbed in the paper compared to the system containing the same concentration of Ag. The Cu ppm increases significantly due to the concentration of CuSO4 in the solution. This result confirms that each metal salt requires different conditions to generate MNPs. Fig. 7d-f shows p-Ag/CuNP with different concentrations. A significant decrease in particles can be observed by decreasing the concentration of metallic salts. In contrast to AgNP, the bimetallic particles appear as clusters formed by small particles and do not present a direct correlation with the two-fold decreasing concentration and particle size (0.005 M, 0.0025 M, 0.00125 M: 34.57 ± 12.65 ppm, 53.65 ± 31.47 ppm, 44.02 ± 3.290 ppm, respectively).
According to the UV–Vis results, the AgNPs spectra show a lower SPR band intensity due to decreasing metallic salt concentrations (Fig. 8a). This effect is more clearly observed in the case of p-CuNP (Fig. 8b), where a hypsochromic shift is also observed. It can be explained by the higher amount of Cu absorbed in the paper, which is positively correlated with the concentration of the salt solution. This behavior is not seen for the sample p-Ag/CuNP spectra because it presents very high absorption intensities, exceeding the detection limits of the instrument (Fig. 8c).
Fig. 8.

UV–Vis absorbance spectra of paper with a) p-AgNP, b) p-CuNP, and c) p-Ag/CuNP. The green arrow indicates the hypsochromic shift upon decreasing the concentration of metallic salt precursors.
3.3. Effect of sonication time for the synthesis of MNPs
The synthesis was carried out with and without ultrasound assistance to investigate the role of ultrasound on the size, shape, dispersion, and amounts of MNPs. Pictures of the samples after stages 1 and 2 are shown in Figure S9 and used as reference samples. After stage 1, all the samples show a light color of lesser intensity than those obtained through sonication procedures. After stage 2 (without ultrasound assistance), only the sample with Ag changed to light brown (i.e., p-AgNP and p-Ag/CuNP). The paper color presents a lower intensity than samples p-MNPs assisted by ultrasound showing that Ag+ is reduced even without ultrasound assistance.
Fig. 9 shows SEM micrographs of samples without sonication. Fig. 9a shows a few isolated AgNPs of 102.4 ± 14.5 nm. After stage 1, p-AgNO3 had a concentration of 468 ± 18 ppm of Ag and 381 ± 14 ppm after stage 2, denoting the loss of 19% of Ag during the reduction process. It was noticed that the AgNPs generated without ultrasound yielded 60% lower Ag than the one obtained with sonication (Table 1). Fig. 9b displays fibers without CuNPs or flakes of CuSO4. The sample showed a starting concentration of Cu of 749 ± 49 ppm (stage 1) which diminished to 169 ± 43 after reduction (stage 2). It was observed that only 2% of Cu is obtained in the p-CuNPs without sonication. Fig. 9c presents Ag/CuNPs of irregular morphologies distributed on the fibers with similar morphologies and clusters of particles as those observed in p-CuSO4 (Fig. 2b). Without ultrasound, the transition between stages 1 and 2 diminished the content of Ag and Cu up to 6% and 60%, respectively. If we compare the content of Ag and Cu in the p-MNPs, only around 18% of Ag and 4% of Cu is retained in the papers without sonication. The lack of MNPs observed by SEM and the lower concentration determined by XRF demonstrated that the proposed synthesis needs the catalytic effect generated by cavitation. There are three possible explanations for ultrasound’s role in synthesizing MNPs. First, it might be associated with nodes of high pressure and temperature produced by the cavitation phenomenon, which promotes the conditions for reducing metal ions. Second, the ultrasound breaks down water into hydrogen and hydroxyl radicals. Subsequently, hydrogen radicals would reduce metal ions into metallic atoms, which nucleate and grow into metallic nanoclusters [98]. Third, to synthesize MNPs on surfaces, the metal ions previously absorbed in the paper are released to the water/paper interface as an effect of ultrasonic waves. The latter facilitates the migration of the reduced ions to form MNPs on the surface of cellulose fibers. Similar results have been reported for AgNPs obtained on polyester fibers [98].
Fig. 9.

SEM micrographs of paper samples containing metallic salt precursors and AA a) p-AgNP, b) p-CuNP, and c) p-Ag/CuNP without ultrasound assistance.
To validate the hypothesis, different sonication times (20, 30, and 60 min) were performed during metallic salt impregnations (stage 1) to elucidate the correlation between shape, size, number, and distribution of MNPs formed on papers as a function of sonication times. Fig. 10a-c shows SEM micrographs of p-AgNP with different sonication times of a) 20, b) 30, and c) 60 min (histograms are shown in Figure S10). Fig. 10a displays spherical, monodispersed, and well-distributed AgNPs of 47.7 ± 19.6 nm all over the fibers. Likewise, Fig. 10b shows the same morphologies, dispersion, and distributions of AgNPs but with smaller sizes (12.0 ± 5.0 nm). Fig. 10c presents the agglomeration of AgNPs with sizes of 57.1 ± 3.8 nm but well distributed on the fibers. These results agree with the inverse correlation between the sonication time and the generation of smaller size and monodispersed MNPs in a colloidal suspension (i.e., the diminishing of the standard error of MNPs diameter) [67], [98]. However, the results with AgNPs sonicated for 60 min do not keep the same tendency due to an excess of nodes of nucleation that promotes the aggregation of the MNPs (Fig. 10c). The longer sonication time generated smaller AgNPs, differing from previously reports about the in situ synthesis of AgNPs on paper assisted by ultrasound [63]. This suggests the possibility that silver ions get previously reduced in solution (similar to a colloidal suspension) and then are adsorbed back into the paper.
Fig. 10.

SEM micrographs of sample p-AgNP subjected to different sonication times a) 20, b) 30, and c) 60 min. SEM micrographs of sample p-CuNP to d) 20, e) 30, and f) 60 min.
Fig. 10d-f shows SEM micrographs of sample p-CuNP subjected to different sonication times. Fig. 10d displays a few clusters of 715.1 ± 236.0 nm composed of nano-size particles (72.7 ± 24.4 nm) on the fibers. Fig. 10e shows a high number of clusters of 190.1 ± 64.6 nm composed mainly of nano-sized particles (123.5 ± 13.2 nm). The clusters are homogeneously distributed on the fibers but display poor dispersion. Fig. 10f presents a higher number of clusters of CuNPs of 203.5 ± 76.8 nm composed of nano-sized particles of 79.6 ± 36.7 nm. One can observe that the clusters are randomly distributed and highly crowded on the fibers. According to previous works, there is already described the advantage of using ultrasound radiation to synthesize CuNPs to produce smaller size and monodispersed CuNPs compared to conventional synthesis [42]. However, these results indicate there is not an inverse correlation between particle size and sonication times (i.e., the higher the sonication time, the smaller size of NPs). Nevertheless, the NPs cluster formation is a time-controlling parameter to consider. So far, it has been demonstrated that the sonication time during stage 1 affects the metallic salts’ absorption behavior in the paper. The latter determines the dispersion and distribution of MNPs on the fibers.
Previously, we have described that the sonication of paper samples in the presence of AA (reduction process, stage 2) generates the desorption of some part of the impregnated metals. To visualize the effect, Fig. 11 shows a graph related to sonication times during the impregnation process of metallic salts (stage 1) and the content of the metals in the papers at the end of the synthesis (stage 2). One can observe that the final concentration of Ag and Cu is decreased once the samples are sonicated for up to 20 min during Stage 1. The result indicates that the concentration of MNPs in the paper decreases at the end of the synthesis (stage 2). However, between 20 and 30 min of sonication, there is an inflection point in the curve, and the papers present an increasing metal concentration. This result suggests an equilibrium balance between the salt absorption from the solution and its desorption from the paper. By using ultrasound for 60 min, a higher concentration of metals in the papers is observed. It is explained by the influence of dynamic movements and cavitation during longer times which promotes the higher absorption of the salt. The higher content of metallic salts in the paper improved the availability of metal salts and their reduction during stage 2. The latter agrees with Fig. 10c and Fig. 10f, where higher amounts of MNPs are observed on the fibers. This effect is evident for both metals as a function of the sonication time in the impregnation process (stage 1) and allows predicting the final metal concentration at the end of the MNPs synthesis (stage 2).
Fig. 11.

Graphic of sonication times during impregnation of metallic salts (stage 1) and the final concentration of metals in the paper (stage 2). The concentration of metals was obtained by XRF.
3.4. Effect of paper type for the synthesis of MNP
The third modification in the synthesis of MNPs corresponds to changes in the type of cellulose paper. Thus, the same experiments described in previous sections were carried out but using a paper of 61 g m−2 (paper 2). Fig. 12 shows SEM micrographs of p-MNP with MNPs synthesized in both papers. Fig. 12a and b display spherical and monodisperse AgNPs of 80.7 ± 55.8 nm and 43.2 ± 24.4 diameters, respectively. The AgNPs are homogeneously distributed on cellulose fibers. Notably, smaller particles are generated on Paper 2 (Fig. 12b), which might be related to the lower availability of Ag ions in the immediate environment of the fiber during Stage 2. The lower availability of Ag ions hinders the growth of NPs even though both papers present concentrations of around 1000 ppm of Ag after Stage 2 (Table 1). No literature was found that relates the concept of grammage of paper and concentration of metal and size of MNPs synthesized by sonochemical assistance. However, the MNPs concentration generated in situ on porous or not porous substrates has been studied. According to the literature, porous surfaces have a higher MNPs content because of the greater absorption of metal ions [68]. In that study, both papers are porous and present similar concentrations of metals.
Fig. 12.

SEM micrographs of p-AgNP on different types of papers. a) paper 1 (140 g m−2), b) paper 2 (60 g m−2). SEM micrographs of sample p-Ag/CuNP to c) paper 1, d) paper 2.
On the other hand, the samples of p-CuNP using cellulose paper 2 of 61 g m−2 displayed few particles on the fiber with poor distribution (not shown for brevity). Surprisingly, the sample p-CuNP using paper 2 presents six times more concentration of Cu than sample paper 1 (Table 1). The low formation of particles is probably related to the Cu’s leaching during Stage 2. Fig. 12c and 12d show SEM micrographs of samples p-Ag/CuNP prepared using cellulose papers with different grammages. Fig. 12c exhibits the formation of clusters of Ag/CuNPs poorly dispersed but relatively well distributed on the cellulose fibers. The Ag/CuNPs obtained on paper 2 display higher polydispersion of size (49.2 ± 40.42 nm), as seen in Fig. 12d. Nevertheless, Ag and Cu concentrations are similar in both papers (around 700 and 11,000 ppm for Ag and Cu, respectively). It indicates that the higher porosity of paper 2 plays a role in the metal availability during the formation of MNPs. From this result, we hypothesize that if there is a higher porosity, the higher the formation of nucleation points for particle formation. Furthermore, as a result, a higher porosity renders a higher chance for cluster formation on the fibers.
Fig. 13 shows the UV–Vis spectra of the two cellulose paper types after Stage 2 with different metals. Both neat papers keep the three characteristic absorption bands of the UV zone. The higher grammage of paper 1 is evidenced in the UV–Vis spectrum with a higher absorption background and the aging band showing high intensity at 395 nm. The absorption spectrum of cellulose paper 2 shows less absorption and a lower intensity of the aging band at 357 nm. After the sonication process, the aging band increases its absorption intensities in both papers. It is clear evidence of cellulose fibers oxidation, as previously mentioned (see Fig. 3) [77], [78]. In Fig. 13a, it is possible to observe a significant difference in the absorption bands of the p-AgNP as a function of the different types of papers. P-AgNP in paper 1 presents a broad and intense absorption band with three peaks at 435, 490, and 659 nm, as previously described (Fig. 3a). The p-AgNP in paper 2 presents a sharp and intense peak at 432 nm. It is related to the aging band of cellulose and the SPR of AgNPs, which undergoes a hypsochromic shift compared to the band of AgNPs formed on paper 1. The SPR at lower wavelength is particular for AgNPs of smaller sizes, in agreement with Fig. 13a. The shoulder observed from 506 to 700 nm corresponds to the paper’s radiation absorption due to the sample’s intense coloration (blackening) after sonication. The latter shows less intensity as compared to p-AgNP on paper 1. Fig. 13b shows a band center at 403 nm related to cellulose aging and a shoulder around 450 nm, denoting the presence of SPR of CuNPs. A peak at 698 nm is also observed, corresponding to CuSO4 absorbed without reduction on the cellulose fibers. In Fig. 13c, the spectra of sample p-Ag/CuNP on paper 2 show an intense peak at 403 nm (aging band). All the sample’s absorption at a higher wavelength after this peak corresponds to the clusters of NPs of both metals. There is no appearance of common bands associated with the SPR of each MNPs.
Fig. 13.

UV–Vis absorbance spectra of papers and p-MNP.a) AgNPs, b) CuNPs, and c) Ag/CuNPs.
Finally, the stress–strain curves of neat papers with different grammages and papers containing MNPs are shown in Fig. 14. The figure indicates that paper 1 displays a higher Young's modulus than paper 2. Notably, the less grammage paper 2 has a higher stress at failure (i.e., ductility/deformation until break) with a smooth elastic/plastic transition denoting the ability to transfer the stress between fibers. Instead, paper 1 displays a marked elastic/plastic transition denoting the higher stiffness of the sample. It indicates that paper 1 has significantly less ability to transfer stress between the fiber network with lower strain at break. Fig. 14a indicates that the presence of AgNPs increases the strain response of both papers. However, paper 2 increases Young's modulus by around 1 MPa and around one-third of strain %, denoting the interaction of intercalated AgNPs between cellulose fibers. Contrarily, paper 1 decreased almost half of Young's modulus, probably due to the disruption of AgNPs between fibers and the weak interaction of the fibers network with the MNPs. The same tendency is observed for the systems containing CuNPs (Fig. 14b). Comparing 14a and 14b, one can observe that the system’s only difference is that p2-CuNP does not change modulus compared to the neat paper, but the strain reached a higher ductility until the break, as observed in 14a. Fig. 14c shows the same tendency for p1-Ag/CuNP compared to p1-AgNP (Fig. 14a). It suggests that including AgNP dominates the system’s response upon force. However, p2-Ag/CuNP undergoes substantial changes in its mechanical behavior. Notably, the paper substantially decreases modulus (around 3 MPa) and strain. If one considers the result obtained for p2-AgNP in Fig. 14a, it is seen that the Cu weakens the paper-MNPs composites, most probably by increasing the brittleness of the paper [75]. Figure S11 shows an example of the paper before, during, and after the mechanical test.
Fig. 14.

Representative stress–strain curves of neat paper 1 (thin black line) and paper 2 (thin red line) and p-MNPs a) AgNPs, b) CuNPs, and c) Ag/CuNPs.
4. Conclusions
This work is a proof of concept for a scalable in situ sonochemical production of Ag, Cu, and Cu/Ag metal nanoparticles (MNPs) on cellulose papers. This work highlighted the importance of sonochemical pre-treated paper samples in the presence of metallic salt precursors (stage 1) before reduction (stage 2) to form metallic nanostructures. According to our main results, high yield and low polydispersity of AgNPs on two different grammage papers were achieved by increasing the sonication time of stage 1 paper samples with AgNO3 salt precursor before reduction with AA. Moreover, the increasing time of stage 1 allowed for retaining a higher amount of the metallic salt precursor in both used papers, which became available for MNPs and cluster production upon reduction. Besides, it was observed that using Cu salt precursor alone did not render metallic Cu nanoparticles. Also, high flocculation was observed due to the low reduction rate of CuSO4 in our experimental conditions. Instead, paper samples prepared in the presence of both Ag and Cu salt precursors showed the formation of bimetallic Ag/Cu particles. It denoted the importance of the synergistic effect of both metallic precursors during impregnation and reduction processes rendering well-dispersed and distributed metallic nanostructures.
It is possible to conclude that papers with Ag present greater stability against extreme cleaning processes, regardless of whether part of the cellulose is detached. Finding that system p-Ag/CuNP stands out by retaining the MNP in a higher percentage and even increasing the % CrI with respect to the material before being washed. In addition, sample p-Ag/CuNP is shown to be a more stable material from an electrochemical point of view, for future scaling. On the other hand, the mechanical analysis revealed that paper samples presenting well-dispersed but not necessarily well-distributed MNPs or clusters showed slightly decreasing values of Young's modulus compared to neat papers. In turn, the strain at break was substantially improved only in papers containing solely AgNPs or Cu clusters. The latter suggests that the elastic deformation of papers is tuned by cellulose and MNPs interfacial interaction as denoted by indirect measurements by tensile test.
Overall, preparing these materials was straightforward, with components commonly available commercially. The concentration of metallic salt precursors and ultrasound times at room temperature are the only easily manageable parameters for tunning the dispersion, distribution, morphology, and polydispersity of the final synthesized MNPs on cellulose papers. Besides, this positively contributes to an easy, fast, and reproducible eco-friendly method to functionalize commercially available cellulose composite filters with water as the only solvent used for sample preparations. This material might impact water and air purification applications with low-price materials components as requested for industrial scalability.
Declaration of Competing Interest
The authors declare that they have no known competing financial interests or personal relationships that could have appeared to influence the work reported in this paper.
Acknowledgements
Proyecto Interfacultad UDD, Proyecto Fondecyt de Iniciación n° 11221232, FONDEQUIP EQ200021. ANID PIA/Basal grant AFB180001. Plan de fortalecimiento universidades estatales 2019, “Afianzar las acciones iniciales de fortalecimiento institucional implementadas, con foco en el mejoramiento de procesos administrativos y ciberseguridad, investigación avanzada, vinculación con el medio y procesos de enseñanza y aprendizaje”, UTM1999, MINEDUC.
Footnotes
Supplementary data to this article can be found online at https://doi.org/10.1016/j.ultsonch.2023.106545.
Contributor Information
Rodrigo Araya-Hermosilla, Email: rodrigo.araya@utem.cl.
Jessica Martínez, Email: jemartinez@udd.cl.
César Zúñiga Loyola, Email: cesar.zunigal@usach.cl.
Sara Ramírez, Email: sara.ramirez@ubo.cl.
Sebastián Salazar, Email: sebastian.salazar@udd.cl.
Charles S. Henry, Email: chuck.henry@colostate.edu.
Roberto Lavín, Email: roberto.lavin@udp.cl.
Nataly Silva, Email: nrsilva@udd.cl.
Appendix A. Supplementary data
The following are the Supplementary data to this article:
References
- 1.Singh J., Dutta T., Kim K.H., Rawat M., Samddar P., Kumar P. ‘Green’ synthesis of metals and their oxide nanoparticles: Applications for environmental remediation. J. Nanobiotechnol. 2018;16(1):1–24. doi: 10.1186/s12951-018-0408-4. [DOI] [PMC free article] [PubMed] [Google Scholar]
- 2.Makvandi P., Wang C.-y., Zare E.N., Borzacchiello A., Niu L.-n., Tay F.R. Metal-based nanomaterials in biomedical applications: antimicrobial activity and cytotoxicity aspects. Adv. Funct. Mater. 2020;30(22):1910021. [Google Scholar]
- 3.Jafarzadeh S., Jafari S.M. Impact of metal nanoparticles on the mechanical, barrier, optical and thermal properties of biodegradable food packaging materials. Crit. Rev. Food Sci. Nutr. Sep. 2021;61(16):2640–2658. doi: 10.1080/10408398.2020.1783200. [DOI] [PubMed] [Google Scholar]
- 4.Wei B., Xiong Y., Zhang Z., Hao J., Li L., Shi W. Efficient electrocatalytic reduction of CO2 to HCOOH by bimetallic In-Cu nanoparticles with controlled growth facet. Appl Catal B. Apr. 2021;283 doi: 10.1016/j.apcatb.2020.119646. [DOI] [Google Scholar]
- 5.Hou L., Han J., Wang C., Zhang Y., Wang Y., Bai Z., Gu Y., Gao Y., Yan X. Ag nanoparticle embedded Cu nanoporous hybrid arrays for the selective electrocatalytic reduction of CO 2 towards ethylene. Inorg. Chem. Front. 2020;7(10):2097–2106. [Google Scholar]
- 6.Li X., Wang J. One-dimensional and two-dimensional synergized nanostructures for high-performing energy storage and conversion. InfoMat. 2020;2(1):3–32. doi: 10.1002/inf2.12040. [DOI] [Google Scholar]
- 7.Asha A.B., Narain R. Polymer Science and Nanotechnology. Elsevier; Canada: 2020. Nanomaterials properties; pp. 343–359. [DOI] [Google Scholar]
- 8.Laurent S., Forge D., Port M., Roch A., Robic C., Vander Elst L., Muller R.N. Magnetic iron oxide nanoparticles: Synthesis, stabilization, vectorization, physicochemical characterizations and biological applications. Chem. Rev. 2008;108(6):2064–2110. doi: 10.1021/cr068445e. [DOI] [PubMed] [Google Scholar]
- 9.Tortella G.R., Pieretti J.C., Rubilar O., Fernández-Baldo M., Benavides-Mendoza A., Diez M.C., Seabra A.B. Silver, copper and copper oxide nanoparticles in the fight against human viruses: progress and perspectives. Crit. Rev. Biotechnol. 2022;42(3):431–449. doi: 10.1080/07388551.2021.1939260. [DOI] [PubMed] [Google Scholar]
- 10.Ochoa-Meza A.R., Álvarez-Sánchez A.R., Romo-Quiñonez C.R., Barraza A., Magallón-Barajas F.J., Chávez-Sánchez A., García-Ramos J.C., Toledano-Magaña Y., Bogdanchikova N., Pestryakov A., Mejía-Ruiz C.H. Silver nanoparticles enhance survival of white spot syndrome virus infected Penaeus vannamei shrimps by activation of its immunological system. Fish Shellfish Immunol. 2019;84:1083–1089. doi: 10.1016/j.fsi.2018.10.007. [DOI] [PubMed] [Google Scholar]
- 11.Azizi-Lalabadi M., Garavand F., Jafari S.M. Incorporation of silver nanoparticles into active antimicrobial nanocomposites: Release behavior, analyzing techniques, applications and safety issues. Adv. Colloid Interface Sci. 2021;293 doi: 10.1016/j.cis.2021.102440. [DOI] [PubMed] [Google Scholar]
- 12.McNeilly O., Mann R., Hamidian M., Gunawan C. Emerging concern for silver nanoparticle resistance in Acinetobacter baumannii and other bacteria. Front. Microbiol. 2021;12(April) doi: 10.3389/fmicb.2021.652863. [DOI] [PMC free article] [PubMed] [Google Scholar]
- 13.van Hengel I.A.J., Tierolf M.W.A.M., Valerio V.P.M., Minneboo M., Fluit A.C., Fratila-Apachitei L.E., Apachitei I., Zadpoor A.A. Self-defending additively manufactured bone implants bearing silver and copper nanoparticles. J. Mater. Chem. B. 2020;8(8):1589–1602. doi: 10.1039/c9tb02434d. [DOI] [PubMed] [Google Scholar]
- 14.Akpinar I., Unal M., Sar T. Potential antifungal effects of silver nanoparticles (AgNPs) of different sizes against phytopathogenic Fusarium oxysporum f. sp. radicis-lycopersici (FORL) strains. SN Appl Sci. 2021;3(4):1–9. doi: 10.1007/s42452-021-04524-5. [DOI] [Google Scholar]
- 15.Tsai C.H., Chen S.Y., Song J.M., Chen I.G., Lee H.Y. Thermal stability of Cu at Ag core-shell nanoparticles. Corros. Sci. 2013;74:123–129. doi: 10.1016/j.corsci.2013.04.032. [DOI] [Google Scholar]
- 16.Mottaghi N., Ranjbar M., Farrokhpour H., Khoshouei M., Khoshouei A., Kameli P., Salamati H., Tabrizchi M., Jalilian-Nosrati M. Ag/Pd core-shell nanoparticles by a successive method: Pulsed laser ablation of Ag in water and reduction reaction of PdCl 2. Appl. Surf. Sci. 2014;292:892–897. [Google Scholar]
- 17.Babu P., Naik B. Cu-Ag bimetal alloy decorated SiO2@TiO2Hybrid photocatalyst for enhanced H2 evolution and phenol oxidation under visible light. Inorg. Chem. 2020;59(15):10824–10834. doi: 10.1021/acs.inorgchem.0c01325. [DOI] [PubMed] [Google Scholar]
- 18.Chen K.T., Ray D., Peng Y.H., Hsu Y.C. Preparation of Cu-Ag core-shell particles with their anti-oxidation and antibacterial properties. Curr. Appl Phys. 2013;13(7):1496–1501. doi: 10.1016/j.cap.2013.05.003. [DOI] [Google Scholar]
- 19.Silva N., Ramírez S., Díaz I., Garcia A., Hassan N. Easy, quick, and reproducible sonochemical synthesis of CuO nanoparticles. Materials. 2019;12(5):1–13. doi: 10.3390/MA12050804. [DOI] [PMC free article] [PubMed] [Google Scholar]
- 20.Douglass M.E., Goudie M.J., Pant J., Singha P., Hopkins S., Devine R., Schmiedt C.W., Handa H. Catalyzed nitric oxide release via cu nanoparticles leads to an increase in antimicrobial effects and hemocompatibility for short-term extracorporeal circulation. ACS Appl Bio Mater. 2019;2(6):2539–2548. doi: 10.1021/acsabm.9b00237. [DOI] [PMC free article] [PubMed] [Google Scholar]
- 21.Mikami K., Kido Y., Akaishi Y., Quitain A., Kida T. Synthesis of Cu2O/CuO nanocrystals and their application to H2S sensing. Sensors. Jan. 2019;19(1):211. doi: 10.3390/s19010211. [DOI] [PMC free article] [PubMed] [Google Scholar]
- 22.Pagliaro M., Della Pina C., Mauriello F., Ciriminna R. Catalysis with silver: from complexes and nanoparticles to MORALs and single-atom catalysts. Catalysts. Nov. 2020;10(11):1343. doi: 10.3390/catal10111343. [DOI] [Google Scholar]
- 23.Zhang X., Sun H., Tan S., Gao J., Fu Y., Liu Z. Hydrothermal synthesis of Ag nanoparticles on the nanocellulose and their antibacterial study. Inorg. Chem. Commun. Feb. 2019;100:44–50. doi: 10.1016/j.inoche.2018.12.012. [DOI] [Google Scholar]
- 24.Outokesh M., Hosseinpour M., Ahmadi S.J., Mousavand T., Sadjadi S., Soltanian W. Hydrothermal synthesis of CuO nanoparticles: Study on effects of operational conditions on yield, purity, and size of the nanoparticles. Ind. Eng. Chem. Res. 2011;50(6):3540–3554. doi: 10.1021/ie1017089. [DOI] [Google Scholar]
- 25.Ji R., Sun W., Chu Y. One-step hydrothermal synthesis of Ag/Cu2O heterogeneous nanostructures over Cu foil and their SERS applications. RSC Adv. 2014;4(12):6055. doi: 10.1039/c3ra44281k. [DOI] [Google Scholar]
- 26.Tan K.S., Cheong K.Y. Advances of Ag, Cu, and Ag–Cu alloy nanoparticles synthesized via chemical reduction route. J. Nanopart. Res. Apr. 2013;15(4):1537. doi: 10.1007/s11051-013-1537-1. [DOI] [Google Scholar]
- 27.Abdul Salam A., Singaravelan R., Vasanthi P., Bangarusudarsan Alwar S. Electrochemical fabrication of Ag–Cu nano alloy and its characterization: an investigation. J Nanostructure Chem. 2015;5(4):383–392. doi: 10.1007/s40097-015-0170-1. [DOI] [Google Scholar]
- 28.Jain N.K., Pathak S., Alam M. Synthesis of Copper Nanoparticles by Pulsed Electrochemical Dissolution Process. Ind. Eng. Chem. Res. Jan. 2019;58(2):602–608. doi: 10.1021/acs.iecr.8b03146. [DOI] [Google Scholar]
- 29.Tang Z., Liu S., Dong S., Wang E. Electrochemical synthesis of Ag nanoparticles on functional carbon surfaces. J. Electroanal. Chem. 2001;502(1–2):146–151. doi: 10.1016/S0022-0728(01)00344-8. [DOI] [Google Scholar]
- 30.Menazea A.A. Femtosecond laser ablation-assisted synthesis of silver nanoparticles in organic and inorganic liquids medium and their antibacterial efficiency. Radiat. Phys. Chem. 2020;168 doi: 10.1016/j.radphyschem.2019.108616. [DOI] [Google Scholar]
- 31.Fernández-Arias M., et al. Copper nanoparticles obtained by laser ablation in liquids as bactericidal agent for dental applications. Appl. Surf. Sci. 2020;507:145032. doi: 10.1016/j.apsusc.2019.145032. [DOI] [Google Scholar]
- 32.Satya Bharati M.S., Chandu B., Rao S.V. Explosives sensing using Ag–Cu alloy nanoparticles synthesized by femtosecond laser ablation and irradiation. RSC Adv. 2019;9(3):1517–1525. doi: 10.1039/C8RA08462A. [DOI] [PMC free article] [PubMed] [Google Scholar]
- 33.Njoki P.N., Rhoades A.E., Barnes J.I. Microwave-Assisted synthesis of Anisotropic copper–silver nanoparticles. Mater. Chem. Phys. Feb. 2020;241 doi: 10.1016/j.matchemphys.2019.122348. [DOI] [Google Scholar]
- 34.El-Berry M.F., Sadeek S.A., Abdalla A.M., Nassar M.Y. Microwave-assisted fabrication of copper nanoparticles utilizing different counter ions: An efficient photocatalyst for photocatalytic degradation of safranin dye from aqueous media. Mater. Res. Bull. 2021;133:111048. [Google Scholar]
- 35.Manno R., Sebastian V., Irusta S., Mallada R., Santamaria J. Ultra-Small Silver Nanoparticles Immobilized in Mesoporous SBA-15. Microwave-Assisted Synthesis and Catalytic Activity in the 4-Nitrophenol Reduction. Catal. Today. Feb. 2021;362(April):81–89. doi: 10.1016/j.cattod.2020.04.018. [DOI] [Google Scholar]
- 36.Kim D.S., Kim J.C., Kim B.K., Kim D.W. One-pot low-temperature sonochemical synthesis of CuO nanostructures and their electrochemical properties. Ceram. Int. 2016;42(16):19454–19460. doi: 10.1016/j.ceramint.2016.09.044. [DOI] [Google Scholar]
- 37.Hu Q., Zhao C., Zhang Z., Guo J., Yu C., Sun Z., Piao X. Sonochemical synthesis of silver nanoparticles coated copper wire for low-temperature solid state bonding on silicon substrate. Chin. Chem. Lett. 2019;30(7):1455–1459. [Google Scholar]
- 38.Ganguly S., Das P., Bose M., Das T.K., Mondal S., Das A.K., Das N.C. Sonochemical green reduction to prepare Ag nanoparticles decorated graphene sheets for catalytic performance and antibacterial application. Ultrason. Sonochem. 2017;39:577–588. doi: 10.1016/j.ultsonch.2017.05.005. [DOI] [PubMed] [Google Scholar]
- 39.Chatel G. How sonochemistry contributes to green chemistry? Ultrason. Sonochem. Jan. 2018;40:117–122. doi: 10.1016/j.ultsonch.2017.03.029. [DOI] [PubMed] [Google Scholar]
- 40.Mancier V., Rousse-Bertrand C., Dille J., Michel J., Fricoteaux P. Sono and electrochemical synthesis and characterization of copper core-silver shell nanoparticles. Ultrason. Sonochem. 2010;17(4):690–696. doi: 10.1016/j.ultsonch.2009.12.009. [DOI] [PubMed] [Google Scholar]
- 41.Hangxun X., Zeiger B.W., Suslick K.S. Sonochemical synthesis of nanomaterials. Chem. Soc. Rev. 2013;42(7):2555–2567. doi: 10.1039/c2cs35282f. [DOI] [PubMed] [Google Scholar]
- 42.Yang G., et al. Understanding the relationship between particle size and ultrasonic treatment during the synthesis of metal nanoparticles. Ultrason Sonochem. 2021;73 doi: 10.1016/j.ultsonch.2021.105497. [DOI] [PMC free article] [PubMed] [Google Scholar]
- 43.Salama A., Abouzeid R.E., Owda M.E., Cruz-Maya I., Guarino V. Cellulose–silver composites materials: Preparation and applications. Biomolecules. 2021;11(11):1–29. doi: 10.3390/biom11111684. [DOI] [PMC free article] [PubMed] [Google Scholar]
- 44.Welch C.M., Banks C.E., Simm A.O., Compton R.G. Silver nanoparticle assemblies supported on glassy-carbon electrodes for the electro-analytical detection of hydrogen peroxide. Anal. Bioanal. Chem. 2005;382(1):12–21. doi: 10.1007/s00216-005-3205-5. [DOI] [PubMed] [Google Scholar]
- 45.Bhargava S.S., Proietto F., Azmoodeh D., Cofell E.R., Henckel D.A., Verma S., Brooks C.J., Gewirth A.A., Kenis P.J.A. System design rules for intensifying the electrochemical reduction of CO2 to CO on ag Nanoparticles. ChemElectroChem. 2020;7(9):2001–2011. [Google Scholar]
- 46.Shahriari M., Hemmati S., Zangeneh A., Zangeneh M.M. Decoration of silver nanoparticles on multi-walled carbon nanotubes: Investigation of its anti-acute leukemia property against acute myeloid leukemia and acute T cell leukemia. Appl. Organomet. Chem. 2020;34(4):1–10. doi: 10.1002/aoc.5476. [DOI] [Google Scholar]
- 47.Wei X., et al. Enhancement of mechanical properties and conductivity in carbon nanotubes (CNTs)/Cu matrix composite by surface and intratube decoration of CNTs. Mater. Sci. Eng. A. 2021;816(January) doi: 10.1016/j.msea.2021.141248. [DOI] [Google Scholar]
- 48.Liu C., Wu W., Wang Y., Liu X., Chen Q., Xia S. Silver nanoparticle-enhanced three-dimensional boron nitride/reduced graphene oxide skeletons for improving thermal conductivity of polymer composites. ACS Appl Polym Mater. 2021;3(7):3334–3343. doi: 10.1021/acsapm.1c00210. [DOI] [Google Scholar]
- 49.Feizollahi A., Rafati A.A., Assari P., Asadpour Joghani R. Development of an electrochemical sensor for the determination of antibiotic sulfamethazine in cow milk using graphene oxide decorated with Cu-Ag core-shell nanoparticles. Anal. Methods. 2021;13(7):910–917. doi: 10.1039/d0ay02261f. [DOI] [PubMed] [Google Scholar]
- 50.Zook J.M., Long S.E., Cleveland D., Geronimo C.L.A., MacCuspie R.I. Measuring silver nanoparticle dissolution in complex biological and environmental matrices using UV-visible absorbance. Anal. Bioanal. Chem. 2011;401(6):1993–2002. doi: 10.1007/s00216-011-5266-y. [DOI] [PubMed] [Google Scholar]
- 51.Dimkpa C.O., McLean J.E., Martineau N., Britt D.W., Haverkamp R., Anderson A.J. Silver nanoparticles disrupt wheat (Triticum aestivum L.) growth in a sand matrix. Environ. Sci. Tech. 2013;47(2):1082–1090. doi: 10.1021/es302973y. [DOI] [PubMed] [Google Scholar]
- 52.Mostafa A.M., Lotfy V.F., Mwafy E.A., Basta A.H. Influence of coating by Cu and Ag nanoparticles via pulsed laser deposition technique on optical, electrical and mechanical properties of cellulose paper. J. Mol. Struct. 2020;1203 doi: 10.1016/j.molstruc.2019.127472. [DOI] [Google Scholar]
- 53.Maurer H.W. “Starch in the Paper Industry”, in Starch. Third Edit. Elsevier. 2009:657–713. doi: 10.1016/B978-0-12-746275-2.00018-5. [DOI] [Google Scholar]
- 54.Magalhães M.I., Almeida A.P.C. Nature-inspired cellulose-based active materials: From 2D to 4D. Applied Biosciences. 2023;2(1):94–114. doi: 10.3390/applbiosci2010009. [DOI] [Google Scholar]
- 55.Yu D.H., Yu X., Wang C., Liu X.C., Xing Y. Synthesis of natural cellulose-templated TiO 2/Ag nanosponge composites and photocatalytic properties. ACS Appl. Mater. Interfaces. 2012;4(5):2781–2787. doi: 10.1021/am3004363. [DOI] [PubMed] [Google Scholar]
- 56.Pal S., Nisi R., Stoppa M., Licciulli A. Silver-functionalized bacterial cellulose as antibacterial membrane for wound-healing applications. ACS Omega. 2017;2(7):3632–3639. doi: 10.1021/acsomega.7b00442. [DOI] [PMC free article] [PubMed] [Google Scholar]
- 57.Haslinger S., Ye Y., Rissanen M., Hummel M., Sixta H. Cellulose Fibers for High-Performance Textiles Functionalized with Incorporated Gold and Silver Nanoparticles. ACS Sustain. Chem. Eng. 2020;8(1):649–658. doi: 10.1021/acssuschemeng.9b06385. [DOI] [Google Scholar]
- 58.Yang Y., Huang Q., Payne G.F., Sun R., Wang X. A highly conductive, pliable and foldable Cu/cellulose paper electrode enabled by controlled deposition of copper nanoparticles. Nanoscale. 2019;11(2):725–732. doi: 10.1039/c8nr07123c. [DOI] [PubMed] [Google Scholar]
- 59.Muthulakshmi L., Varada Rajalu A., Kaliaraj G.S., Siengchin S., Parameswaranpillai J., Saraswathi R. Preparation of cellulose/copper nanoparticles bionanocomposite films using a bioflocculant polymer as reducing agent for antibacterial and anticorrosion applications. Compos. B Eng. 2019;175(March) doi: 10.1016/j.compositesb.2019.107177. [DOI] [Google Scholar]
- 60.Dankovich T.A., Gray D.G. Bactericidal paper impregnated with silver nanoparticles for point-of-use water treatment. Environ. Sci. Tech. 2011;45(5):1992–1998. doi: 10.1021/es103302t. [DOI] [PubMed] [Google Scholar]
- 61.Contreras P., Amenabar A., Apablaza V., Martínez J., Lavín R., Silva N. Correlation between the concentration and morphology of copper microparticles and their biocidal effect on paper sheets. Cellul. 2020;27(8):4721–4743. doi: 10.1007/s10570-020-03085-x. [DOI] [Google Scholar]
- 62.Gu R., Yun H., Chen L., Wang Q., Huang X. Regenerated cellulose films with amino-terminated hyperbranched polyamic anchored nanosilver for active food packaging. ACS Appl Bio Mater. 2020;3(1):602–610. doi: 10.1021/acsabm.9b00992. [DOI] [PubMed] [Google Scholar]
- 63.Gottesman R., Shukla S., Perkas N., Solovyov L.A., Nitzan Y., Gedanken A. Sonochemical coating of paper by microbiocidal silver nanoparticles. Langmuir. Jan. 2011;27(2):720–726. doi: 10.1021/la103401z. [DOI] [PubMed] [Google Scholar]
- 64.Tsai T.T., Huang T.H., Chang C.J., Yi-Ju Ho N., Tseng Y.T., Chen C.F. Antibacterial cellulose paper made with silver-coated gold nanoparticles. Sci. Rep. 2017;7(1):1–10. doi: 10.1038/s41598-017-03357-w. [DOI] [PMC free article] [PubMed] [Google Scholar]
- 65.Biliuta G., Bostănaru-Iliescu A.-C., Mareș M., Pavlov-Enescu C., Năstasă V., Burduniuc O., Coseri S. Antibacterial and Antifungal Silver Nanoparticles with Tunable Size Embedded in Various Cellulose-Based Matrices. Molecules. 2022;27(19):6680. doi: 10.3390/molecules27196680. [DOI] [PMC free article] [PubMed] [Google Scholar]
- 66.Amini E., Azadfallah M., Layeghi M., Talaei-Hassanloui R. Silver-nanoparticle-impregnated cellulose nanofiber coating for packaging paper. Cellul. 2016;23(1):557–570. doi: 10.1007/s10570-015-0846-1. [DOI] [Google Scholar]
- 67.Popov V., Hinkov I., Diankov S., Karsheva M., Handzhiyski Y. Ultrasound-assisted green synthesis of silver nanoparticles and their incorporation in antibacterial cellulose packaging. Green Process. Synth, 2015;4(2):125–131. doi: 10.1515/gps-2014-0085. [DOI] [Google Scholar]
- 68.He J., Kunitake T., Nakao A. Facile in situ synthesis of noble metal nanoparticles in porous cellulose fibers. Chem. Mater. 2003;15(23):4401–4406. doi: 10.1021/cm034720r. [DOI] [Google Scholar]
- 69.Haider A., Haider S., Kang I.-K., Kumar A., Kummara M.R., Kamal T., Han S.S. A novel use of cellulose based filter paper containing silver nanoparticles for its potential application as wound dressing agent. Int. J. Biol. Macromol. 2018;108:455–461. doi: 10.1016/j.ijbiomac.2017.12.022. [DOI] [PubMed] [Google Scholar]
- 70.Dankovich T.A., Smith J.A. Incorporation of copper nanoparticles into paper for point-of-use water purification. Water Res. Oct. 2014;63:245–251. doi: 10.1016/j.watres.2014.06.022. [DOI] [PMC free article] [PubMed] [Google Scholar]
- 71.Ju X., Bowden M., Brown E.E., Zhang X. An improved X-ray diffraction method for cellulose crystallinity measurement. Carbohydr. Polym. Jun. 2015;123:476–481. doi: 10.1016/j.carbpol.2014.12.071. [DOI] [PubMed] [Google Scholar]
- 72.Segal L., Creely J.J., Martin A.E., Conrad C.M. An Empirical Method for Estimating the Degree of Crystallinity of Native Cellulose Using the X-Ray Diffractometer. Text. Res. J. Oct. 1959;29(10):786–794. doi: 10.1177/004051755902901003. [DOI] [Google Scholar]
- 73.Bard A.J.F.L.R. 2nd ed. John Wiley & Sons, Inc; 2000. Electrochemical Methods: Fundamentals and Applications. [Google Scholar]
- 74.Karunakaran C., Manikandan G., Gomathisankar P. Microwave, sonochemical and combustion synthesized CuO nanostructures and their electrical and bactericidal properties. J. Alloy. Compd. 2013;580:570–577. doi: 10.1016/j.jallcom.2013.07.150. [DOI] [Google Scholar]
- 75.Dankovich T.A., Smith J.A. Incorporation of copper nanoparticles into paper for point-of-use water purification. Water Res. 2014;63:245–251. doi: 10.1016/j.watres.2014.06.022. [DOI] [PMC free article] [PubMed] [Google Scholar]
- 76.Zhang Z., Ji Y., Li J., Zhong Z., Su F. Synergistic effect in bimetallic copper-silver (CuxAg) nanoparticles enhances silicon conversion in Rochow reaction. RSC Adv. 2015;5(67):54364–54371. doi: 10.1039/c5ra04575d. [DOI] [Google Scholar]
- 77.Łojewska J., Missori M., Lubańska A., Grimaldi P., Ziȩba K., Proniewicz L.M., Congiu Castellano A. Carbonyl groups development on degraded cellulose. Correlation between spectroscopic and chemical results. Appl. Phys. A Mater. Sci. Process. 2007;89(4):883–887. [Google Scholar]
- 78.Łojewski T., Miśkowiec P., Missori M., Lubańska A., Proniewicz L.M., Łojewska J. FTIR and UV/vis as methods for evaluation of oxidative degradation of model paper: DFT approach for carbonyl vibrations. Carbohydr. Polym. Sep. 2010;82(2):370–375. doi: 10.1016/j.carbpol.2010.04.087. [DOI] [Google Scholar]
- 79.Lee K.C., Lin S.J., Lin C.H., Tsai C.S., Lu Y.J. Size effect of Ag nanoparticles on surface plasmon resonance. Surf. Coat. Technol. 2008;202(22–23):5339–5342. doi: 10.1016/j.surfcoat.2008.06.080. [DOI] [Google Scholar]
- 80.Silva N., Ramírez S., Díaz I., Garcia A., Hassan N. Easy, quick, and reproducible sonochemical synthesis of CuO nanoparticles. Materials. Mar. 2019;12(5):804–817. doi: 10.3390/ma12050804. [DOI] [PMC free article] [PubMed] [Google Scholar]
- 81.Yeshchenko O.A., Dmitruk I.M., Dmytruk A.M., Alexeenko A.A. Influence of annealing conditions on size and optical properties of copper nanoparticles embedded in silica matrix. Mater Sci Eng B Solid State Mater Adv Technol. 2007;137(1–3):247–254. doi: 10.1016/j.mseb.2006.11.030. [DOI] [Google Scholar]
- 82.Li H., Cui R., Peng L., Cai S., Li P., Lan T. Preparation of antibacterial cellulose paper using layer-by-layer assembly for cooked beef preservation at ambient temperature. Polymers (Basel) 2017;10(1):15. doi: 10.3390/polym10010015. [DOI] [PMC free article] [PubMed] [Google Scholar]
- 83.Zhang Y.X., Huang M., Li F., Wen Z.Q. Controlled synthesis of hierarchical CuO nanostructures for electrochemical capacitor electrodes. Int. J. Electrochem. Sci. 2013;8(6):8645–8661. [Google Scholar]
- 84.Goswami M., Das A.M. Synthesis of cellulose impregnated copper nanoparticles as an efficient heterogeneous catalyst for C–N coupling reactions under mild conditions. Carbohydr. Polym. 2017;195(November):189–198. doi: 10.1016/j.carbpol.2018.04.033. [DOI] [PubMed] [Google Scholar]
- 85.D’Souza S.L., Pati R.K., Kailasa S.K. Ascorbic acid functionalized gold nanoparticles as a probe for colorimetric and visual read-out determination of dichlorvos in environmental samples. Anal. Methods. 2014;6(22):9007–9014. doi: 10.1039/c4ay01004c. [DOI] [Google Scholar]
- 86.Yu Z., Wang W., Kong F., Lin M., Mustapha A. Cellulose nanofibril/silver nanoparticle composite as an active food packaging system and its toxicity to human colon cells. Int. J.Biol Macromol. 2019;129:887–894. doi: 10.1016/j.ijbiomac.2019.02.084. [DOI] [PubMed] [Google Scholar]
- 87.Oh S.Y., Yoo D.I., Shin Y., Seo G. FTIR analysis of cellulose treated with sodium hydroxide and carbon dioxide. Carbohydr. Res. 2005;340(3):417–428. doi: 10.1016/j.carres.2004.11.027. [DOI] [PubMed] [Google Scholar]
- 88.Gong J., Li J., Xu J., Xiang Z., Mo L. Research on cellulose nanocrystals produced from cellulose sources with various polymorphs. RSC Adv. 2017;7(53):33486–33493. doi: 10.1039/c7ra06222b. [DOI] [Google Scholar]
- 89.Kim U.J., Eom S.H., Wada M. Thermal decomposition of native cellulose: Influence on crystallite size. Polym. Degrad. Stab. May 2010;95(5):778–781. doi: 10.1016/j.polymdegradstab.2010.02.009. [DOI] [Google Scholar]
- 90.Peng Y., Gardner D.J., Han Y., Kiziltas A., Cai Z., Tshabalala M.A. Influence of drying method on the material properties of nanocellulose I: Thermostability and crystallinity. Cellul. Oct. 2013;20(5):2379–2392. doi: 10.1007/s10570-013-0019-z. [DOI] [Google Scholar]
- 91.Vanaja M., Annadurai G. Coleus aromaticus leaf extract mediated synthesis of silver nanoparticles and its bactericidal activity. Applied Nanoscience (Switzerland) 2013;3(3):217–223. doi: 10.1007/s13204-012-0121-9. [DOI] [Google Scholar]
- 92.Salavati-Niasari M., Davar F. Synthesis of copper and copper(I) oxide nanoparticles by thermal decomposition of a new precursor. Mater. Lett. 2009;63(3–4):441–443. doi: 10.1016/j.matlet.2008.11.023. [DOI] [Google Scholar]
- 93.Dang T.M.D., Le T.T.T., Fribourg-Blanc E., Dang M.C. Synthesis and optical properties of copper nanoparticles prepared by a chemical reduction method. Adv. Nat. Sci. Nanosci. Nanotechnol. 2011;2(1):015009–015015. doi: 10.1088/2043-6262/2/1/015009. [DOI] [Google Scholar]
- 94.El-Lateef H.M.A., Albokheet W.A., Gouda M. Carboxymethyl cellulose/metal (Fe, Cu and Ni) nanocomposites as non-precious inhibitors of C-steel corrosion in HCl solutions: synthesis, characterization, electrochemical and surface morphology studies. Cellul. Sep. 2020;27(14):8039–8057. doi: 10.1007/s10570-020-03292-6. [DOI] [Google Scholar]
- 95.Huang C., Rudnev A.V., Hong W., Wandlowski T. Break junction under electrochemical gating: testbed for single-molecule electronics. Chem. Soc. Rev. 2015;44(4):889–901. doi: 10.1039/c4cs00242c. [DOI] [PubMed] [Google Scholar]
- 96.Cichosz S., Masek A. Cellulose fibers hydrophobization via a hybrid chemical modification. Polymers (Basel) 2019;11(7) doi: 10.3390/polym11071174. [DOI] [PMC free article] [PubMed] [Google Scholar]
- 97.Foner H.A., Adan N. The characterization of papers by X-ray diffraction (XRD): measurement of cellulose crystallinity and determination of mineral composition. J. Forensic Sci. Soc. 1983;23(4):313–321. doi: 10.1016/S0015-7368(83)72269-3. [DOI] [Google Scholar]
- 98.Liu K.G., Abbasi A.R., Azadbakht A., Hu M.L., Morsali A. Deposition of silver nanoparticles on polyester fiber under ultrasound irradiations. Ultrason. Sonochem. 2017;34:13–18. doi: 10.1016/j.ultsonch.2016.04.006. [DOI] [PubMed] [Google Scholar]
Associated Data
This section collects any data citations, data availability statements, or supplementary materials included in this article.