

This study assesses process of care and health outcomes in people identified as minimal risk for coronary artery disease when testing is deferred.
Key Points
Question
Can diagnostic testing be safely deferred in low-risk patients with suspected coronary artery disease (CAD)?
Findings
In a randomized clinical trial, participants identified at minimal risk for CAD by the validated PROMISE Minimal Risk Score, a strategy of deferred testing, was safe with no death or myocardial infarction observed and fewer invasive catheterizations performed showing nonobstructive CAD compared with a usual testing strategy.
Meaning
These findings support the concept that deferred testing is safe in those identified as being at minimal risk for CAD, while reducing the number of low-yield diagnostic tests.
Abstract
Importance
Guidelines recommend deferral of testing for symptomatic people with suspected coronary artery disease (CAD) and low pretest probability. To our knowledge, no randomized trial has prospectively evaluated such a strategy.
Objective
To assess process of care and health outcomes in people identified as minimal risk for CAD when testing is deferred.
Design, Setting, and Participants
This randomized, pragmatic effectiveness trial included prespecified subgroup analysis of the PRECISE trial at 65 North American and European sites. Participants identified as minimal risk by the validated PROMISE minimal risk score (PMRS) were included.
Intervention
Randomization to a precision strategy using the PMRS to assign those with minimal risk to deferred testing and others to coronary computed tomography angiography with selective computed tomography-derived fractional flow reserve, or to usual testing (stress testing or catheterization with PMRS masked). Randomization was stratified by PMRS risk.
Main Outcome
Composite of all-cause death, nonfatal myocardial infarction (MI), or catheterization without obstructive CAD through 12 months.
Results
Among 2103 participants, 422 were identified as minimal risk (20%) and randomized to deferred testing (n = 214) or usual testing (n = 208). Mean age (SD) was 46 (8.6) years; 304 were women (72%). During follow-up, 138 of those randomized to deferred testing never had testing (64%), whereas 76 had a downstream test (36%) (at median [IQR] 48 [15-78] days) for worsening (30%), uncontrolled (10%), or new symptoms (6%), or changing clinician preference (19%) or participant preference (10%). Results were normal for 96% of these tests. The primary end point occurred in 2 deferred testing (0.9%) and 13 usual testing participants (6.3%) (hazard ratio, 0.15; 95% CI, 0.03-0.66; P = .01). No death or MI was observed in the deferred testing participants, while 1 noncardiovascular death and 1 MI occurred in the usual testing group. Two participants (0.9%) had catheterizations without obstructive CAD in the deferred testing group and 12 (5.8%) with usual testing (P = .02). At baseline, 70% of participants had frequent angina and there was similar reduction of frequent angina to less than 20% at 12 months in both groups.
Conclusion and Relevance
In symptomatic participants with suspected CAD, identification of minimal risk by the PMRS guided a strategy of initially deferred testing. The strategy was safe with no observed adverse outcome events, fewer catheterizations without obstructive CAD, and similar symptom relief compared with usual testing.
Trial Registration
ClinicalTrials.gov Identifier: NCT03702244
Introduction
In people presenting with stable chest pain or other symptoms suggestive of coronary artery disease (CAD), functional stress testing or anatomic coronary imaging is often performed as an initial evaluation step. However, the yield of initial testing is low. In 1 observational study examining test results for suspected CAD,1 the prevalence of inducible ischemia was only 5%. In the Prospective Multicenter Imaging Study for the Evaluation of Chest Pain (PROMISE), among more than 10 000 participants with suspected CAD who had an intermediate pretest likelihood, less than 12% of initial studies were positive for significant CAD or ischemia.2
The current American Heart Association/American College of Cardiology3 and European Society of Cardiology4 guidelines on evaluation of chest pain recommend initial categorization by a contemporary pretest probability model, and if a low likelihood of obstructive CAD is identified, the guidelines recommend that diagnostic testing can be deferred. These recommendations are based on the internal and external epidemiologic validity of the prediction models and the favorable prognosis associated with low pretest likelihood among tested participants. However, to our knowledge, no prospective randomized trial to date has defined and evaluated an actual strategy of deferred testing and its impact on outcomes or symptoms. Moreover, the guideline recommendations do not explicitly incorporate shared-decision making to account for patient preference, as deferral of testing based on a low pretest likelihood may be reassuring, or alternatively, it may not allay anxiety as might a normal testing result.
Using PROMISE trial data, we developed and validated 1 of the guideline-recommended contemporary pretest probability tools, the PROMISE minimal risk score (PMRS), to identify people at very low risk of obstructive CAD or outcome events5 and validated the score in 2 external data sets.6,7 The Prospective Randomized Trial of the Optimal Evaluation of Cardiac Symptoms and Revascularization (PRECISE) was designed to compare processes of care and outcomes in stable symptomatic people with suspected CAD whose physicians recommended testing8 using the PMRS to assign deferred testing to minimal-risk participants (with consent) and to assign those with nonminimal risk to coronary computed tomographic (CT) angiography (cCTA) with provisional CT-derived fractional flow reserve (FFR-CT [cCTA±FFR-CT]). Participants randomized to a strategy of usual testing received stress testing or catheterization according to clinician preference. The randomization was stratified by the PMRS, thus enabling a rigorous and novel prospective comparison of deferred testing with usual testing among the subgroup of enrolled PRECISE trial participants identified as being at minimal risk. This prespecified secondary analysis reports the detailed comparison of outcomes and symptom changes in this subgroup randomized with the distinct evaluation strategies.
Methods
Trial Design and Oversight
PRECISE was a prospective, randomized clinical pragmatic evaluation strategy trial,8,9 conducted according to protocol and overseen by an independent data and safety monitoring board and the PRECISE steering committee. The study protocol and statistical analysis plan are provided in Supplement 4 and Supplement 5. Operations were comanaged by the Duke Clinical Research Institute and the sponsor (HeartFlow). The protocol was approved by the appropriate regulatory bodies for each coordinating center and participating site (detailed in Supplement 4). All participants provided written informed consent, which included an explanation of the possibility of deferred testing should the participant be identified at minimal risk and randomized to the precision strategy.
Population Sample and Randomization
Participants included adults without known CAD with stable typical (cardiac) or atypical (possibly cardiac) symptoms and suspected CAD enrolled at 65 North American and European sites. Unstable patients and those with recent (less than 1 year) CAD testing or with cCTA contraindications were excluded. A complete list of inclusion and exclusion criteria has been published.8
After providing consent, participants were randomly assigned 1:1 to the precision strategy or to the usual testing strategy. Randomization was stratified by site, intended first test (if randomized to usual testing), and minimal vs elevated risk as determined by the PMRS.5 Precision strategy participants were prospectively assigned to deferred testing using a PMRS value of more than 0.46 (higher scores indicate lower risk). This cut point represented the top decile of low risk among the PROMISE trial participants5 and was chosen to represent approximately 20% of PRECISE participants assumed in the trial design. Individuals with known atherosclerosis, such as vascular calcification on chest CT or known peripheral vascular disease, who were randomized to the precision strategy were assigned to receive cCTA+/−FFR-CT. Testing was allowed at any time if the clinical situation required it; protocol-directed testing was to be cCTA with selective FFR-CT. Among usual testing participants, site clinicians chose the initial testing modality, including functional stress testing or catheterization. Participants randomized to usual testing, as well as their clinicians and site team, were masked to the PMRS. All testing was performed at sites according to local protocols and care decisions were made locally, consistent with the pragmatic nature of the trial. Guideline-directed medical management was recommended for all. Trial end points were adjudicated by a masked clinical events committee.
Trial End Points
Follow-up was for 12 months. The centrally adjudicated primary end point was a composite of all-cause death, nonfatal myocardial infarction (MI), and catheterization without obstructive CAD, the last of which has been used in other studies and trials often as a secondary end point and more recently as a component of a primary end point.2,10,11 Obstructive CAD was defined as the presence of a stenosis with an FFR of 0.80 or less or an instantaneous wave-free ratio of 0.89 or less, or if not performed, any stenosis 50% or more on quantitative coronary angiography in a vessel 2 mm or more diameter. Secondary end points included anginal symptoms assessed by the Seattle Angina Questionnaire (SAQ)12 and health status assessed by the EuroQol-5D-5L (EQ5D-5L).13
Statistical Analysis
For the main trial, 2096 participants were estimated to provide 90% or more power to detect a 37.5% reduction in the primary end point in the precision strategy compared with usual testing and a 2-sided α of 0.05. Relevant to the current analysis, it was assumed based on previous trials that 20% of precision participants would be identified as at minimal risk and assigned to deferred testing with 30% of those participants later undergoing downstream testing based on ongoing or worsening symptoms. Baseline characteristics of the participants with minimal risk and testing results were reported as means (SDs) or medians (25th, 75th percentiles) for continuous variables and as counts (percentages) for categorical variables.
Primary treatment comparisons for the participants identified as minimal risk and randomized were performed as intention to treat with a time-to-first-event analysis using the log-rank test.14 Kaplan-Meier event rates were estimated at the end of follow-up15 with event or censoring times measured from the time of randomization. Relative treatment effect-size was quantified using hazard ratios (HRs) with associated 95% CIs estimated using Cox proportional hazards models.16 Proportional hazards assumptions were checked by examining treatment by log(time) interaction terms and by Schoenfeld residuals.17 For this prespecified secondary analysis in the minimal risk subgroup, statistical significance was determined at the nominal .05 level. P values for comparing the nonfatal components of the primary endpoint between groups were generated by fitting the Fine-Gray proportional hazards model. Adjusted HRs and 95% CIs were estimated using Cox proportional hazards models including age, sex, and CAD equivalent (diabetes, peripheral artery disease, or cerebrovascular disease).
Prevalence of frequent angina (measured by an SAQ angina frequency score of 80 or less) was reported with counts (percentages) at 45 days and 6 months and 12 months, and compared between groups using the Cochran-Mantel-Haenszel test, stratified by frequent angina at baseline. The overall SAQ summary score, SAQ angina frequency score, and EQ5D-5L utility score (using US population weights) were reported with the mean (SD) at baseline and follow-up time points and compared between groups using the Wilcoxon rank sum test. For each quality-of-life score, the mean (95% CI) change from baseline to 1 year was assessed and compared between groups by fitting a repeated-measures model. Medication use was reported with counts (percentages) and compared between groups using the Cochran-Mantel-Haenszel test, stratified by baseline medication use. All analyses used SAS software, version 9.4 (SAS Institute).
Results
Participants and Baseline Characteristics
The PRECISE main trial enrolled 2103 participants from December 3, 2018, to May 18, 2021, at 65 sites; follow-up was completed on May 20, 2022. Of those enrolled, 422 participants were identified to be at minimal risk by the PMRS (20%) and were randomized to the protocol-directed precision strategy of deferral of initial testing (n = 214) or to usual testing (n = 208). Baseline characteristics are shown in Table 1. Mean (SD) age was 46 (8.6) years and 304 were women (72%). The mean (SD) updated Diamond-Forrester pretest probability scores were 7.1 (4.0) and 7.5 (3.6) in the precision strategy and the usual testing groups, respectively. Baseline characteristics of all minimal risk compared with elevated risk participants are shown in eTable in Supplement 1.
Table 1. Participant Baseline Characteristics.
| Variable | Minimal risk, No./total No. | |
|---|---|---|
| Deferred testing arm (n = 214) | Usual testing arm (n = 208) | |
| Age, mean (SD), ya | 45.2 (8.7) | 46.0 (8.5) |
| Sexa | ||
| Male | 67/214 (31.3) | 51/208 (24.5) |
| Female | 147/214 (68.7) | 157/208 (75.5) |
| Race and ethnicitya,b | ||
| White/non-Hispanic | 160/214 (74.8) | 153/208 (73.6) |
| Other | 54/214 (25.2) | 55/208 (26.4) |
| Body mass index, mean (SD) | 30.4 (7.8) | 29.6 (7.2) |
| Cardiovascular risk factor history | ||
| Diabetesa | 18/214 (8.4) | 19/208 (9.1) |
| Dyslipidemiaa | 68/214 (31.8) | 71/208 (34.1) |
| Family history of premature (younger than 55 y) coronary artery diseasea | 74/214 (34.6) | 72/208 (34.6) |
| Hypertensiona | 67/214 (31.3) | 59/208 (28.4) |
| Current/former smokera | 78/214 (36.4) | 67/208 (32.2) |
| Risk scores | ||
| PROMISE minimal risk score | ||
| Mean (SD) | 0.628 (0.127) | 0.638 (0.128) |
| Median (IQR) | 0.595 (0.521-0.705) | 0.616 (0.531-0.726) |
| Updated Diamond-Forrester Euro 2019 pretest probability score, mean (SD) | 7.1 (4.0) | 7.5 (3.6) |
| PCE 10-year risk score, mean (SD) | 2.62 (2.26) | 2.25 (2.17) |
| Primary symptom | ||
| Chest pain/pressure/tightness—substernal or left anterior | 174/214 (81.3) | 164/208 (78.8) |
| Chest pain/pressure/tightness—other location | 21/214 (9.8) | 19/208 (9.1) |
| Arm or shoulder pain | 5/214 (2.3) | 0/208 |
| Back pain | 1/214 (0.5) | 0/208 |
| Dizziness/lightheaded | 1/214 (0.5) | 1/208 (0.5) |
| Epigastric pain/abdominal pain | 1/214 (0.5) | 4/208 (1.9) |
| Palpitations | 4/214 (1.9) | 10/208 (4.8) |
| Shortness of breath/dyspnea | 7/214 (3.3) | 10/208 (4.8) |
| Symptoms related to physical/mental stressa | ||
| Yes, occurs with mild exertion/mild stress | 41/214 (19.2) | 34/208 (16.3) |
| Yes, occurs with moderate exertion/moderate stress | 40/214 (18.7) | 48/208 (23.1) |
| Yes, occurs with strenuous exertion/severe stress | 8/214 (3.7) | 7/208 (3.4) |
| No, unrelated to exertion or stress | 115/214 (53.7) | 108/208 (51.9) |
| Unknown | 10/214 (4.7) | 11/208 (5.3) |
| Site characterization of the primary symptom | ||
| Typical angina | 34/214 (15.9) | 33/208 (15.9) |
| Atypical | 143/214 (66.8) | 145/208 (69.7) |
| Noncardiac pain | 7/214 (3.3) | 1/208 (0.5) |
| Dyspnea | 9/214 (4.2) | 11/208 (5.3) |
| Unable to characterize | 21/214 (9.8) | 18/208 (8.7) |
| Systolic blood pressure, mean (SD), mm Hg | 127.5 (14.8) | 125.2 (13.8) |
| Diastolic blood pressure, mean (SD), mm Hg | 78.7 (10.4) | 78.1 (10.4) |
Abbreviation: PCE, pooled cohort equations.
Characteristics included in the PROMISE minimal risk score.
Racial or ethnic minority group was self-reported by the participant. To protect participants’ privacy, we collected race and ethnicity data as White/non-White or Hispanic/non-Hispanic. We have summarized these data as White/non-Hispanic or other (ie, either non-White or Hispanic).
Initial and Downstream Testing
The flow of participants is presented in the Figure and details on testing in the randomization groups are presented in Table 2. Among the 214 minimal-risk participants randomized to the deferred testing strategy, 138 did not undergo testing at any time during the trial follow-up (64%). Downstream testing was performed in 76 of the 214 participants randomized to the deferred initial testing strategy (36%) with 52 participants undergoing cCTA±FFR-CT (24%), 23 undergoing a functional test (11%), and 1 referred directly for invasive coronary angiography (0.5%). The reasons for testing in this group are presented in Table 2 and included worsening symptoms (30%), uncontrolled symptoms (10%), or new symptoms (6%), or changing clinician preference (19%) or participant preference (10%). In the 76 participants referred for testing, the test took place at a median [Q1, Q3] of 48 [15, 78] days after randomization. Neither obstructive CAD nor inducible ischemia were present in 96% of these initial tests.
Figure. CONSORT Diagram.
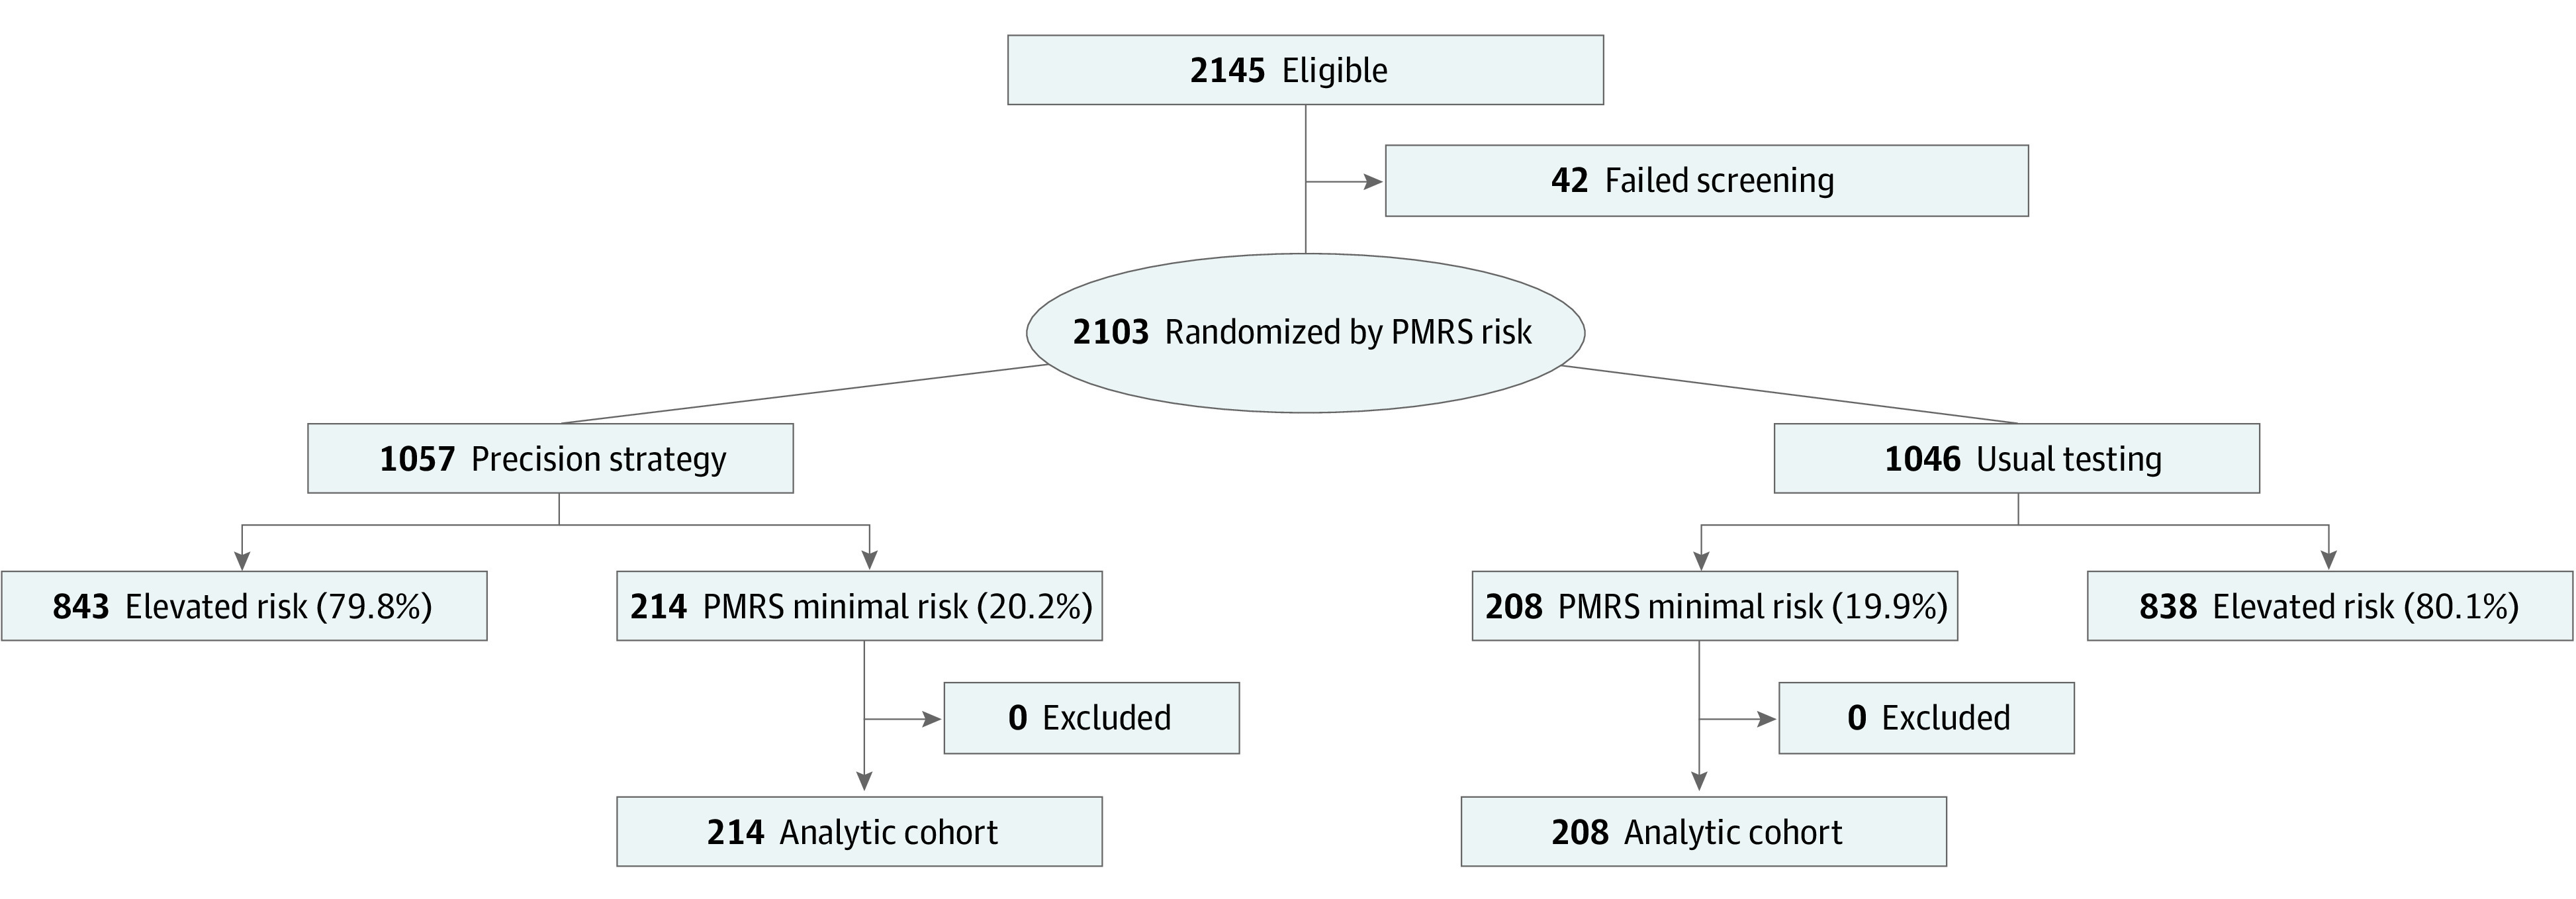
Flow of participants through the trial, the testing modalities performed, and the completeness of follow-up. PMRS indicates PROMISE minimal risk score.
Table 2. Diagnostic Testing.
| Variable | Minimal risk, No./total No. | |
|---|---|---|
| Deferred testing arm (n = 214) | Usual testing arm (n = 208) | |
| First diagnostic test performed, as initial test | ||
| No diagnostic test performed during follow-up | 138/214 (64.5) | 26/208 (12.5) |
| Coronary angiography without noninvasive testing | 1/214 (0.5) | 7/208 (3.4) |
| Any functional NI test (excludes cCTA) | 23/214 (10.7) | 172/208 (82.7) |
| Stress cardiac MRI | 1/214 (0.5) | 15/208 (7.2) |
| Stress echocardiography | 10/214 (4.7) | 70/208 (33.7) |
| Stress nuclear perfusion | 6/214 (2.8) | 50/208 (24.0) |
| Treadmill ECG without imaging | 6/214 (2.8) | 37/208 (17.8) |
| cCTA±FFR-CT | 52/214 (24.3) | 3/208 (1.4) |
| cCTA with FFR-CTa | 6/214 (2.8) | 0/208 (0) |
| cCTA without FFR-CT | 46/214 (21.5) | 3/208 (1.4) |
| CAC only | 1 | 0 |
| Time to first diagnostic test performed (days since randomization) | ||
| Mean (SD) | 71.0 (81.9) | 22.9 (25.1) |
| Median (IQR) | 48.0 (14.5-77.5) | 15.0 (7.0-30.0) |
| Reason for downstream testing, low risk precision care, nonmissing data | 67/214 (31.3%) | |
| New symptoms | 4/67 (6.0) | NA |
| Worsening current symptoms | 20/67 (29.9) | NA |
| Symptoms not controlled by medication | 7/67 (10.4) | NA |
| Clinician decision | 13/67 (19.4) | NA |
| Participant decision | 7/67 (10.4) | NA |
| Other reasons | 16/67 (23.9) | NA |
| All diagnostic test results, No. | 76 | 182 |
| Positive | 2/76 (2.6) | 11/182 (6.0) |
| Negative | 73/76 (96.1) | 169/182 (92.9) |
| Indeterminate | 1/76 (1.3) | 2/182 (1.1) |
| cCTA±FFR-CT | 52 | 3 |
| Positive for obstructive CAD | 2/52 (3.8) | 0/3 |
| Negative | 50/52 (96.2) | 3/3 (100.0) |
| Indeterminate | 0/52 | 0/3 |
| Stress cardiac MRI | 1 | 15 |
| Positive for ischemia | 0/1 | 1/15 (6.7) |
| Negative | 1/1 (100.0) | 14/15 (93.3) |
| Indeterminate | 0/1 | 0/15 |
| Stress echocardiography | 10 | 70 |
| Positive for ischemia | 0/10 | 2/70 (2.9) |
| Negative | 10/10 (100.0) | 68/70 (97.1) |
| Indeterminate | 0/10 | 0/70 |
| Stress nuclear perfusion (MPI or PET) | 6 | 50 |
| Positive for ischemia | 0/6 | 6/50 (12.0) |
| Negative | 6/6 (100.0) | 43/50 (86.0) |
| Indeterminate | 0/6 | 1/50 (2.0) |
| Treadmill ECG without imaging | 6 | 37 |
| Positive for ischemia | 0/6 | 2/37 (5.4) |
| Negative | 5/6 (83.3) | 34/37 (91.9) |
| Indeterminate | 1/6 (16.7) | 1/37 (2.7) |
| ICA as an initial test | 1 | 7 |
| Positive for obstructive CAD | 0/1 | 0/7 |
| Negative | 1/1 (100.0) | 7/7 (100.0) |
| Indeterminate | 0/1 | 0/7 |
Abbreviations: CAC, coronary artery calcium scoring; CAD, coronary artery disease; cCTA, coronary computed tomographic angiography; ECG, electrocardiogram; FFR-CT, computed tomography-derived fractional flow reserve; ICA, invasive coronary angiography; MPI, myocardial perfusion imaging; MRI, magnetic resonance imaging; NA, not applicable; NI, noninvasive; PET, positron emission tomography.
FFRCT was recommended in 30% to 90% lesions.
For the 208 participants randomized to usual testing, 172 had an initial functional stress test (83%), 7 were referred directly to invasive coronary angiography (3%), 3 underwent cCTA±FFR-CT (1.4%), and 26 did not have any testing (13%) (the latter 2 categories were protocol deviations). In this group, the initial testing directed by protocol occurred at a median (Q1, Q3) of 15 (7, 30) days after randomization. Neither obstructive CAD nor inducible ischemia were present in 93% of initial tests. Among the participants who underwent invasive angiography as an initial test (7 in the usual testing arm and 1 in the precision arm), none had obstructive CAD.
Primary End Point
The deferred testing participants in the precision arm and the usual testing arm had follow-up for a median (Q1, Q3) of 11.7 (95% CI, 11.3-12.5) and 12.0 (95% CI, 11.3-12.6) months, respectively. The primary end point results and its components are reported in Table 3 and depicted in eFigure in Supplement 1. The composite of all-cause death, nonfatal MI, or catheterization without obstructive CAD occurred in 2 participants in the deferred testing arm (0.9%) and 13 participants in the usual care arm (6.3%). The Kaplan-Meier event rates at the end of follow-up were 0.9 (95% CI, 0.2-3.7) and 8.0 (95% CI, 4.1-15.2) for deferred and usual testing, respectively (P = .004). In an unadjusted Cox model of time to the composite primary end point, the HR for the deferred testing (precision) arm compared with the usual testing group was 0.15 (95% CI, 0.03-0.66; P = .01). The adjusted HR was 0.16 (95% CI, 0.04-0.70;P = .02).
Table 3. Primary End Point and Components.
| Variable | Deferred testing arm (N = 214) | Usual testing arm (N = 208) | P valuea |
|---|---|---|---|
| Primary end pointb | |||
| No. of first events | 2 | 13 | NA |
| Follow-up (months from randomization) | 2323.7 | 2215.5 | |
| Rate, events per 100 patient yrs | 1.0 | 7.0 | |
| Kaplan-Meier rate with 95% CI at study end | |||
| No. of first events/No. of patients | 2/214 | 13/208 | .004 |
| Kaplan-Meier event rate (95% CI) | 0.9 (0.2-3.7) | 8.0 (4.1-15.2) | |
| Death | |||
| No. of events | 0 | 1 | |
| Follow-up (mos from randomization) | 2337.7 | 2331.6 | |
| Rate, events per 100 patient yrs | NA | 0.5 | NA |
| Primary cause | |||
| Cardiovascular | 0 | 0 | |
| Noncardiovascular | 0 | 1 | |
| Kaplan-Meier rate with 95% CI at study end | |||
| No. of first events/No. of patients | 0/214 | 1/208 | |
| Kaplan-Meier event rate (95% CI) | NA | 0.5 (0.1-3.8) | |
| Nonfatal myocardial infarction | |||
| No. of first events | 0 | 1 | NA |
| Follow-up (months from randomization) | 2337.7 | 2331.6 | |
| Rate, events per 100 patient yrs | NA | 0.5 | |
| Cumulative incidence rate with 95% CI at study end | NA | NA | |
| No. of events/No. of patients | 0/214 | 1/208 | |
| Cumulative incidence rate (95% CI) | NA | 2.3 (0.2-10.4) | |
| Invasive cardiac catheterization without obstructive CAD | |||
| No. | 2 | 12 | NA |
| Follow-up (months from randomization) | 2323.7 | 2215.5 | |
| Rate, per 100 patient years | 1.0 | 6.5 | |
| Cumulative incidence rate with 95% CI at study end | NA | NA | |
| No. of occurrences/No. of patients | 2/214 | 12/208 | .02 |
| Cumulative incidence rate (95% CI) | 0.9 (0.2-3.1) | 5.9 (3.2-9.7) |
The P value for the Kaplan-Meier rates is the log-rank test and for the cumulative incidence rates is the Fine-Gray test.
Primary end point is defined as the composite of 3 patient outcomes as the time to first occurrence during trial follow-up of all-cause death, nonfatal myocardial infarction, or invasive cardiac catheterization without obstructive coronary artery disease.
No cases of death or nonfatal MI were observed in the deferred testing participants. One death (noncardiovascular) and 1 nonfatal MI occurred in the usual testing group. There were 2 invasive catheterizations without obstructive CAD in the deferred testing group and 12 in the usual testing group (P = .02). Given the very low number of death/MI events, the early and sustained separation of the curves shown in the eFigure in Supplement 1 is driven by the invasive catheterizations without obstructive CAD component of the end point.
Secondary End Points
Changes in angina frequency are shown in Table 4. Based on the SAQ, 70% of the participants had frequent angina at baseline. There was similar reduction of the percentage of participants scored as having frequent angina across the course of the follow-up between the 2 groups. In the deferred testing compared with the usual testing arms, frequent angina was present in 83 (46%) and 67 (37%) at 45 days, 41 (25%) and 42 (26%) at 6 months, and 30 (19%) and 27 (17%) at 12 months after randomization, respectively. SAQ Summary and Angina Frequency Scores improved in both groups with no difference in between-group changes over 1 year. There were no differences between the groups in overall health status as assessed by the EQ5D-5L with similar small favorable changes in both groups (Table 4). Changes in anti-anginal medications are shown in eTable 2 in Supplement 1. There were minimal changes and no differences between the groups.
Table 4. Angina Frequency and Health Statusa.
| Variable | Minimal risk No./total No. | P value | |
|---|---|---|---|
| Deferred testing arm (n = 214) | Usual testing arm (n = 208) | ||
| SAQ prevalence of frequent anginab | |||
| Frequent angina at baseline | 146/208 (70.2) | 139/208 (66.8) | NA |
| Frequent angina at day 45 | 83/180 (46.1) | 67/179 (37.4) | .18 |
| Frequent angina at 6 mo | 41/162 (25.3) | 42/162 (25.9) | .63 |
| Frequent angina at 12 mo | 30/157 (19.1) | 27/156 (17.3) | .83 |
| SAQ Summary Score, mean (SD), No. | |||
| Baseline SAQS | 70.9 (13.4), 208 | 69.8 (14.9), 208 | .61 |
| SAQS at 45 d | 80.3 (16.0), 180 | 82.1 (15.7), 179 | .39 |
| SAQS at 6 mo | 88.4 (13.8), 162 | 88.3 (12.6), 162 | .43 |
| SAQS at 1 y | 89.2 (14.0), 157 | 89.0 (15.2), 156 | .89 |
| Change from baseline at 1 yc | 17.9 (15.5-20.3) | 18.7 (16.2-21.3) | |
| P value | ≤.001 | ≤.001 | |
| Difference in 1-y change between groups | −0.8 (−4.3 to 2.6) | .63 | |
| SAQ Angina frequency score, mean (SD), No. | |||
| Baseline SAQAF | 74.4 (16.0), 208 | 74.9 (15.6), 208 | .83 |
| SAQAF at 45 d | 85.8 (15.1), 180 | 87.0 (14.9), 179 | .38 |
| SAQAF at 6 mos | 91.3 (13.2), 162 | 91.5 (13.0), 162 | .82 |
| SAQAF at 1 y | 92.4 (14.3), 157 | 93.0 (12.9), 156 | .95 |
| Change from baseline at 1 yc | 17.7 (14.9 to 20.5) | 17.78 (15.2 to 2.4) | NA |
| P value | ≤.001 | ≤.001 | NA |
| Difference in 1-y change between groups | −0.1 (−3.9 to 3.7) | .96 | |
| SAQ Physical Limitation Score, mean (SD), No. | |||
| Baseline SAQPL | 85.8 (14.8), 205 | 86.0 (16.0), 197 | .60 |
| SAQPL at 45 d | 90.2 (14.0), 164 | 9.1 (13.9), 172 | .84 |
| SAQPL at 6 mos | 94.5 (10.6), 153 | 93.4 (12.2), 159 | .68 |
| SAQPL at 1 y | 94.4 (11.0), 152 | 94.4 (11.6), 151 | .75 |
| Change from baseline at 1 yc | 7.9 (5.8 to 10.1) | 8.1 (5.6 to 1.6) | NA |
| P value | ≤.001 | ≤.001 | NA |
| Difference in 1-y change between groups | −0.12 (−3.41 to 3.16) | .94 | |
| SAQ Quality of Life Score, mean (SD), No. | |||
| Baseline SAQQL | 52.8 (22.1), 208 | 5.5 (23.0), 208 | .28 |
| SAQQL at 45 d | 67.2 (24.1), 180 | 7.3 (25.2), 179 | .15 |
| SAQQL at 6 mos | 80.2 (21.5), 162 | 8.4 (19.9), 162 | .66 |
| SAQQL at 1 y | 81.2 (21.7), 157 | 81.3 (22.6), 156 | .78 |
| Change from baseline at 1 yc | 28.0 (24.2 to 31.9) | 3.3 (26.4 to 34.2) | NA |
| P value | ≤.001 | ≤.001 | NA |
| Difference in 1 y change between groups | −2.3 (−7.7 to 3.2) | .42 | |
| EQ5D-5L Summary score, mean (SD), No. | |||
| Baseline EQ5D-5L | 0.82 (0.12), 208 | 0.82 (0.13), 208 | .95 |
| EQ5D-5L at 45 d | 0.84 (0.14), 180 | 0.84 (0.15), 179 | .76 |
| EQ5D-5L at 6 mos | 0.89 (0.13), 162 | 0.87 (0.14), 162 | .15 |
| EQ5D-5L at 1 y | 0.88 (0.14), 158 | 0.89 (0.14), 155 | .72 |
| Change from baseline at 1 yc | 0.06 (0.04 to 0.08) | 0.06 (0.01 to 0.09) | NA |
| P value | ≤.001 | ≤.001 | NA |
| Difference in 1-y change between groups | −0.01 (−0.04 to 0.03) | .77 | |
Abbreviations: EQ5D-5L, EuroQuol-5D; NA, not applicable; SAQ, Seattle Angina Questionnaire; SAQS, Seattle Angina Questionnaire Summary Score; SAQAF, Seattle Angina Questionnaire Angina Frequency Score; SAQPL, preoperative scores in the physical limitation.
P values represent testing for difference in prevalence of frequent angina at each time point.
SAQ and EQ5D-5L Model-Based Estimates. P values test hypotheses of no change within each group/no difference in change between groups.
For SAQ, higher scores associated with fewer symptoms. Frequent angina was defined as a SAQAF score less than 80. EQ5D-5L utility scores anchored at 0 for death and 1 for perfect health.
Invasive catheterization was performed during follow-up in 3 participants in the precision arm of whom 1 underwent revascularization (1.4%) (yield of 33% of those undergoing catheterization, 0.5% of those randomized; eTable 3 in Supplement 1). In the usual testing arm, 13 participants underwent invasive catheterization of whom 1 underwent revascularization (6.3%) (yield of 7.7% of those undergoing catheterization, 0.5% of those randomized).
Additional End Points
Two participants in the precision strategy group and 1 in the usual testing group had an unplanned cardiovascular hospitalization. Cumulative 12-month radiation exposure from electrical cardioversion testing and procedures was 1.9 (4.2) mSv in the precision strategy arm and 3.1 (5.2) mSv in the usual testing arm (P = .09).
Discussion
This prespecified secondary analysis of the PRECISE trial showed that the strategy of deferred testing among participants identified as minimal risk by the PMRS was safe with no observed deaths or nonfatal MIs over 1 year of follow-up. There were fewer invasive catheterizations without obstructive CAD compared with the usual testing group with fewer catheterizations performed overall and a similarly low number of revascularizations in each group (0.5%). Diminution in symptoms over the year postrandomization was similar between groups and changes in health status as assessed by the EQ5D-5L were similar, despite most participants in the deferred testing group never having a diagnostic test.
Guidelines from the US and Europe concordantly recommend deferral of testing in those identified as low risk for CAD.3,4,18 These recommendations are based on the presumed low yield of testing and low event rates of such patients after testing. Yet, to our knowledge, no trial has prospectively defined and tested such a strategy, including whether patients or their clinicians would consent to defer testing. Furthermore, no trial has evaluated how the presenting symptoms evolved or diminished if no initial evaluation with diagnostic testing was performed. Thus, these data provide novel evidence to support the concept and practice of deferred initial testing in low-risk patients with stable symptoms.
Among those assigned to the precision strategy of deferred initial testing, 36% eventually were referred for a test, at a median time of 48 days after randomization, for new, worsening, or uncontrolled symptoms or by clinician or participant decision. It is important to note that a strategy of deferred testing refers to the initial strategy and it would be anticipated that some patients would warrant further evaluation downstream. When tests were performed in this group, results showed no evidence of CAD or ischemia in 96%.
Current guideline recommendations on testing deferral are based almost solely on the probability of finding or not finding obstructive CAD and are silent on the implications for the symptoms experienced by the patient. Here, we reported that symptom diminution as assessed by the SAQ was similar in those randomized to defer testing compared with those managed after usual testing. Changes in anti-anginal medications were similar and minimal between the randomization groups across the course of the follow-up. That symptoms of possible angina could abate over time is consistent with the report from Mesnier and colleagues19 who reported that among over 7000 patients with known CAD and anginal symptoms, 84% had symptom resolution over time in the absence of revascularization or changes in medical therapies.
Recommendations to defer testing in current guidelines based on probability estimates do not incorporate the perspective of the patient, who may be reassured by a score-quantified low probability of CAD and deferred testing, or who may desire further evaluation for reassurance. In this trial, participants consenting to trial enrollment were aware that should they be randomized to the precision arm and identified by the PMRS as being at minimal risk, testing would be deferred. This approach would anticipate a shared decision-making discussion in practice and may offer reassurance in the future to both patients and their physicians regarding the safety and efficiency of the deferral approach.
Many risk models or scores have been developed for cardiovascular diseases.7 Most are not well validated in external data sets.20 Fewer still are prospectively tested in trials for their potential to improve management decision-making and clinical care. The Global Registries of Acute Coronary Events risk score is well validated for risk prediction in patients with acute coronary syndromes.21,22 Yet, when incorporated into a randomized trial of patients with acute coronary syndrome to assess its utility, there was no effect on a composite of multiple dimensions of care quality.23 In the present study, the PMRS successfully enabled selection of participants for deferred testing and was associated with several measures reflecting improved clinical care, compared with a strategy without its use.
Limitations
There are certain limitations to our study that must be considered. First, the PMRS cut point was chosen prospectively by trial leadership after a review of outcomes in low-risk patients with chest pain, with the expectation that approximately 20% of participants would be categorized as minimal risk. It was felt there was equipoise for deferred testing in this proportion of participants, given that this strategy had never been tested before. Whether other cut points to differentiate minimal from elevated risk would perform similarly cannot be evaluated retrospectively. Second, the observation of no deaths or nonfatal MIs in the minimal-risk participants randomized to deferred testing does not mean that no such events would ever be seen in a larger population. By the clinical trial rule of 3, observing no events in a sample of 224 participants rules out with 95% CI an event rate more than 1.3%.24 Third, we did not capture information to understand the reasons associated with symptom reduction, such as testing that may have been done to pursue alternative noncardiac diagnoses. Fourth, we do not have information on those who may have declined participation in the trial based on the possibility of being assigned to deferred testing.
Conclusion
Hence, in symptomatic people with suspected CAD, identification of individuals at minimal risk for obstructive CAD and outcome events by the PMRS enabled a strategy of initial deferred testing with patient consent. In this trial, the strategy was safe with no observed adverse outcome events, fewer invasive catheterizations without significant CAD, and fewer low-yield noninvasive tests compared with a usual testing strategy. Symptoms diminished over time to a similar degree as the alternative strategy of initial functional testing or catheterization. When downstream testing was performed, for ongoing, new, or worsened symptoms or changing clinician or participant decision in those who initially deferred testing, results were negative 96% of the time. The data provide randomized trial and outcome-based evidence to robustly support existing guideline recommendations on deferral of testing for low-risk individuals, which are currently based solely on risk tool probability estimates. Implementation of this approach has the potential to safely reduce very low-yield testing and improve care and the efficiency of testing for suspected CAD.
eTable 1. Baseline Characteristics in Minimal-Risk vs Elevated-Risk Participants in the PRECISE Trial
eTable 2. Medication Use at Each Visit, Stratified by Baseline Use
eTable 3. Participants Identified as Minimal Risk by the PROMISE Minimal Risk Score with Significant or Severe Initial Test Findings
eFigure. Kaplan–Meier Estimates of the Composite Primary Endpoint as a Function of Time after Randomization
Nonauthor collaborators
Data sharing statement
Trial protocol
Statistical analysis plan
Statistical analysis plan addendum
References
- 1.Rozanski A, Gransar H, Hayes SW, et al. Temporal trends in the frequency of inducible myocardial ischemia during cardiac stress testing: 1991 to 2009. J Am Coll Cardiol. 2013;61(10):1054-1065. doi: 10.1016/j.jacc.2012.11.056 [DOI] [PubMed] [Google Scholar]
- 2.Douglas PS, Hoffmann U, Patel MR, et al. ; PROMISE Investigators . Outcomes of anatomical versus functional testing for coronary artery disease. N Engl J Med. 2015;372(14):1291-1300. doi: 10.1056/NEJMoa1415516 [DOI] [PMC free article] [PubMed] [Google Scholar]
- 3.Gulati M, Levy PD, Mukherjee D, et al. 2021 AHA/ACC/ASE/CHEST/SAEM/SCCT/SCMR Guideline for the Evaluation and Diagnosis of Chest Pain: a report of the American College of Cardiology/American Heart Association Joint Committee on Clinical Practice Guidelines. Circulation. 2021;144(22):e368-e454. doi: 10.1161/CIR.0000000000001029 [DOI] [PubMed] [Google Scholar]
- 4.Knuuti J, Wijns W, Saraste A, et al. ; ESC Scientific Document Group . 2019 ESC Guidelines for the diagnosis and management of chronic coronary syndromes. Eur Heart J. 2020;41(3):407-477. doi: 10.1093/eurheartj/ehz425 [DOI] [PubMed] [Google Scholar]
- 5.Fordyce CB, Douglas PS, Roberts RS, et al. ; Prospective Multicenter Imaging Study for Evaluation of Chest Pain (PROMISE) Investigators . Identification of patients with stable chest pain deriving minimal value from noninvasive testing: the PROMISE minimal-risk tool, a secondary analysis of a randomized clinical trial. JAMA Cardiol. 2017;2(4):400-408. doi: 10.1001/jamacardio.2016.5501 [DOI] [PMC free article] [PubMed] [Google Scholar]
- 6.Adamson PD, Fordyce CB, McAllister DA, Udelson JE, Douglas PS, Newby DE. Identification of patients with stable chest pain deriving minimal value from coronary computed tomography angiography: An external validation of the PROMISE minimal-risk tool. Int J Cardiol. 2018;252:31-34. doi: 10.1016/j.ijcard.2017.09.033 [DOI] [PMC free article] [PubMed] [Google Scholar]
- 7.Rasmussen LD, Fordyce CB, Nissen L, et al. The PROMISE Minimal Risk Score improves risk classification of symptomatic patients with suspected CAD. JACC Cardiovasc Imaging. 2022;15(8):1442-1454. doi: 10.1016/j.jcmg.2022.03.009 [DOI] [PubMed] [Google Scholar]
- 8.Nanna MG, Vemulapalli S, Fordyce CB, et al. The prospective randomized trial of the optimal evaluation of cardiac symptoms and revascularization: Rationale and design of the PRECISE trial. Am Heart J. 2022;245:136-148. doi: 10.1016/j.ahj.2021.12.004 [DOI] [PMC free article] [PubMed] [Google Scholar]
- 9.Douglas PS, Nanna MG, Kelsey MD, et al. Comparison of a risk-based testing strategy vs usual testing in stable symptomatic patients with suspected coronary artery disease: a randomized clinical trial. JAMA Cardiol. Published online August 23, 2023. doi: 10.1001/jamacardio.2023.2595 [DOI] [PMC free article] [PubMed] [Google Scholar]
- 10.Yang J, Shan D, Wang X, et al. On-site computed tomography-derived fractional flow reserve to guide management of patients with stable coronary artery disease: the TARGET randomized trial. Circulation. 2023;147(18):1369-1381. doi: 10.1161/CIRCULATIONAHA.123.063996 [DOI] [PubMed] [Google Scholar]
- 11.Douglas PS, De Bruyne B, Pontone G, et al. ; PLATFORM Investigators . 1-Year outcomes of FFRCT-guided care in patients with suspected coronary disease: the PLATFORM study. J Am Coll Cardiol. 2016;68(5):435-445. doi: 10.1016/j.jacc.2016.05.057 [DOI] [PubMed] [Google Scholar]
- 12.Thomas M, Jones PG, Arnold SV, Spertus JA. Interpretation of the Seattle Angina Questionnaire as an outcome measure in clinical trials and clinical care: a review. JAMA Cardiol. 2021;6(5):593-599. doi: 10.1001/jamacardio.2020.7478 [DOI] [PMC free article] [PubMed] [Google Scholar]
- 13.EuroQol Research Foundation . Explaining the EQ-5D in about two and a half minutes. Accessed July 17, 2023. https://euroqol.org/eq-5d-instruments/
- 14.Kalbfleisch JD, Prentice RL. The statistical analysis of failure time data. 2nd ed. Wiley; 2002. doi: 10.1002/9781118032985 [DOI] [Google Scholar]
- 15.Kaplan EL, Meier P. Nonparametric estimation from incomplete observations. J Am Stat Assoc. 1958;53:457-481. doi: 10.1080/01621459.1958.10501452 [DOI] [Google Scholar]
- 16.Cox DR. Regression models and life-tables. J R Stat Soc B. 1972;34(2):187-220. doi: 10.1111/j.2517-6161.1972.tb00899.x [DOI] [Google Scholar]
- 17.Schoenfeld D. Partial residuals for the proportional hazards regression model. Biometrika. 1982;69:239-241. doi: 10.1093/biomet/69.1.239 [DOI] [Google Scholar]
- 18.National Institute for Health and Care Excellence (NICE) . HeartFlow FFRCT for estimating fractional flow reserve from coronary CT angiography. Accessed July 17, 2023. https://www.nice.org.uk/guidance/mtg32
- 19.Mesnier J, Ducrocq G, Danchin N, et al. ; CLARIFY Investigators . CLARIFY Investigators. International observational analysis of evolution and outcomes of chronic stable angina: the multinational CLARIFY study. Circulation. 2021;144(7):512-523. doi: 10.1161/CIRCULATIONAHA.121.054567 [DOI] [PMC free article] [PubMed] [Google Scholar]
- 20.Wessler BS, Nelson J, Park JG, et al. External validations of cardiovascular clinical prediction models: a large-scale review of the literature. Circ Cardiovasc Qual Outcomes. 2021;14(8):e007858. doi: 10.1161/CIRCOUTCOMES.121.007858 [DOI] [PMC free article] [PubMed] [Google Scholar]
- 21.Fox KAA, Dabbous OH, Goldberg RJ, et al. Prediction of risk of death and myocardial infarction in the six months after presentation with acute coronary syndrome: prospective multinational observational study (GRACE). BMJ. 2006;333(7578):1091. doi: 10.1136/bmj.38985.646481.55 [DOI] [PMC free article] [PubMed] [Google Scholar]
- 22.Roffi M, Patrono C, Collet J-P, et al. ; ESC Scientific Document Group . 2015 ESC Guidelines for the management of acute coronary syndromes in patients presenting without persistent ST-segment elevation: Task Force for the Management of Acute Coronary Syndromes in Patients Presenting without Persistent ST-Segment Elevation of the European Society of Cardiology (ESC). Eur Heart J. 2016;37(3):267-315. doi: 10.1093/eurheartj/ehv320 [DOI] [PubMed] [Google Scholar]
- 23.Chew DP, Hyun K, Morton E, et al. Objective risk assessment vs standard care for acute coronary syndromes: a randomized clinical trial. JAMA Cardiol. 2021;6(3):304-313. doi: 10.1001/jamacardio.2020.6314 [DOI] [PMC free article] [PubMed] [Google Scholar]
- 24.Jovanovic BD, Levy PS. A look at the rule of three. Am Stat. 1997;51(2):137-139. doi: 10.2307/2685405 [DOI] [Google Scholar]
Associated Data
This section collects any data citations, data availability statements, or supplementary materials included in this article.
Supplementary Materials
eTable 1. Baseline Characteristics in Minimal-Risk vs Elevated-Risk Participants in the PRECISE Trial
eTable 2. Medication Use at Each Visit, Stratified by Baseline Use
eTable 3. Participants Identified as Minimal Risk by the PROMISE Minimal Risk Score with Significant or Severe Initial Test Findings
eFigure. Kaplan–Meier Estimates of the Composite Primary Endpoint as a Function of Time after Randomization
Nonauthor collaborators
Data sharing statement
Trial protocol
Statistical analysis plan
Statistical analysis plan addendum