

Summary
We present a protocol to conduct functional magnetic resonance spectroscopy (fMRS) in human participants before, during, and after training on a visual task. We describe steps for participant setup, volume-of-interest placement, fMRS measurement, and post-scan tests. We discuss the design, analysis, and interpretation of fMRS experiments. This protocol can be adapted to investigate the dynamics of chief excitatory and inhibitory neurotransmitters (glutamate and γ-aminobutyric acid, GABA, respectively) while participants perform or learn perceptual, motor, or cognitive tasks.
For complete details on the use and execution of this protocol, please refer to Frank et al. (2022).1
Subject areas: Clinical Protocol, Neuroscience, Cognitive Neuroscience, Behavior
Graphical abstract
Highlights
-
•
fMRS to measure neurochemical dynamics of glutamate and GABA in human participants
-
•
fMRS protocol while participants perform or learn a task
-
•
Directions on VOI selection and fMRS measurement
Publisher’s note: Undertaking any experimental protocol requires adherence to local institutional guidelines for laboratory safety and ethics.
We present a protocol to conduct functional magnetic resonance spectroscopy (fMRS) in human participants before, during, and after training on a visual task. We describe steps for participant setup, volume-of-interest placement, fMRS measurement, and post-scan tests. We discuss the design, analysis, and interpretation of fMRS experiments. This protocol can be adapted to investigate the dynamics of chief excitatory and inhibitory neurotransmitters (glutamate and γ-aminobutyric acid, GABA, respectively) while participants perform or learn perceptual, motor, or cognitive tasks.
Before you begin
Background to the method described in the manuscript
Magnetic resonance spectroscopy (MRS) is a non-invasive neuroimaging technology by means of which the concentrations of chief excitatory and inhibitory neurotransmitters (glutamate and GABA) can be measured in a single or multiple volume(s)-of-interest (VOIs) at a given time-point in human participants using an MRI scanner.2,3,4,5,6 MRS can be conducted while participants are not engaged in any particular task, or while they are performing a task. The latter approach is referred to as fMRS.7,8,9,10,11 A major advantage of fMRS over functional magnetic resonance imaging (fMRI) using the blood-oxygenation-level-dependent (BOLD) response is that excitatory and inhibitory processing involved in performing or learning of a given task can be measured separately.5,10,11,12,13 fMRS can be used in healthy participants and in clinical populations.14,15
The implementation of fMRS in a given study depends, among other factors, on the task, the location of the VOI, the duration of the fMRS scan, the imaging sequence for fMRS, and also on the analysis approach. Additional considerations are necessary for the conduction of fMRS in different age groups due to changes in brain structure and metabolite concentrations over the life span.16,17 Here, we describe a protocol to conduct fMRS in a time-resolved fashion in healthy elementary school age children (8–11 years old) and healthy young adults (18–35 years old) before, during and after training on a visual task leading to visual perceptual learning (VPL) (see Frank et al.1 for the original study). Our protocol can be easily adapted to measure fMRS while participants from different age groups or patients perform or learn perceptual, motor or cognitive tasks.
Considerations before conducting an fMRS experiment
Timing: flexible (preliminary works)
This section describes important considerations when planning an fMRS experiment.
-
1.
Task design.
The task design constraints of fMRS are similar to those of fMRI, because both neuroimaging techniques are MRI-based and require that participants’ heads are inside an MRI head coil (or use a surface coil). Visual stimulation during fMRS is easy to implement either by using MRI-safe goggles or a head coil-mounted mirror by means of which participants can see a screen located either in front or at the back of the scanner bore. Participant responses can be collected by using MRI-safe button boxes or other MRI-safe response devices. Given these constraints other types of stimulation (e.g., somatosensory or pain stimulation) are also possible during fMRS.7,18
-
2.
Experiment design.
fMRS can be conducted using event-related or block designs. In even-related fMRS designs stimuli or task trials are presented as single events, each presented for only seconds or less, with a jittered inter-stimulus or inter-trial interval without any stimuli or task lasting a few seconds each.19 In a block design the same or similar stimuli or task trials are presented successively within a block that typically lasts several minutes, and metabolite concentrations are compared between blocks with different stimuli or tasks.20 Event-related fMRS designs are more likely to reflect changes of glutamate resulting from neurotransmission whereas block designs are more likely to reflect changes of metabolism following an initial increase of neurotransmission.8 One should consider the possibility that, compared with an event-related design, adaptation and repetition suppression effects resulting from repeated presentation of the same stimulus or task in a block could result in a smaller or no increase of glutamate.19 With an event-related design time-resolved fMRS data can be acquired.19 This makes it possible to investigate the temporal evolution of the glutamate response after stimulus onset (the glutamate response function) using fMRS designs in which the time of scan acquisition after stimulus onset is varied systematically.8 A glutamate response function for different brain regions, tasks and participants could be used to optimize acquisition parameters and improve post-hoc analyses of the fMRS data. For example, the response function could be convolved with a task-regressor in a general linear model analysis of a glutamate time-series in an fMRS experiment, similar to the analysis of BOLD time-series data in fMRI. Note that there may be two distinct glutamate response functions, one that is short, rapid and large in amplitude reflecting neurotransmission, and another one that is long, slow and smaller in amplitude reflecting increased metabolism following an increase of neurotransmission.8 The aforementioned considerations similarly apply to measurements of GABA. However, the usage of event-related designs using MEGA-PRESS scans is more challenging compared with glutamate measurements using PRESS scans because a greater number of spectral averages is necessary for a reliable GABA signal in a MEGA-PRESS scan.
-
3.
Volume-of-interest.
VOI sizes between 2 × 2 × 2 cm and 4 × 4 × 4 cm are common for single-voxel fMRS. Larger VOIs increase the signal-to-noise ratio (SNR) of fMRS, however, they also more likely contain different brain regions. This may be negligible in cases where different brain regions within a VOI are similarly associated with performing or learning of the task during fMRS. However, for cases in which brain regions in close vicinity have different response profiles (for example, brain regions, which increase activation with visual motion stimulation, vs. brain regions, which are deactivated during visual motion stimulation20,21,22,23), it might be better to use a smaller VOI to measure fMRS primarily in the brain region of interest. Larger VOIs may also contain greater amounts of white matter and cerebrospinal fluid. Depending on the location of the VOI, the shape, size and rotation of the VOI may need to be adjusted to keep the VOI away from the skull bone and to minimize the inclusion of other brain regions within the VOI. The VOI most commonly consists of a single voxel but, dependent on the imaging sequence for fMRS, might also consist of multiple voxels. Although including multiple voxels increases the number of brain regions in which fMRS is measured simultaneously, several factors affecting data quality (e.g., shimming results and SNR within the VOI) and study design (e.g., longer fMRS acquisition times) make this approach more challenging than single voxel fMRS.3,4
-
4.
Imaging sequence.
A common way to measure the concentrations of glutamate and GABA in single-voxel proton (1H) fMRS is with PRESS (“Point RESolved Spectroscopy”)24,25 and MEGA-PRESS (“MEscher–GArwood Point RESolved Spectroscopy”)26,27 scans. See Figure 1 for example spectra collected with PRESS and MEGA-PRESS scans. A PRESS scan can be used to quantify the concentration of glutamate (or the sum of glutamate and its precursor glutamine, referred to together as Glx). The molecular structures of glutamate and glutamine are very similar, which is why their resonances are also very similar and difficult to separate in the spectrum.28 However, the Glx concentration in the spectrum can be assumed to be dominated by the glutamate concentration, because the concentration of glutamate in the brain is substantially higher than the concentration of glutamine.29 Note that it might be possible to separate glutamate and glutamine signals at higher magnetic field strengths (7 Tesla).28,30 The resonance of Glx/glutamate is centered between 2.1 – 2.5 ppm in a spectrum collected with a PRESS scan (with an additional appearance at 3.75 ppm). Other important metabolites in a PRESS scan for fMRS experiments are creatine (Cr; resonating at 3 ppm and 3.95 ppm) and N-acetyl-aspartate (NAA; resonating at 2 ppm), both of which can be used to normalize the concentration of glutamate (see Quantification and Statistical Analysis). Note that the resonance of GABA in a PRESS scan overlaps with that of Cr (both resonating around 3 ppm). This renders it difficult to separate the concentration of GABA from that of Cr, especially with lower magnetic field strengths. A solution to measure the concentration of GABA is to employ a MEGA-PRESS scan with GABA editing.31,32 For MEGA-PRESS “Edit On” (or “ON” for short) and “Edit Off“ (or “OFF” for short) spectra are acquired in an interleaved fashion and the concentration of GABA (centered between 2.8 – 3.2 ppm) is extracted during postprocessing by subtracting the Edit Off from the Edit On spectrum, resulting in a difference spectrum.5,32,33 See Mikkelsen et al.34 and Choi et al.,35 for additional considerations and recommendations regarding data acquisition and processing for a MEGA-PRESS scan with GABA editing). Note that some studies referred to the concentration of GABA measured by MEGA-PRESS at 3 T as “GABA+” to reflect the (unwanted) contribution of co-edited macromolecular signal(s) to GABA.32,35 It is also possible to use the spectrum collected with a MEGA-PRESS scan to extract the concentration of Glx. The concentration of Glx can be extracted either from the difference spectrum or from the Edit Off spectrum (resonating at 3.75 ppm; note that due to the MEGA-PRESS Off difference Glx peaks are also present between 2.1 – 2.5 ppm). The concentration of Glx/glutamate from the Edit Off spectrum might correspond to the concentration of Glx/glutamate measured with a PRESS scan (Maddock et al.36; however, see Bell et al.37). For some study designs (for example, learning paradigms with time-dependent changes of metabolite concentrations) it might be advantageous to measure the concentrations of Glx and GABA simultaneously with a MEGA-PRESS scan rather than separate PRESS and MEGA-PRESS scans. In this case, we recommend using the difference spectrum from the MEGA-PRESS scan to analyze the concentrations of Glx and GABA and to normalize them to an internal reference extracted from the same difference spectrum.38,39 Alternatively, if separate PRESS and MEGA-PRESS scans are collected for Glx/glutamate and GABA, respectively, we recommend counterbalancing the order of scan acquisition across participants to control for temporal order effects.20,40,41 Due to the large amount of water within brain tissue, the water signal (resonating at 4.65 ppm) would dominate the spectrum acquired with PRESS and MEGA-PRESS scans if unsuppressed. Therefore, it is necessary to use techniques such as WET42 for water suppression (for overview see Tkáč et al.43) prior to the collection of PRESS and MEGA-PRESS scans.
-
5.
Temporal resolution.
Figure 1.

Example fMRS spectra
(A) Example spectrum collected with a PRESS scan from a volume-of-interest (2 × 2 × 2 cm) centered between the left and right occipital lobes in a young adult (see Figure 4B) with annotated metabolite peaks [creatine (Cr) at 3.95 ppm and at 3 ppm, glutamate+glutamine (Glx) at 3.75 ppm and between 2.1 and 2.5 ppm, glycine (Gly) at 3.55 ppm, myo-inositol (mI) at 3.6 ppm (mI and Gly are overlapping around 3.54 ppm), choline (Cho) at 3.18 ppm, N-acetyl-aspartate (NAA) at 2 ppm, lactate at 1.3 ppm; chemical shift reported in magnetic field independent units: ppm; ppm = parts per million of the proton frequency].
(B) Example difference spectrum collected with a MEGA-PRESS scan from the same volume-of-interest as in (A) [Glx at 3.75 ppm, γ-aminobutyric acid (GABA) at 3 ppm, NAA at 2 ppm].
The fMRS data quality for MEGA-PRESS with GABA editing improves with longer scan durations (> 256 spectral averages), larger VOIs and greater magnetic field strength (7 Tesla).11,31,35,44 However, with multiple shorter scans, dynamic changes in metabolite concentrations over the course of learning can be measured. Such dynamic changes, especially when they last only for a couple of minutes (or less than that), could be difficult to detect using longer fMRS scans. The temporal resolution of fMRS can be improved by using a PRESS scan, which requires fewer spectral averages for reliable metabolite measurements, resulting in scan times well under 1 min (however, note that reaching the maximum level of glutamate in an fMRS experiment employing a block design may take up to 2 min relative to stimulus onset).9 In addition, as discussed in 4. Imaging sequence, it is difficult to separate the concentration of GABA from that of Cr in a spectrum collected with a PRESS scan.
-
6.
Interpretation of the results.
A key question for the interpretation of fMRS results is whether an increase or decrease of the concentration of glutamate or GABA in an experimental condition or over time results from a change in neurotransmission (i.e., increased or decreased release of glutamate or GABA into the synaptic cleft) or from a change in metabolism (i.e., increased or decreased production of glutamate or GABA by glutamate-glutamine or GABA-glutamine cycling, respectively; see Rothman et al.45 and Bak et al.46 for descriptions of these cycles; note that the concentrations of glutamate and GABA are also associated through these cycles because glutamine is the precursor of glutamate and glutamate is the precursor of GABA). Each of these processes or a combination of both could be associated with a change in the concentration of glutamate or GABA in an fMRS experiment. An increase of neurotransmission is a fast process, whereas an increase of metabolism is a slow process. Therefore, one might speculate that changes in the concentrations of glutamate and/or GABA over the course of short time scales in an fMRS experiment might more likely reflect changes in neurotransmission rather than metabolism. The interpretation of changes in neurotransmitter concentrations also depends on factors such as echo time of the fMRS scan, choice between event-related and block fMRS designs, and time to fMRS scan acquisition after stimulus onset (see Mullins8 for an in-depth discussion). fMRS with longer echo times (30 ms or longer) may be more sensitive to glutamate signals resulting from neurotransmission (i.e., glutamate released into the synaptic cleft) while signals from glutamate stored in presynaptic vesicles may make a larger contribution with shorter echo times (15 ms or shorter).8,47 An additional problem for the interpretation of fMRS results is that the resonance signal cannot distinguish between different compartments within a VOI (i.e., neurons, glia, intracellular and extracellular space, cell body, synapse etc.) and inflow, synthesis, outflow and degradation of the metabolites. It is also not possible with fMRS to determine which postsynaptic receptor types are activated by glutamate (NMDA, AMPA and metabotropic) and GABA (GABAA and GABAB).12 Given these limitations, it is important to consider the interpretation of different outcomes of an fMRS experiment a priori, make hypotheses if possible and appropriate based on previous measurements of glutamate and GABA, for example, in animal-models and include a conclusive (although ultimately speculative) explanation of the potential origin of changes in fMRS-measured neurotransmitter concentrations in an experimental condition or over time in the manuscript.
Institutional permissions
The original study was approved by the institutional review board at the University of Regensburg. Each participant in the original study (55 children, 30 female and 25 male, 8–11 years old, mean ± SEM age: 9.64 ± 0.14 years, and 56 adults, 36 female and 20 male, 18–35 years old, mean ± SEM age: 22.5 ± 0.61 years; subsets of 13 children and 14 adults participated in the fMRS experiment) provided informed written consent prior to participation. For the group of children, informed written consent was also provided by their legal guardians (in most cases, the parents). Anyone wishing to use this protocol in studies involving human participants must obtain approval from their relevant institution.
Key resources table
| REAGENT or RESOURCE | SOURCE | IDENTIFIER |
|---|---|---|
| Deposited data | ||
| Data generated in the original study | Frank et al.1 | https://doi.org/10.17632/xvyp2ph8jh.1 |
| Experimental models: Organisms/strains | ||
| Human participants (55 children, 30 female and 25 male, 8–11 years old; a subset of 13 children participated in the fMRS experiment; 56 adults, 36 female and 20 male, 18–35 years old; a subset of 14 adults participated in the fMRS experiment). | Frank et al.1 | N/A |
| Software and algorithms | ||
| Freesurfer 4.1.0 | Dale et al.48; Fischl et al.49 | https://surfer.nmr.mgh.harvard.edu |
| LC Model 6.3-1P | Provencher50,51 | http://s-provencher.com/lcmodel.shtml |
| MATLAB 2012a | The MathWorks | https://www.mathworks.com/ |
| MEGA-PRESS sequence | Mescher et al.26,27 | N/A |
| Osprey v2.4.0 | Oeltzschner et al.52 | https://github.com/schorschinho/osprey |
| PRESS sequence | Bottomley24,25 | N/A |
| Psychtoolbox 3.0.10 | Brainard53; Pelli54 | http://psychtoolbox.org/ |
| WET Water Suppression (or similar) | Ogg et al.42 | N/A |
| Other | ||
| Chinrest in psychophysics room | N/A | N/A |
| LCD screen in psychophysics room | N/A | N/A |
| LCD screen in scanner control room | N/A | N/A |
| MRI 3 Tesla Scanner | Siemens, Prisma with a 64-channel head/neck coil | N/A |
| MRI-safe armrest | N/A | N/A |
| MRI-safe blanket | N/A | N/A |
| MRI-safe button box | N/A | N/A |
| MRI-safe correcting glasses mounted inside MRI-safe goggles | N/A | N/A |
| MRI-safe head-coil mounted mirror | N/A | N/A |
| MRI-safe padding | N/A | N/A |
| MRI-safe projector | N/A | N/A |
| MRI-safe transparent screen | N/A | N/A |
| Snellen chart | Snellen55 | N/A |
| Stimulus computer in psychophysics room | N/A | N/A |
| Stimulus computer in scanner control room | N/A | N/A |
Step-by-step method details
fMRS experiment: Consent forms, instructions and preparations for fMRS measurement (Day 1)
This section describes all necessary steps for the experimenter and the participant prior to scanning.
-
1.MRI safety screening and consent forms.Note: The following description is for the procedure with children in elementary school age and young adults in the original study. A similar procedure can be used for other age groups. The specific guidelines for participants of different age groups as required by the relevant institutional review board and the institutional MRI safety procedures should be followed.
-
a.Screen participants for MRI safety, read and sign consent forms. For the group of children, consent forms are signed by the accompanying legal guardian.
-
i.Provide the child with a separate consent form written in child-friendly language.
-
ii.If the child agrees to participate, ask them to sign the consent form.
-
iii.Briefly explain the procedure of the experiment to participants and remind them that the experiment also includes another session outside the scanner on a separate day.Note: See Psychophysics experiment: Posttest outside the scanner (Day2) below.Note: Some studies report modulations of GABA levels over the course of the natural menstrual cycle in adult female participants.56,57,58,59 Future studies might consider recording the phase of the menstrual cycle and conducting fMRS only during selected phases of this cycle or only run adult female participants using hormonal contraception.20,59
-
i.
-
b.Check visual acuity using a Snellen chart.55
-
c.Provide MRI-safe correcting glasses mounted inside goggles if necessary.
-
a.
-
2.Familiarization with MRI scanner and tasks.
-
a.Check that the child and the legal guardian are metal-free and safe to enter the scanner room. Give them a brief scanner tour to familiarize them with the MRI environment.
-
b.Place a phantom inside the MRI head coil, plug the coil in and move the table into the scanner to demonstrate the setup for the fMRS experiment.
-
c.Explain the function of the mirror mounted above the MRI head coil and show how the position of the mirror can be manually adjusted to optimize the view of the screen.
-
d.Explain the functions of the buttons on the MRI button box.Note: In the original study an orientation detection task is used for visual training during fMRS (Figure 2A). Before and after visual training participants perform a fixation task during fMRS (Figure 2B). The fMRS measurements with the visual training task are referred to in the following as training fMRS. fMRS measurements with the fixation task are referred to as pretraining and posttraining fMRS. See Frank et al.60 for a detailed description of important design considerations for visual training tasks.Note: It could be argued that performing the fixation task modulates neurotransmitter concentrations and that it might be better not to have a task during pretraining and posttraining fMRS (i.e., just asking participants to maintain central fixation or to keep their eyes closed). However, we believe that an omission of the fixation task has the disadvantage that there is no behavioral control of participants’ fixation quality and vigilance.39 Differences in fixation quality and/or vigilance between pretraining and posttraining fMRS (for example, due to effects of fatigue during posttraining fMRS after being in the scanner for some time) might modulate neurotransmitter concentrations.9,12 In addition, GABA concentrations in the occipital lobe differ between eyes open and closed.61 This could confound training-related changes in neurotransmitter concentrations between pretraining and posttraining fMRS.Alternatives: Future studies might avoid using a fixation task during pretraining and posttraining fMRS by employing MRI-safe eye-tracking. By means of eye-tracking fixation quality and vigilance (as indicated by pupil diameter) can be measured while participants do not have to perform a task requiring a behavioral response.
-
e.Outside the scanner, familiarize the participant with the fMRS tasks using practice trials.
-
i.Fixation task: Instruct the participant to press the button under their right index finger on the button box quickly when they detect a change of color of the fixation spot.
-
ii.Orientation detection task: Instruct the participant to press the button under their right index finger when the first image contains the orientation and the button under their right middle finger when the second image contains the orientation. Instruct them to quickly press the button only after the second image is presented and release it after the response.
-
iii.For both tasks instruct participants that no feedback about response accuracy will be provided after their response but that they will notice when they perform well because the task will become more difficult. Explain to them that “difficult” means that the pink color change of the fixation spot in the fixation task and the orientation pattern in the orientation detection task will become weaker.
-
iv.Comfort children that they do not need to worry about their performance and that they will not be criticized by the experimenter or the legal guardian with respect to their performance.
-
v.Check carefully whether the participant understands the task by monitoring their performance during the practice trials. If they perform well, task difficulty should increase as shown by more subtle color changes in the fixation task and more noise overlaid on the orientation pattern in the orientation detection task.
 CRITICAL: A different orientation than the trained orientation should be used for practice in the orientation detection task in order to minimize the possibility of learning prior to the fMRS experiment. Visual training is often specific for the trained visual feature.60,62,63,64,65,66 Therefore, even if a little practice already leads to learning, that learning would be for a different orientation than the trained orientation in the experiment. Moreover, the number of practice trials should be limited to avoid training effects (for example, it should be limited to ten practice trials for each task). Only offer additional practice trials if the participant reports difficulty understanding the task(s).
-
i.
-
a.
-
3.Participant setup for scanning.
-
a.Set up the participant for the fMRS measurement. This setup includes participant registration and preparation of MRI scans (three anatomical scans for VOI placement, thirteen successive MEGA-PRESS scans and a water reference scan).
-
b.Offer the participant the opportunity to visit the bathroom before the setup commences and notify them that drinking or eating (for example, chewing gum) is not allowed inside the scanner.
-
c.Notify the participant that they will not be able to talk to the experimenter during scanning.
-
d.Show them the panic ball and inform them that they can and should squeeze the panic ball at any time during the experiment in case they do not feel well or want to communicate with the experimenter for whatever reason.
-
i.Squeezing the panic ball will set off an auditory alarm to alert the experimenter outside the scanner.
-
ii.Upon hearing the alarm, the experimenter will immediately interrupt the scan and check on the participant inside the scanner.
-
iii.Remind the participant to be careful not to accidentally squeeze the panic ball.
-
iv.Finally, invite them to squeeze the panic ball once to hear the alarm.
-
i.
-
e.Offer to the child and the legal guardian that the legal guardian or another experimenter can stay with the child in the scanner room.
-
i.Screen this person for MRI-safety.
-
ii.Provide this person (after checking for MRI-safety) with earplugs and headphones.
-
iii.Provide an MRI-safe plastic chair for this person to sit in the scanner room.
-
i.
-
f.Provide ear plugs to the participant and ask them to plug them in as deep as possible into their ear canals while remaining comfortable.
-
g.Position the participant on the MRI table. Ask them to lay down in supine position.
-
h.Provide padding under the legs and to the left and right of the head inside the head coil. Give them armrests. Offer a blanket if the participant feels cold.
-
i.Give the button box to the participant’s right hand and explain the functions of the buttons one more time. Ask the participant to press each button once. Check that the button presses are being recorded by the stimulus computer.
-
j.Plug the head coil in, move the MRI-table up and ask the participant to close their eyes while the position of the head inside the coil is recorded by using a laser.
-
k.Ask the participant to open their eyes again and to indicate if they are fine. Also, ask them to indicate immediately if anything is wrong or if they feel any discomfort while the MRI-table is moved slowly into the scanner.CRITICAL: You should check that the head of the participant is in the right position. If a part of the coil is right in front of their eyes, they cannot fully see the mirror. If this is the case, you or the participant must adjust the position of the mirror.
-
l.Once inside the scanner, ask the participant one more time if they are fine.
-
m.If they confirm, place paddings next to the participant’s left and right arms in order to avoid any contact between the participant’s skin and the scanner bore that could lead to burns or peripheral nerve stimulation.
-
n.Remind the participant not to cross their legs during the experiment to avoid large loops creating induction circuits that could lead to burns.
-
o.Ask the participant and the legal guardian/experimenter in the MRI room (if they stay) if they are ready for the experiment.
-
p.If they confirm, the scanning procedure can commence.
-
q.Turn the lights in the scanner room off.CRITICAL: Once the MRI-table has reached its final position inside the scanner, you should ask the participant again if they can see the whole screen. If they cannot see the whole screen, you can ask the participant to reach for the mirror above the head coil with their hand to adjust its position by moving it back or forth until they can see the screen fine. Ask the participant if they have a firm grip on the panic ball and if they have positioned their fingers over the response buttons on the button box. Ask the participant to press the response buttons inside the scanner while you or another experimenter checks on the stimulus computer that the correct buttons are pressed. Remind the participant that it is possible (although unlikely) that the ear plugs inside the ear canal become loose during the experiment and that if this occurs, they should immediately squeeze the panic ball to alert the experimenter outside the scanner.Alternatives: Future studies might consider including a familiarization session in a mock MRI scanner (if available) prior to the experiment. This might be helpful especially for very young and very old participants to adapt them to the scanner environment. During the session in the mock scanner participants can also perform practice trials in the fMRS task(s).
-
a.
Figure 2.

Task design in the original study
(A) Example trial of the orientation detection task for visual training. Two images are presented successively at the center of the screen separated by a blank interval. One image consists only of visual noise. The other image contains an orientation pattern overlaid by visual noise. At trial end participants are asked to indicate by pressing one of two buttons whether the first or the second image contains the orientation pattern.
(B) Example trial of the fixation task. A disk presented at screen center changes color from white to pink occasionally in an unpredictable fashion. Participants are asked to press a button when they detect a color change.
fMRS experiment: fMRS measurement (Day 1)
This section describes all necessary steps for scanning. See Figure 3 for an overview of tasks and scans.
Note: In the original study fMRS is conducted in a time-resolved fashion using successive MEGA-PRESS scans with a duration of 3:18 min each before, during and after visual training (for similar designs see Tamaki et al.39; Floyer-Lea et al.67; Frangou et al.68; Kolasinski et al.69). Three successive fMRS scans are collected during pretraining fMRS (∼ 10 min in total). Four successive fMRS scans are collected during training fMRS (∼ 15 min in total). Six successive fMRS scans are collected during posttraining fMRS (∼ 20 min in total). After the final fMRS scan a water reference scan is collected (∼ 1 min).
Alternatives: A single fMRS scan with a total duration of 45 min, or three fMRS scans for pretraining, training and posttraining fMRS (10 min, 15 min and 20 min long, respectively) could be acquired and analyzed over the appropriate time frames. Our approach of conducting fMRS in multiple short scans has the advantage that scanning can be interrupted for a break after the acquisition of each scan and that shimming can be performed prior to each scan.
-
4.Anatomical scans.
-
a.Successively collect three high-resolution anatomical scans for sagittal, coronal and transverse planes with the following imaging parameters:
-
i.Sagittal plane: time-to-repeat (TR) = 0.19 s, time-to-echo (TE) = 2.46 ms, flip angle (FA) = 70°, in-plane acquisition matrix (AM) = 288 × 288, 25 slices, voxel size = 0.8 × 0.8 × 4.0 mm, inter-slice gap = 1.20 mm.
-
ii.Coronal plane: TR = 0.25 s, TE = 2.46 ms, FA = 70°, AM = 288 × 288, 35 slices, voxel size = 0.8 × 0.8 × 4.0 mm, inter-slice gap = 1.20 mm.
-
iii.Transverse plane: TR = 0.19 s, TE = 2.46 ms, FA = 70°, AM = 288 × 288, 27 slices, voxel size = 0.8 × 0.8 × 4.0 mm, inter-slice gap = 1.20 mm.
-
i.
-
b.Participants can keep their eyes open or closed during the acquisition of the anatomical scans.
-
c.After collecting the last anatomical scan check on the participant and ask if they are willing to proceed with the experiment.
-
d.If the participant confirms, ask them to keep their eyes open for the remainder of the experiment.
-
a.
-
5.VOI placement.
-
a.Use the high-resolution anatomical scans for VOI placement (see Figure 4 for examples).
-
b.Place the VOI (2 × 2 × 2 cm) for single-voxel proton (1H) fMRS in the occipital lobe.
-
c.Use the calcarine sulcus as an anatomical landmark and place the VOI manually perpendicular to the sulcus and centered between the hemispheres.
- d.
-
e.Avoid the superior sagittal sinus (shown as a bright white spot adjacent to the back of the occipital lobes).
-
f.The VOI might need to be rotated (resembling a diamond, see Figure 4).
-
g.Take a photo or screenshot of the location of the VOI overlaid on the high-resolution anatomical scans.
-
a.
Note: In the original study the VOI is placed in the occipital lobe because it is known from previous research that VPL involves plasticity in early visual cortical areas.62,63,64 We recommend using results from previous studies or meta-analyses to support the placement of the VOI. However, this approach has limitations when there are differences in the location of the brain region(s) of interest between participants, particularly when the size of the VOI is small. For example, there are small visual motion-sensitive brain regions that tend to vary substantially in location between participants.20,21,22,23
Alternatives: Conduct a functional localizer scan using fMRI in each participant and use the individual location of BOLD-activation for VOI placement.20
Note: A VOI can be placed in one hemisphere if it is fair to assume that a brain region in this hemisphere is critical to performing or learning of a given task.20 This approach has the advantage that partial volume effects resulting from including midline structures in a VOI centered between the hemispheres can be avoided. Alternatively, if homologous brain regions in the left and right hemispheres can be assumed to be similarly critical to performing or learning of a given task one might place the VOI in one hemisphere and counterbalance the hemisphere across participants. Another possibility is to center the VOI between the hemispheres. Especially with the relatively small occipital lobe, it might be difficult to place the VOI exclusively in one hemisphere.
Alternatives: Depending on the study design, one might consider conducting additional fMRS measurements in a separate fMRS run in a control VOI located in a brain region where no neurotransmitter modulations during the performance of the fMRS task are expected. In this way, it can be measured whether modulations of neurotransmitter concentrations during the task are specific to a particular brain region, which is desirable for tasks known to involve specific brain regions. A downside of this approach is that the fMRS measurement time will increase substantially, which might be undesirable for the investigation of sensitive participant groups such as children or patients who can only spend a limited amount of time inside the scanner.
-
6.Pretraining fMRS.
-
a.Each MEGA-PRESS scan has the following parameters: TR = 1.5 s; TE = 68 ms; FA = 90°; number of spectral averages = 64; scan time = 3:18 min. WET water suppression is used.42
-
b.Initiate the first MEGA-PRESS scan for pretraining fMRS.
-
c.Automatic shimming is performed before the scan is acquired.
-
d.The system will show the shimming results. If the results are acceptable (for example, below 20 Hz for a VOI in the occipital lobe), proceed and start the fixation task simultaneously with the acquisition of the first MEGA-PRESS scan. Otherwise, see solution suggested in troubleshooting problem 3.
-
e.Collect three successive MEGA-PRESS scans for pretraining fMRS while the participant performs the fixation task.
-
f.Closely monitor the participant’s performance in the fixation task and the collected MEGA-PRESS difference spectra using the Siemens inline display.
-
g.The scanner will pause prior to each MEGA-PRESS scan and show shimming results. Write down the shimming results for each scan for your records and proceed.
-
h.After collecting the final MEGA-PRESS scan, terminate the fixation task.
-
a.
-
7.Training fMRS.
-
a.After pretraining fMRS check on the participant.
-
b.If they agree to continue, start the orientation detection task for visual training. Start the task simultaneously with the collection of the first MEGA-PRESS scan for training fMRS.CRITICAL: If time permits, repeat the high-resolution anatomical scans prior to training fMRS to verify that the VOI location is still acceptable. If the location differs from the original location, repeat the placement of the VOI.
-
c.Closely monitor the performance in the orientation detection task. If you notice that the performance looks suspicious (indicated by a clearly visible orientation pattern on each task trial), perform the procedure described in troubleshooting problem 2.
-
d.The participant performs the orientation detection task successively (one block for pretest and eight blocks for training).
-
e.Collect four successive MEGA-PRESS scans for training fMRS while the participant performs the orientation detection task.
-
f.Otherwise, follow the procedure described in pretraining fMRS.
-
g.After collecting the final MEGA-PRESS scan, terminate the orientation detection task.
-
a.
-
8.Posttraining fMRS.
-
a.After training fMRS check on the participant.
-
b.If they are ok to continue, start the fixation task for posttraining fMRS. Start the task simultaneously with the collection of the first MEGA-PRESS scan for posttraining fMRS.CRITICAL: If time permits, repeat the high-resolution anatomical scans prior to posttraining fMRS to verify that the VOI location is still acceptable. If the location differs from the original location, repeat the placement of the VOI.
-
c.Collect six successive MEGA-PRESS scans for posttraining fMRS while the participant performs the fixation task.
-
d.Otherwise, follow the procedure described in pretraining fMRS.
-
e.After collecting the final MEGA-PRESS scan for posttraining fMRS, collect a water reference scan for the same VOI without water suppression using a PRESS scan with the following parameters: TR = 3 s; TE = 30 ms; FA = 90°; number of spectral averages = 16; scan time = 1:03 min.
-
f.Participants continue to perform the fixation task while the water reference scan is acquired.
-
g.After collecting the water reference scan, terminate the fixation task.CRITICAL: In addition to water suppression techniques, we recommend collecting a separate water reference scan without water suppression for the same VOI used for PRESS and MEGA-PRESS. This scan can be collected as a single scan prior to or after the fMRS experiment, or it can be collected in an interleaved fashion with the PRESS and MEGA-PRESS scans.19 The acquisition of this water reference scan takes in most cases a minute or less (16 spectral averages are common) and it improves the quality of post-hoc analyses, because the fMRS spectrum can be corrected for residual tissue water signals. The unsuppressed water spectrum is also used for correcting B0 fluctuations due to rapid gradient switching (eddy current effects). The tissue water signal can be used as an internal reference to normalize the absolute metabolite concentrations of glutamate and GABA (see Quantification and Statistical Analysis).
-
h.Thereafter, notify the participant that the experiment is finished and that they will be moved out of the scanner.
-
i.Slowly move the MRI table out of the scanner.
-
j.Remove the head coil and instruct the participant to sit up slowly.
-
k.Recommend them to rest on the table for a moment, because they could feel dizzy after being in supine position for a long time.
-
l.After this rest period, the participant and the accompanying person in the scanner room are free to leave the room.
-
m.Save the following data files for each scan:
-
i.rda file (text file with measured fMRS spectrum; for MEGA-PRESS there are separate rda files for ON, OFF and difference spectra, each of which should be saved)
-
ii.twix file (time-domain raw data in Siemens twix format; good to check for frequency drift).
-
iii.Siemens dicom file(s) (good to save for backup; can be loaded into the Siemens scanner computer at a later time-point for data inspection and for conversion from dicom to rda)
-
i.
-
n.Double-check that shimming results are recorded for each fMRS scan and that there is a photo or screenshot of the VOI location.
-
o.Save all other MRI files (anatomical scans, etc.) in the file format provided by the scanner (for example, Siemens dicom).
-
a.
Figure 3.

Experiment design in the original study
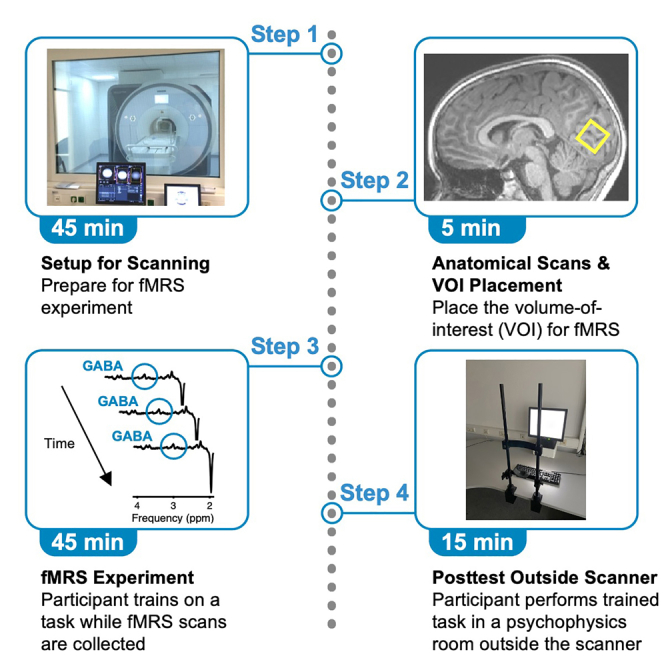
The experiment consists of two sessions on separate days. The first session is conducted inside an MRI scanner while high-resolution anatomical and fMRS scans are collected. fMRS is conducted in successive scans with a duration of 3:18 min each. Shimming is performed prior to each fMRS scan. Three successive fMRS scans are collected for pretraining fMRS. Four successive fMRS scans are collected for training fMRS. Six successive fMRS scans are collected for posttraining fMRS. After the final posttraining fMRS scan a water reference scan is collected. During training fMRS participants perform the orientation detection task (Figure 2A). During pretraining fMRS, posttraining fMRS and during the collection of the water reference scan participants perform the fixation task (Figure 2B). In the second session on a separate day trained participants perform the orientation detection task in a posttest outside the scanner.
Figure 4.

Example VOI locations
(A) Location of the VOI in the occipital lobe in a representative child participant. The VOI (size: 2 × 2 × 2 cm) is shown as gray rectangle overlaid over the participant’s high-resolution anatomical scans (sagittal scan in the left column, coronal scan in the middle column and transverse scan in the right column) using the software Osprey (Oeltzschner et al., 2020).52 The bright spot under the VOI in the transverse scan corresponds to the superior sagittal sinus.
(B) Same as (A) but for a representative adult participant.
Psychophysics experiment: Posttest outside the scanner (Day 2)
This section describes all necessary steps for the psychophysical test on a separate day after scanning.
-
9.Posttest outside the scanner.
-
a.On a separate day after scanning invite the participant for a posttest in a psychophysics room equipped with a computer, screen, keyboard and chin rest.
-
b.Ask the participant to perform the same orientation detection task as during scanning for one block.
-
c.Remind them that they should press one of two response keys with their right index and middle fingers, respectively, on the keyboard at the end of each trial to indicate whether the orientation is shown in the first or second image.
-
d.Remind them to press the response key after the second image and release it after the response.
-
e.After this instruction ask the participant to place their fingers over the two response keys on the keyboard because the room lights will be turned off shortly and it will be difficult to see the keys without the room light.
-
f.Ask the participant if they are ready to start. If they confirm, turn the room lights off and give them time to adapt. If the participant confirms that they are ready to start, commence the experiment.
-
a.
Expected outcomes
Participants should not experience difficulties in performing the orientation detection and fixation tasks during fMRS. They are expected to improve their orientation detection thresholds for the trained orientation from pretest to posttest, indicative of VPL. No baseline (i.e., pretest) threshold differences should be found between children and adults. The quality of fMRS data [shimming results, Cramer-Rao Lower Bounds (CRLB)] should be similar between the two age groups. During debriefing, many participants report that they find fMRS more tolerable than fMRI because the noise level inside the scanner is lower. Children should exhibit an increase of GABA in the occipital lobe from pretraining fMRS to training and posttraining fMRS, indicative of an increase of inhibitory processing in early visual cortical areas that outlasts the period of training and continues for several minutes thereafter. In contrast, GABA should remain stable between pretraining, training and posttraining fMRS in adults, indicating that no changes in inhibitory processing over the fMRS measurement period occurred in this age group. No differences in fixation task performance between pretraining and posttraining fMRS and between children and adults are expected, suggesting that fixation and vigilance levels during fMRS are similar before and after training and between the age groups. See Figures 4–6 in the original study.
Quantification and statistical analysis
There are several software packages for the analysis of fMRS data (see Mullins et al.32 for an overview). In the original study we analyze the fMRS data with the LC model.50,51 Using the reference scan without water suppression the LC model performs eddy current correction and water scaling. The LC model fits the metabolite intensities to a linear combination of spectra of individual metabolites derived from an imported metabolite basis set.50,51 Customized basis sets can be acquired experimentally or they can be simulated.32 The LC model outputs the concentrations with respect to water reference (whenever available; referred to as absolute concentrations in the following) and “relative” to Cr or NAA as fractions (referred to as normalized concentrations in the following). Cr (or Cr and Phosphocreatine, Cr+PCr) and NAA (or NAA and N-acetyl-aspartyl-glutamate, NAA+NAAG) are commonly used as internal references for normalization.5,12,32,70,71 Cr is a marker of cellular integrity. NAA is a marker of neuronal density and mitochondrial function. Cr and NAA can be used to normalize metabolite concentrations acquired with a PRESS scan. Cr is canceled out in a MEGA-PRESS difference spectrum and NAA from the difference spectrum (or, alternatively, Cr or NAA from the Edit Off spectrum) can be used for normalization.
Prior to normalization the absolute concentrations can be corrected for partial volume effects within the VOI for each participant.1,20,72,73,74,75 This correction can account for differences in tissue types (gray matter, white matter, cerebrospinal fluid etc.) within the VOI between participants due to VOI location, aging or sex.12,17 In addition, it can correct for differences in metabolite concentrations between gray and white matter (for example, greater amounts of GABA in gray matter than white matter).76,77 For partial volume correction a high-resolution anatomical scan of the brain must be collected for each participant (for example, by acquiring an MPRAGE scan at the beginning of the fMRS session; this scan can also be used for VOI placement). MRI analyses packages (e.g., Freesurfer48,49) are available to extract the brain from this scan and perform automated segmentation of the brain into different tissue types. After coregistration of the VOI to the reconstructed and segmented brain the percentage of different tissue types and regions within the gray matter of the VOI can be calculated for each participant. Brain regions can be defined using either BOLD activation in an fMRI localizer scan or a standard atlas of regions (e.g., Glasser et al.78) remapped to each participant’s reconstructed brain. After partial volume correction, glutamate and GABA can be divided by the chosen internal reference for normalization. Alternatively, fractions of gray matter to white matter can be included as covariates in the statistical analysis.32
There are also other ways to normalize the concentrations of glutamate and GABA. For example, one might consider normalizing the concentrations only to tissue water as an internal reference measured by the water reference scan collected at the beginning or end of fMRS.79,80 However, for fMRS in particular, we recommend using an internal reference extracted from the same fMRS scan as glutamate and GABA, so that differences between fMRS scans (e.g., noise levels, participant performance/vigilance) are reflected in the metabolite of interest and the internal reference. Alternatively, fMRS could be conducted with interleaved water suppressed and water unsuppressed scans.19 Using this approach it would also be possible to relate changes in metabolite concentrations measured with the suppressed water scan to simultaneously occurring hemodynamic changes (related to those reflected by the BOLD response in fMRI) measured with the unsuppressed water scan.19
In addition to normalized concentrations, the absolute metabolite concentrations should be examined. For fMRS, it is important to check that effects between conditions or over time result from changes in glutamate and/or GABA but not from any changes in the concentrations of the internal reference used for normalization. As mentioned above, Cr and NAA are frequently chosen as internal references, because they are assumed to remain stable between experimental conditions and over time. However, caution is warranted with this assumption, especially for Cr. Cr is involved in bioenergetics and Cr levels may be influenced by activity/vascularization.81 Cr levels can also be modulated by drug administration and electroconvulsive therapy.82,83 Another factor to consider, especially in developmental studies, is that the concentration of the internal reference (NAA, Cr) changes over the life span.12 Differences in the concentration of the internal reference between age groups might lead to differences in glutamate and GABA after normalization to the reference. Therefore, a post-hoc analysis of the absolute concentrations of all metabolites-of-interest including the internal reference should be carried out.
Some studies, especially those in the domain of learning and brain plasticity, report the ratio of the normalized concentration of glutamate relative to the normalized concentration of GABA, in other words the ratio of excitation relative to inhibition (or “E/I ratio” for short).9,39,40,41,84,85 This approach has the advantage that the balance between excitation and inhibition in an experimental condition or at a given time-point within a VOI is represented by a single value, which facilitates data visualization and statistical analysis. Furthermore, the E/I ratio is considered an index of plasticity and stability in animal models86 and humans,39,40,41 which simplifies the comparison of results across studies. However, using the E/I ratio for fMRS experiments in which changes in this ratio due to experimental conditions or over time are expected has the following disadvantage: if changes in the E/I ratio occur, it is unclear whether such changes originate from changes in glutamate and/or GABA. This makes it necessary to analyze changes in glutamate and GABA separately. Therefore, data analyses focusing on the E/I ratio should also include separate analyses of glutamate and GABA to better understand which neurotransmitter change(s) are driving changes in the E/I ratio.
Several measures can be used to assess fMRS data quality, such as CRLB, SNR, water and NAA linewidths at full-width-at-half-maximum (in Hz) (both have good SNR), and area under curve from rectified residuals of the LC model fit. The cutoff criteria for acceptable results vary between different studies and depend, among other factors, on the location, size and shape of the VOI, the strength of the scanner magnetic field and the number of spectral averages. See Kolasinski et al.69 for an example combination of multiple criteria. As with fMRI, the quality of the fMRS spectra depends on how still the participants keep their heads. Head motions during an fMRS acquisition are indicated by a huge unsuppressed water signal as well as sudden changes in frequency and phase shifts and broadened lines.35 fMRS spectra can be collected with interleaved water scans to record head motion.87 During post-hoc processing fMRS spectra contaminated with head motion can be excluded prior to spectral averaging (however with the constraint that such exclusion might make the interpretation of time-dependent changes of glutamate or GABA difficult if a large number of spectra in the time-series is excluded). The range of frequency drift across fMRS scans can be examined to check for head motion. The lower the frequency drift, the less pronounced are head motions during a given scan. Frequency drifts of around 1 Hz over the course of an fMRS time series indicate little head motion.39,40
Limitations
The approach described in this protocol to conduct fMRS in different age groups before, during and after visual training has several limitations: First, the size of the VOI is kept small to restrict the VOI to early visual cortical areas (V1, V2) without including parts of the inferior parietal lobe. However, this should not raise any major concerns because there is good SNR even for a small VOI in the occipital lobe due to the proximity of the VOI to the coil elements and the high metabolism of the occipital lobe.31
Second, the number of spectral averages of the MEGA-PRESS scans is kept to a minimum and could be increased to improve fMRS data quality. There is a tradeoff between fMRS data quality on the one hand and limited scan time and the need to collect a time-series consisting of several successive fMRS scans over the course of learning on the other. The fMRS scans should be kept short to measure neurochemical changes that occur in small time-windows (although one might argue that a time-window of approximately 3 min for each fMRS scan is still very long). Short fMRS scans also make it easier to interrupt scanning briefly if participants need a break.
Future studies might consider using higher magnetic field strength (7 Tesla) and/or larger VOIs and more spectral averages to improve fMRS data quality (for example, to reduce macromolecule contamination to the edited GABA signal).88 Future studies might also want to collect one long time-series of successive fMRS scans for pretraining, training and posttraining fMRS rather than three/four/six separate fMRS scans in pretraining/training/posttraining fMRS as in our original study. This approach has the advantage that noisy segments of the time-series can be removed before the time-series is split into separate fMRS analysis windows across which the concentrations of glutamate and GABA are calculated.
Third, the interpretation of the fMRS results is limited with this protocol because neurotransmitter concentrations are only measured in one part of the brain. Future studies might want to include several VOIs (for example, at least one more VOI in a control region of the brain where no changes of glutamate or GABA over the course of visual learning are expected) either in the same participant or in a control group of new participants to show that neurotransmitter changes are specific to one brain region and do not occur in other regions or all over the brain.
Fourth, future studies might want to omit the fixation task and conduct MRI-safe eye-tracking instead. In this way, fixation quality and vigilance levels can be measured without requiring the participant to perform a task at the center of the screen. This might rule out the possibility that performing the fixation task modulates neurotransmitter concentrations between pretraining and posttraining fMRS.
Finally, future studies might consider running functional BOLD-localizer scans to determine the location of brain region(s) of interest in each participant and use the BOLD activations in these localizer scans to support the placement of the VOI for fMRS.
Troubleshooting
Problem 1
The fixation task performance looks suspicious, as indicated, for example, by no or late button presses and accordingly no increase in task difficulty over time (i.e., always clearly detectable color changes of the fixation spot) (Steps 6 and 8).
Potential solution
Interrupt the scan and check on the participant. The participant might have pressed the wrong buttons on the button box or the button box might not work properly. It is also possible that the participant became confused about the task or has difficulty seeing the color changes, because the head-coil mounted mirror is not positioned correctly). In this case the problem can be fixed while the participant remains inside the scanner by pointing the participant to the correct buttons on the button box or by asking the participant to adjust the position of the head-coil mounted mirror. If the problem cannot be resolved while the participant remains inside the scanner, move the MRI-table slowly out of the scanner. The participant can leave the MRI-room while the problem is fixed. Explain the task again to the participant outside the scanner and ask them to perform some practice trials. After troubleshooting repeat the MRI setup procedure and restart scanning from the beginning (i.e., with the collection of the anatomical scans). Place the VOI as closely as possible to the original location (by using the photo or screenshot of the original location saved at the beginning of the experiment).
Problem 2
The orientation detection task performance looks suspicious, as indicated, for example, by no or late button presses and accordingly no increase in task difficulty over time (i.e., an always clearly detectable orientation pattern in one of the images) (Step 7).
Potential solution
Follow the same solution as for problem 1.
Problem 3
Shimming results for an fMRS scan are above accepted criterion (for example above 20 or 25 Hz) (Steps 6, 7 and 8).
Potential solution
Either redo the VOI placement or have the participant move the head slightly before VOI replacement, then redo shimming. Follow-up with manual shimming if necessary.
Problem 4
Although the fMRS spectrum shown in the inline display looks good and shimming results are acceptable, there is uncertainty as to whether the fMRS data quality is good enough for follow-up analyses (Steps 6, 7 and 8).
Potential solution
Consider collecting an additional MEGA-PRESS scan with the same scanning parameters and VOI location for quality assurance prior to the experiment. After the scan is collected the data can be analyzed quickly and checked for quality (including CRLB, SNR, water and NAA linewidths, area under curve from rectified residuals of the LC model fit, frequency drift).
Problem 5
The post-hoc analysis shows that the quality of a MEGA-PRESS difference spectrum in a given participant’s time-series is not good enough for a reliable GABA estimation (Steps 6, 7 and 8).
Potential solution
Consider interpolating the missing GABA result by using the mean GABA concentration between that participant’s preceding and succeeding MEGA-PRESS scans. If these scans failed as well, you could interpolate the missing data by using the group mean for the missing scans across the remaining participants. Another option is to examine each average of the failed scan and remove contaminated averages.
Resource availability
Lead contact
Further information and requests for resources and reagents should be directed to and will be fulfilled by the lead contact, Takeo Watanabe (takeo_watanabe@brown.edu).
Materials availability
This study did not generate new unique reagents.
Acknowledgments
S.M.F. was supported by the Deutsche Forschungsgemeinschaft (DFG) (Emmy Noether Grant – project number 491290285). Y.S. was supported by the National Institutes of Health (NIH) R01EY031705. M.W.G. was supported by the DFG (Project GR 988/27-1). T.W. was supported by the Fred M. Seed Foundation, the United States – Israel Binational Science Foundation (BSF2016058), and the NIH R01EY027841 and R01EY019466.
Author contributions
S.M.F., M.B., W.M.M., Y.S., M.W.G., and T.W. wrote the manuscript.
Declaration of interests
The authors declare no competing interests.
Contributor Information
Sebastian M. Frank, Email: sebastian1.frank@psychologie.uni-regensburg.de.
Takeo Watanabe, Email: takeo_watanabe@brown.edu.
Data and code availability
The data generated in the original study are available at the following site: https://doi.org/10.17632/xvyp2ph8jh.1.
References
- 1.Frank S.M., Becker M., Qi A., Geiger P., Frank U.I., Rosedahl L.A., Malloni W.M., Sasaki Y., Greenlee M.W., Watanabe T. Efficient learning in children with rapid GABA boosting during and after training. Curr. Biol. 2022;32:5022–5030.e7. doi: 10.1016/j.cub.2022.10.021. [DOI] [PubMed] [Google Scholar]
- 2.Petroff O.A.C. GABA and glutamate in the human brain. Neuroscientist. 2002;8:562–573. doi: 10.1177/1073858402238515. [DOI] [PubMed] [Google Scholar]
- 3.Bertholdo D., Watcharakorn A., Castillo M. Brain proton magnetic resonance spectroscopy: introduction and overview. Neuroimaging Clinics. 2013;23:359–380. doi: 10.1016/j.nic.2012.10.002. [DOI] [PubMed] [Google Scholar]
- 4.Öz G., Alger J.R., Barker P.B., Bartha R., Bizzi A., Boesch C., Bolan P.J., Brindle K.M., Cudalbu C., Dinçer A., et al. MRS Consensus Group Clinical proton MR spectroscopy in central nervous system disorders. Radiology. 2014;270:658–679. doi: 10.1148/radiol.13130531. [DOI] [PMC free article] [PubMed] [Google Scholar]
- 5.Stagg C.J. Magnetic resonance spectroscopy as a tool to study the role of GABA in motor-cortical plasticity. Neuroimage. 2014;86:19–27. doi: 10.1016/j.neuroimage.2013.01.009. [DOI] [PubMed] [Google Scholar]
- 6.Buonocore M.H., Maddock R.J. Magnetic resonance spectroscopy of the brain: a review of physical principles and technical methods. Rev. Neurosci. 2015;26:609–632. doi: 10.1515/revneuro-2015-0010. [DOI] [PubMed] [Google Scholar]
- 7.Mullins P.G., Rowland L.M., Jung R.E., Sibbitt W.L., Jr. A novel technique to study the brain's response to pain: proton magnetic resonance spectroscopy. Neuroimage. 2005;26:642–646. doi: 10.1016/j.neuroimage.2005.02.001. [DOI] [PubMed] [Google Scholar]
- 8.Mullins P.G. Towards a theory of functional magnetic resonance spectroscopy (fMRS): a meta-analysis and discussion of using MRS to measure changes in neurotransmitters in real time. Scand. J. Psychol. 2018;59:91–103. doi: 10.1111/sjop.12411. [DOI] [PubMed] [Google Scholar]
- 9.Stanley J.A., Raz N. Functional magnetic resonance spectroscopy: the “new” MRS for cognitive neuroscience and psychiatry research. Front. Psychiatry. 2018;9:76. doi: 10.3389/fpsyt.2018.00076. [DOI] [PMC free article] [PubMed] [Google Scholar]
- 10.Ip I.B., Bridge H. Investigating the neurochemistry of the human visual system using magnetic resonance spectroscopy. Brain Struct. Funct. 2022;227:1491–1505. doi: 10.1007/s00429-021-02273-0. [DOI] [PMC free article] [PubMed] [Google Scholar]
- 11.Pasanta D., He J.L., Ford T., Oeltzschner G., Lythgoe D.J., Puts N.A. Functional MRS studies of GABA and Glutamate/Glx–a systematic review and meta-analysis. Neurosci. Biobehav. Rev. 2023;144 doi: 10.1016/j.neubiorev.2022.104940. [DOI] [PMC free article] [PubMed] [Google Scholar]
- 12.Duncan N.W., Wiebking C., Northoff G. Associations of regional GABA and glutamate with intrinsic and extrinsic neural activity in humans–a review of multimodal imaging studies. Neurosci. Biobehav. Rev. 2014;47:36–52. doi: 10.1016/j.neubiorev.2014.07.016. [DOI] [PubMed] [Google Scholar]
- 13.Li H., Heise K.F., Chalavi S., Puts N.A.J., Edden R.A.E., Swinnen S.P. The role of MRS-assessed GABA in human behavioral performance. Prog. Neurobiol. 2022;212 doi: 10.1016/j.pneurobio.2022.102247. [DOI] [PubMed] [Google Scholar]
- 14.Taylor R., Neufeld R.W.J., Schaefer B., Densmore M., Rajakumar N., Osuch E.A., Williamson P.C., Théberge J. Functional magnetic resonance spectroscopy of glutamate in schizophrenia and major depressive disorder: anterior cingulate activity during a color-word Stroop task. NPJ Schizophr. 2015;1:15028. doi: 10.1038/npjschz.2015.28. [DOI] [PMC free article] [PubMed] [Google Scholar]
- 15.Jelen L.A., King S., Horne C.M., Lythgoe D.J., Young A.H., Stone J.M. Functional magnetic resonance spectroscopy in patients with schizophrenia and bipolar affective disorder: glutamate dynamics in the anterior cingulate cortex during a working memory task. Eur. Neuropsychopharmacol. 2019;29:222–234. doi: 10.1016/j.euroneuro.2018.12.005. [DOI] [PubMed] [Google Scholar]
- 16.Kaiser L.G., Schuff N., Cashdollar N., Weiner M.W. Age-related glutamate and glutamine concentration changes in normal human brain: 1H MR spectroscopy study at 4 T. Neurobiol. Aging. 2005;26:665–672. doi: 10.1016/j.neurobiolaging.2004.07.001. [DOI] [PMC free article] [PubMed] [Google Scholar]
- 17.Porges E.C., Jensen G., Foster B., Edden R.A., Puts N.A. The trajectory of cortical GABA across the lifespan, an individual participant data meta-analysis of edited MRS studies. Elife. 2021;10 doi: 10.7554/eLife.62575. [DOI] [PMC free article] [PubMed] [Google Scholar]
- 18.Gussew A., Rzanny R., Erdtel M., Scholle H.C., Kaiser W.A., Mentzel H.J., Reichenbach J.R. Time-resolved functional 1H MR spectroscopic detection of glutamate concentration changes in the brain during acute heat pain stimulation. Neuroimage. 2010;49:1895–1902. doi: 10.1016/j.neuroimage.2009.09.007. [DOI] [PubMed] [Google Scholar]
- 19.Apšvalka D., Gadie A., Clemence M., Mullins P.G. Event-related dynamics of glutamate and BOLD effects measured using functional magnetic resonance spectroscopy (fMRS) at 3 T in a repetition suppression paradigm. Neuroimage. 2015;118:292–300. doi: 10.1016/j.neuroimage.2015.06.015. [DOI] [PubMed] [Google Scholar]
- 20.Frank S.M., Forster L., Pawellek M., Malloni W.M., Ahn S., Tse P.U., Greenlee M.W. Visual attention modulates glutamate-glutamine levels in vestibular cortex: evidence from magnetic resonance spectroscopy. J. Neurosci. 2021;41:1970–1981. doi: 10.1523/JNEUROSCI.2018-20.2020. [DOI] [PMC free article] [PubMed] [Google Scholar]
- 21.Frank S.M., Baumann O., Mattingley J.B., Greenlee M.W. Vestibular and visual responses in human posterior insular cortex. J. Neurophysiol. 2014;112:2481–2491. doi: 10.1152/jn.00078.2014. [DOI] [PubMed] [Google Scholar]
- 22.Frank S.M., Wirth A.M., Greenlee M.W. Visual-vestibular processing in the human Sylvian fissure. J. Neurophysiol. 2016;116:263–271. doi: 10.1152/jn.00009.2016. [DOI] [PMC free article] [PubMed] [Google Scholar]
- 23.Frank S.M., Greenlee M.W. The parieto-insular vestibular cortex in humans: more than a single area? J. Neurophysiol. 2018;120:1438–1450. doi: 10.1152/jn.00907.2017. [DOI] [PubMed] [Google Scholar]
- 24.Bottomley P.A. U.S. Patent and Trademark Office; 1984. U.S. Patent No. 4,480,228. [Google Scholar]
- 25.Bottomley P.A. Spatial localization in NMR spectroscopy in vivo. Ann NY Acad Sci. 1987;508:333–348. doi: 10.1111/j.1749-6632.1987.tb32915.x. [DOI] [PubMed] [Google Scholar]
- 26.Mescher M., Tannus A., Johnson M., Garwood M. Solvent suppression using selective echo dephasing. J. Magn. Reson., Ser. A. 1996;123:226–229. [Google Scholar]
- 27.Mescher M., Merkle H., Kirsch J., Garwood M., Gruetter R. Simultaneous in vivo spectral editing and water suppression. NMR Biomed. 1998;11:266–272. doi: 10.1002/(sici)1099-1492(199810)11:6<266::aid-nbm530>3.0.co;2-j. [DOI] [PubMed] [Google Scholar]
- 28.Ramadan S., Lin A., Stanwell P. Glutamate and glutamine: a review of in vivo MRS in the human brain. NMR Biomed. 2013;26:1630–1646. doi: 10.1002/nbm.3045. [DOI] [PMC free article] [PubMed] [Google Scholar]
- 29.Erecińska M., Silver I.A. Metabolism and role of glutamate in mammalian brain. Prog. Neurobiol. 1990;35:245–296. doi: 10.1016/0301-0082(90)90013-7. [DOI] [PubMed] [Google Scholar]
- 30.Henning A., Fuchs A., Murdoch J.B., Boesiger P. Slice-selective FID acquisition, localized by outer volume suppression (FIDLOVS) for 1H-MRSI of the human brain at 7 T with minimal signal loss. NMR Biomed. 2009;22:683–696. doi: 10.1002/nbm.1366. [DOI] [PubMed] [Google Scholar]
- 31.Puts N.A.J., Edden R.A.E. in vivo magnetic resonance spectroscopy of GABA: a methodological review. Prog. Nucl. Magn. Reson. Spectrosc. 2012;60:29–41. doi: 10.1016/j.pnmrs.2011.06.001. [DOI] [PMC free article] [PubMed] [Google Scholar]
- 32.Mullins P.G., McGonigle D.J., O'Gorman R.L., Puts N.A.J., Vidyasagar R., Evans C.J., Cardiff Symposium on MRS of GABA. Edden R.A.E. Current practice in the use of MEGA-PRESS spectroscopy for the detection of GABA. Neuroimage. 2014;86:43–52. doi: 10.1016/j.neuroimage.2012.12.004. [DOI] [PMC free article] [PubMed] [Google Scholar]
- 33.Harris A.D., Saleh M.G., Edden R.A.E. 1H magnetic resonance spectroscopy in vivo: methods and metabolites. Magn. Reson. Med. 2017;77:1377–1389. doi: 10.1002/mrm.26619. [DOI] [PMC free article] [PubMed] [Google Scholar]
- 34.Mikkelsen M., Loo R.S., Puts N.A.J., Edden R.A.E., Harris A.D. Designing GABA-edited magnetic resonance spectroscopy studies: considerations of scan duration, signal-to-noise ratio and sample size. J. Neurosci. Methods. 2018;303:86–94. doi: 10.1016/j.jneumeth.2018.02.012. [DOI] [PMC free article] [PubMed] [Google Scholar]
- 35.Choi I.Y., Andronesi O.C., Barker P., Bogner W., Edden R.A.E., Kaiser L.G., Lee P., Marjańska M., Terpstra M., de Graaf R.A. Spectral editing in 1H magnetic resonance spectroscopy: experts' consensus recommendations. NMR Biomed. 2021;34 doi: 10.1002/nbm.4411. [DOI] [PMC free article] [PubMed] [Google Scholar]
- 36.Maddock R.J., Caton M.D., Ragland J.D. Estimating glutamate and Glx from GABA-optimized MEGA-PRESS: off-resonance but not difference spectra values correspond to PRESS values. Psychiatry Res. Neuroimaging. 2018;279:22–30. doi: 10.1016/j.pscychresns.2018.07.003. [DOI] [PMC free article] [PubMed] [Google Scholar]
- 37.Bell T., Boudes E.S., Loo R.S., Barker G.J., Lythgoe D.J., Edden R.A.E., Lebel R.M., Wilson M., Harris A.D. in vivo Glx and Glu measurements from GABA-edited MRS at 3 T. NMR Biomed. 2021;34:e4245. doi: 10.1002/nbm.4245. [DOI] [PMC free article] [PubMed] [Google Scholar]
- 38.Thielen J.W., Hong D., Rohani Rankouhi S., Wiltfang J., Fernández G., Norris D.G., Tendolkar I. The increase in medial prefrontal glutamate/glutamine concentration during memory encoding is associated with better memory performance and stronger functional connectivity in the human medial prefrontal–thalamus–hippocampus network. Hum. Brain Mapp. 2018;39:2381–2390. doi: 10.1002/hbm.24008. [DOI] [PMC free article] [PubMed] [Google Scholar]
- 39.Tamaki M., Wang Z., Barnes-Diana T., Guo D., Berard A.V., Walsh E., Watanabe T., Sasaki Y. Complementary contributions of non-REM and REM sleep to visual learning. Nat. Neurosci. 2020;23:1150–1156. doi: 10.1038/s41593-020-0666-y. [DOI] [PMC free article] [PubMed] [Google Scholar]
- 40.Shibata K., Sasaki Y., Bang J.W., Walsh E.G., Machizawa M.G., Tamaki M., Chang L.-H., Watanabe T. Overlearning hyperstabilizes a skill by rapidly making neurochemical processing inhibitory-dominant. Nat. Neurosci. 2017;20:470–475. doi: 10.1038/nn.4490. [DOI] [PMC free article] [PubMed] [Google Scholar]
- 41.Bang J.W., Shibata K., Frank S.M., Walsh E.G., Greenlee M.W., Watanabe T., Sasaki Y. Consolidation and reconsolidation share behavioural and neurochemical mechanisms. Nat. Hum. Behav. 2018;2:507–513. doi: 10.1038/s41562-018-0366-8. [DOI] [PMC free article] [PubMed] [Google Scholar]
- 42.Ogg R.J., Kingsley P.B., Taylor J.S. WET, a T1-and B1-insensitive water-suppression method for in vivo localized 1H NMR spectroscopy. J. Magn. Reson. B. 1994;104:1–10. doi: 10.1006/jmrb.1994.1048. [DOI] [PubMed] [Google Scholar]
- 43.Tkáč I., Deelchand D., Dreher W., Hetherington H., Kreis R., Kumaragamage C., Považan M., Spielman D.M., Strasser B., de Graaf R.A. Water and lipid suppression techniques for advanced 1H MRS and MRSI of the human brain: experts' consensus recommendations. NMR Biomed. 2021;34:e4459. doi: 10.1002/nbm.4459. [DOI] [PMC free article] [PubMed] [Google Scholar]
- 44.Tkác I., Öz G., Adriany G., Uğurbil K., Gruetter R. in vivo1H NMR spectroscopy of the human brain at high magnetic fields: metabolite quantification at 4T vs. 7T. Magn. Reson. Med. 2009;62:868–879. doi: 10.1002/mrm.22086. [DOI] [PMC free article] [PubMed] [Google Scholar]
- 45.Rothman D.L., Behar K.L., Hyder F., Shulman R.G. in vivo NMR studies of the glutamate neurotransmitter flux and neuroenergetics: implications for brain function. Annu. Rev. Physiol. 2003;65:401–427. doi: 10.1146/annurev.physiol.65.092101.142131. [DOI] [PubMed] [Google Scholar]
- 46.Bak L.K., Schousboe A., Waagepetersen H.S. The glutamate/GABA-glutamine cycle: aspects of transport, neurotransmitter homeostasis and ammonia transfer. J. Neurochem. 2006;98:641–653. doi: 10.1111/j.1471-4159.2006.03913.x. [DOI] [PubMed] [Google Scholar]
- 47.Kauppinen R.A., Pirttilä T.R., Auriola S.O., Williams S.R. Compartmentation of cerebral glutamate in situ as detected by 1H/13C nmr. Biochem. J. 1994;298:121–127. doi: 10.1042/bj2980121. [DOI] [PMC free article] [PubMed] [Google Scholar]
- 48.Dale A.M., Fischl B., Sereno M.I. Cortical surface-based analysis: I. Segmentation and surface reconstruction. Neuroimage. 1999;9:179–194. doi: 10.1006/nimg.1998.0395. [DOI] [PubMed] [Google Scholar]
- 49.Fischl B., Sereno M.I., Dale A.M. Cortical surface-based analysis: II: Inflation, flattening, and a surface-based coordinate system. Neuroimage. 1999;9:195–207. doi: 10.1006/nimg.1998.0396. [DOI] [PubMed] [Google Scholar]
- 50.Provencher S.W. Estimation of metabolite concentrations from localized in vivo proton NMR spectra. Magn. Reson. Med. 1993;30:672–679. doi: 10.1002/mrm.1910300604. [DOI] [PubMed] [Google Scholar]
- 51.Provencher S.W. Automatic quantitation of localized in vivo1H spectra with LCModel. NMR Biomed. 2001;14:260–264. doi: 10.1002/nbm.698. [DOI] [PubMed] [Google Scholar]
- 52.Oeltzschner G., Zöllner H.J., Hui S.C.N., Mikkelsen M., Saleh M.G., Tapper S., Edden R.A.E. Osprey: open-source processing, reconstruction & estimation of magnetic resonance spectroscopy data. J. Neurosci. Methods. 2020;343 doi: 10.1016/j.jneumeth.2020.108827. [DOI] [PMC free article] [PubMed] [Google Scholar]
- 53.Brainard D.H. The psychophysics toolbox. Spat. Vis. 1997;10:433–436. [PubMed] [Google Scholar]
- 54.Pelli D.G. The VideoToolbox software for visual psychophysics: transforming numbers into movies. Spat. Vis. 1997;10:437–442. [PubMed] [Google Scholar]
- 55.Snellen H. P. W. Van De Weijer; 1862. Probebuchstaben zur Bestimmung der Sehschärfe. [Google Scholar]
- 56.Epperson C.N., Haga K., Mason G.F., Sellers E., Gueorguieva R., Zhang W., Weiss E., Rothman D.L., Krystal J.H. Cortical γ-aminobutyric acid levels across the menstrual cycle in healthy women and those with premenstrual dysphoric disorder: a proton magnetic resonance spectroscopy study. Arch. Gen. Psychiatry. 2002;59:851–858. doi: 10.1001/archpsyc.59.9.851. [DOI] [PubMed] [Google Scholar]
- 57.Epperson C.N., O’Malley S., Czarkowski K.A., Gueorguieva R., Jatlow P., Sanacora G., Rothman D.L., Krystal J.H., Mason G.F. Sex, GABA, and nicotine: the impact of smoking on cortical GABA levels across the menstrual cycle as measured with proton magnetic resonance spectroscopy. Biol. Psychiatry. 2005;57:44–48. doi: 10.1016/j.biopsych.2004.09.021. [DOI] [PMC free article] [PubMed] [Google Scholar]
- 58.Harada M., Kubo H., Nose A., Nishitani H., Matsuda T. Measurement of variation in the human cerebral GABA level by in vivo MEGA-editing proton MR spectroscopy using a clinical 3 T instrument and its dependence on brain region and the female menstrual cycle. Hum. Brain Mapp. 2011;32:828–833. doi: 10.1002/hbm.21086. [DOI] [PMC free article] [PubMed] [Google Scholar]
- 59.De Bondt T., De Belder F., Vanhevel F., Jacquemyn Y., Parizel P.M. Prefrontal GABA concentration changes in women–Influence of menstrual cycle phase, hormonal contraceptive use, and correlation with premenstrual symptoms. Brain Res. 2015;1597:129–138. doi: 10.1016/j.brainres.2014.11.051. [DOI] [PubMed] [Google Scholar]
- 60.Frank S.M., Qi A., Ravasio D., Sasaki Y., Rosen E.L., Watanabe T. A behavioral training protocol using visual perceptual learning to improve a visual skill. STAR Protoc. 2021;2 doi: 10.1016/j.xpro.2020.100240. [DOI] [PMC free article] [PubMed] [Google Scholar]
- 61.Kurcyus K., Annac E., Hanning N.M., Harris A.D., Oeltzschner G., Edden R., Riedl V. Opposite dynamics of GABA and glutamate levels in the occipital cortex during visual processing. J. Neurosci. 2018;38:9967–9976. doi: 10.1523/JNEUROSCI.1214-18.2018. [DOI] [PMC free article] [PubMed] [Google Scholar]
- 62.Frank S.M., Reavis E.A., Tse P.U., Greenlee M.W. Neural mechanisms of feature conjunction learning: enduring changes in occipital cortex after a week of training. Hum. Brain Mapp. 2014;35:1201–1211. doi: 10.1002/hbm.22245. [DOI] [PMC free article] [PubMed] [Google Scholar]
- 63.Frank S.M., Reavis E.A., Greenlee M.W., Tse P.U. Pretraining cortical thickness predicts subsequent perceptual learning rate in a visual search task. Cereb. Cortex. 2016;26:1211–1220. doi: 10.1093/cercor/bhu309. [DOI] [PubMed] [Google Scholar]
- 64.Frank S.M., Greenlee M.W., Tse P.U. Long time no see: enduring behavioral and neuronal changes in perceptual learning of motion trajectories 3 years after training. Cereb. Cortex. 2018;28:1260–1271. doi: 10.1093/cercor/bhx039. [DOI] [PubMed] [Google Scholar]
- 65.Frank S.M., Qi A., Ravasio D., Sasaki Y., Rosen E.L., Watanabe T. Supervised learning occurs in visual perceptual learning of complex natural images. Curr. Biol. 2020;30:2995–3000.e3. doi: 10.1016/j.cub.2020.05.050. [DOI] [PMC free article] [PubMed] [Google Scholar]
- 66.Frank S.M., Bründl S., Frank U.I., Sasaki Y., Greenlee M.W., Watanabe T. Fundamental differences in visual perceptual learning between children and adults. Curr. Biol. 2021;31:427–432.e5. doi: 10.1016/j.cub.2020.10.047. [DOI] [PubMed] [Google Scholar]
- 67.Floyer-Lea A., Wylezinska M., Kincses T., Matthews P.M. Rapid modulation of GABA concentration in human sensorimotor cortex during motor learning. J. Neurophysiol. 2006;95:1639–1644. doi: 10.1152/jn.00346.2005. [DOI] [PubMed] [Google Scholar]
- 68.Frangou P., Emir U.E., Karlaftis V.M., Nettekoven C., Hinson E.L., Larcombe S., Bridge H., Stagg C.J., Kourtzi Z. Learning to optimize perceptual decisions through suppressive interactions in the human brain. Nat. Commun. 2019;10:474. doi: 10.1038/s41467-019-08313-y. [DOI] [PMC free article] [PubMed] [Google Scholar]
- 69.Kolasinski J., Hinson E.L., Divanbeighi Zand A.P., Rizov A., Emir U.E., Stagg C.J. The dynamics of cortical GABA in human motor learning. J. Physiol. 2019;597:271–282. doi: 10.1113/JP276626. [DOI] [PMC free article] [PubMed] [Google Scholar]
- 70.Pouwels P.J., Frahm J. Regional metabolite concentrations in human brain as determined by quantitative localized proton MRS. Magn. Reson. Med. 1998;39:53–60. doi: 10.1002/mrm.1910390110. [DOI] [PubMed] [Google Scholar]
- 71.Lally N., Mullins P.G., Roberts M.V., Price D., Gruber T., Haenschel C. Glutamatergic correlates of gamma-band oscillatory activity during cognition: a concurrent ER-MRS and EEG study. Neuroimage. 2014;85:823–833. doi: 10.1016/j.neuroimage.2013.07.049. [DOI] [PubMed] [Google Scholar]
- 72.Harris A.D., Puts N.A.J., Edden R.A.E. Tissue correction for GABA-edited MRS: considerations of voxel composition, tissue segmentation, and tissue relaxations. J. Magn. Reson. Imaging. 2015;42:1431–1440. doi: 10.1002/jmri.24903. [DOI] [PMC free article] [PubMed] [Google Scholar]
- 73.Mikkelsen M., Singh K.D., Brealy J.A., Linden D.E.J., Evans C.J. Quantification of γ-aminobutyric acid (GABA) in 1H MRS volumes composed heterogeneously of grey and white matter. NMR Biomed. 2016;29:1644–1655. doi: 10.1002/nbm.3622. [DOI] [PubMed] [Google Scholar]
- 74.Kolasinski J., Logan J.P., Hinson E.L., Manners D., Divanbeighi Zand A.P., Makin T.R., Emir U.E., Stagg C.J. A mechanistic link from GABA to cortical architecture and perception. Curr. Biol. 2017;27:1685–1691.e3. doi: 10.1016/j.cub.2017.04.055. [DOI] [PMC free article] [PubMed] [Google Scholar]
- 75.Porges E.C., Woods A.J., Lamb D.G., Williamson J.B., Cohen R.A., Edden R.A.E., Harris A.D. Impact of tissue correction strategy on GABA-edited MRS findings. Neuroimage. 2017;162:249–256. doi: 10.1016/j.neuroimage.2017.08.073. [DOI] [PMC free article] [PubMed] [Google Scholar]
- 76.Petroff O.A., Spencer D.D., Alger J.R., Prichard J.W. High-field proton magnetic resonance spectroscopy of human cerebrum obtained during surgery for epilepsy. Neurology. 1989;39:1197–1202. doi: 10.1212/wnl.39.9.1197. [DOI] [PubMed] [Google Scholar]
- 77.Jensen J.E., Frederick B.d.B., Renshaw P.F. Grey and white matter GABA level differences in the human brain using two-dimensional, J-resolved spectroscopic imaging. NMR Biomed. 2005;18:570–576. doi: 10.1002/nbm.994. [DOI] [PubMed] [Google Scholar]
- 78.Glasser M.F., Coalson T.S., Robinson E.C., Hacker C.D., Harwell J., Yacoub E., Ugurbil K., Andersson J., Beckmann C.F., Jenkinson M., et al. A multi-modal parcellation of human cerebral cortex. Nature. 2016;536:171–178. doi: 10.1038/nature18933. [DOI] [PMC free article] [PubMed] [Google Scholar]
- 79.Barker P.B., Soher B.J., Blackband S.J., Chatham J.C., Mathews V.P., Bryan R.N. Quantitation of proton NMR spectra of the human brain using tissue water as an internal concentration reference. NMR Biomed. 1993;6:89–94. doi: 10.1002/nbm.1940060114. [DOI] [PubMed] [Google Scholar]
- 80.Mikkelsen M., Rimbault D.L., Barker P.B., Bhattacharyya P.K., Brix M.K., Buur P.F., Cecil K.M., Chan K.L., Chen D.Y.T., Craven A.R., Edden R.A. Big GABA II: water-referenced edited MR spectroscopy at 25 research sites. Neuroimage. 2019;191:537–548. doi: 10.1016/j.neuroimage.2019.02.059. [DOI] [PMC free article] [PubMed] [Google Scholar]
- 81.Rae C.D. A guide to the metabolic pathways and function of metabolites observed in human brain 1H magnetic resonance spectra. Neurochem. Res. 2014;39:1–36. doi: 10.1007/s11064-013-1199-5. [DOI] [PubMed] [Google Scholar]
- 82.White T.L., Monnig M.A., Walsh E.G., Nitenson A.Z., Harris A.D., Cohen R.A., Porges E.C., Woods A.J., Lamb D.G., Boyd C.A., Fekir S. Psychostimulant drug effects on glutamate, Glx, and creatine in the anterior cingulate cortex and subjective response in healthy humans. Neuropsychopharmacology. 2018;43:1498–1509. doi: 10.1038/s41386-018-0027-7. [DOI] [PMC free article] [PubMed] [Google Scholar]
- 83.Njau S., Joshi S.H., Espinoza R., Leaver A.M., Vasavada M., Marquina A., Woods R.P., Narr K.L. Neurochemical correlates of rapid treatment response to electroconvulsive therapy in patients with major depression. J. Psychiatry Neurosci. 2017;42:6–16. doi: 10.1503/jpn.150177. [DOI] [PMC free article] [PubMed] [Google Scholar]
- 84.Froemke R.C. Plasticity of cortical excitatory-inhibitory balance. Annu. Rev. Neurosci. 2015;38:195–219. doi: 10.1146/annurev-neuro-071714-034002. [DOI] [PMC free article] [PubMed] [Google Scholar]
- 85.Tatti R., Haley M.S., Swanson O.K., Tselha T., Maffei A. Neurophysiology and regulation of the balance between excitation and inhibition in neocortical circuits. Biol. Psychiatry. 2017;81:821–831. doi: 10.1016/j.biopsych.2016.09.017. [DOI] [PMC free article] [PubMed] [Google Scholar]
- 86.Hensch T.K., Fagiolini M. Excitatory–inhibitory balance and critical period plasticity in developing visual cortex. Prog. Brain Res. 2005;147:115–124. doi: 10.1016/S0079-6123(04)47009-5. [DOI] [PubMed] [Google Scholar]
- 87.Bhattacharyya P.K., Phillips M.D., Stone L.A., Lowe M.J. In-vivo MRS measurement of gray-matter and white-matter GABA concentration in sensorimotor cortex using a motion-controlled MEGA-PRESS Sequence. Magn. Reson. Imaging. 2011;29:374–379. doi: 10.1016/j.mri.2010.10.009. [DOI] [PMC free article] [PubMed] [Google Scholar]
- 88.Terpstra M., Ugurbil K., Gruetter R. Direct in vivo measurement of human cerebral GABA concentration using MEGA-editing at 7 Tesla. Magn. Reson. Med. 2002;47:1009–1012. doi: 10.1002/mrm.10146. [DOI] [PubMed] [Google Scholar]
Associated Data
This section collects any data citations, data availability statements, or supplementary materials included in this article.
Data Availability Statement
The data generated in the original study are available at the following site: https://doi.org/10.17632/xvyp2ph8jh.1.