

Abstract
The plainfin midshipman fish (Porichthys notatus) is a nocturnal, seasonally breeding, intertidal-nesting teleost fish that produces social acoustic signals for intraspecific communication. Type I or “nesting” males produce agonistic and reproductive-related acoustic signals including a multiharmonic advertisement call during the summer breeding season. Previous work showed that type I male auditory sensitivity of the saccule, the primary midshipman auditory end organ, changes seasonally with reproductive state such that reproductive males become more sensitive and better suited than nonreproductive males to detect the dominant frequencies contained within type I vocalizations. Here, we examine whether reproductive type I males also exhibit reproductive-state dependent changes in hair cell (HC) density in the three putative auditory end organs (saccule, lagena, and utricle). We show that saccular HC density was greater in reproductive type I males compared to nonreproductive type I males, and that the increase in HC density occurs throughout the saccular epithelium in both the central and marginal epithelia regions. We also show as saccular HC density increases there is a concurrent decrease in saccular support cell (SC) density in reproductive type I males with no overall change in total cell density (i.e., HC + SC). In contrast, we did not observe any seasonal changes in HC density in the utricle or lagena between nonreproductive and reproductive type I males. In addition, we compare the saccular HC densities in reproductive type I males with that of reproductive females and show that females have greater saccular HC densities, which suggest a sexually dimorphic difference in HC receptor density between the two sexual phenotypes, at least during the summer breeding season.
Keywords: Auditory plasticity, support cell, acoustic communication, inner ear, lagena, utricle
1. Introduction
Auditory sensory epithelia in mammals stop growing after early postnatal development and the hair cells (HCs) that compose the mammalian auditory epithelia lack the capacity to regenerate after cell damage or death (for review see Brignull et al., 2009). In contrast, auditory epithelia in fishes continue to grow beyond postembryonic development and into the adult life history stage (Corwin, 1981; Popper and Hoxter, 1984; Lombarte and Popper, 1994) and the HCs in adult fish are capable of regenerating after injury or death (Lombarte et al., 1993; Millimaki et al., 2010; for review see Warchol, 2011; Smith and Monroe, 2016). Previous fish postembryonic studies have demonstrated that HC addition can occur at the edges or in the “marginal zones” of sensory epithelia in elasmobranch fishes (Corwin, 1981; Corwin, 1983) and throughout the entire sensory epithelia including inner “central zones” at some distance away from the edges of sensory epithelia in teleost fishes (Popper and Hoxter, 1990; Lanford et al., 1996). Postembryonic HC addition is also known to occur in all three of the putative auditory end organs (saccule, lagena, and utricle) in teleosts throughout ontogeny and into the adult life history stage (Lombarte and Popper, 1994; Chaves et al., 2017).
A novel form of HC addition that is posited to be adaptive for the reception of social acoustic signals was previously reported for the plainfin midshipman fish (Porichthys notatus) (Coffin et al., 2012). Female midshipman were found to exhibit a seasonal change in HC addition, measured as an increase in HC density, that was specific to the saccule, the main auditory end organ in midshipman and most other teleost fishes, while no seasonal changes in HC densities were found in the lagena or utricle. The seasonal increase in saccular HC density was concurrent with seasonal changes in auditory saccular HC sensitivity such that reproductive females were 2.5 to 5.5 times (~8 to 15 dB re 1 μPa) more sensitive than nonreproductive females across a broad range of frequencies (Coffin et al., 2012). This increased auditory saccular sensitivity in females is thought to be adaptive for the enhanced detection and localization of conspecific mates during the breeding season. Although such changes in saccular HC sensitivity were first reported for female midshipman, seasonal plasticity of saccular HC sensitivity has also been reported in the nesting, vocal “type I” male midshipman, which produces multiharmonic advertisement calls to attract females for spawning during the breeding season (Rohmann and Bass, 2011). Whether seasonal changes in saccular HC sensitivity in type I males are related to seasonal changes in saccular HC density remain unknown.
The primary aim of this study was to determine if vocal type I male midshipman exhibit seasonal, reproductive-state dependent changes in HC density in the putative auditory end organs (saccule, lagena, and utricle) of the midshipman inner ear. We examine whether seasonal changes in HC density only occurs in the saccule as previously reported in females (Coffin et al., 2012). A secondary aim of the study was to determine whether the density of support cells (SCs) in the saccular epithelium changes seasonally with reproductive state in type I males. We also examine and compare saccular HC density in summer reproductive females with that of summer reproductive type I males to determine whether there are sexually dimorphic differences in the density of auditory receptors between type I males and females during the breeding season. We compare our findings of HC density changes in type I males with that previously reported for females (Coffin et al., 2012) and interpret our results as they relate to possible adaptations for the reception of social acoustic signals during the breeding season.
2. Materials and Methods
2.1. Tissue collection
2.1.1. Animal collection/care:
We collected winter, nonreproductive type I male midshipman via otter trawl in Monterey Bay near Moss Landing, CA in February 2018 (R/V John H. Martin, Moss Landing Marine Laboratories) at depths from 85–100 m. We hand-collected summer reproductive type I males from their nests at low tide in Tomales Bay near Marshall, CA in May 2018. We also hand-collected reproductive females from male nests at low tide in the Hood Canal near Brinnon, WA in June/July 2018. After collection, we relocated all fish to 50-gallon recirculating saltwater tanks at the University of Washington with a 12/12-hour light/dark cycle for reproductive fish collected during the summer and 8/16-hour light/dark cycle for nonreproductive fish collected during the winter. We fed animals de-shelled shrimp every 3–4 days and held them for 2 weeks or less before tissue collection. We recorded morphometrics, including standard length (SL), body mass (BM), body condition (Fulton’s K, calculated by 100 × the quotient of BM divided by SL3), and gonadosomatic index (GSI, calculated by 100 × the quotient of wet gonad mass divided by BM minus gonad mass) for all animals.
2.1.2. Tissue collection:
Prior to sacrifice and tissue collection, we anesthetized midshipman in 10% benzocaine saltwater bath. Once fish were fully anesthetized, we transcardially perfused them with teleost ringer solution followed by fixation with 4% paraformaldehyde dissolved in 0.1 M phosphate buffer (PB). We immediately extracted the brains and intact inner ears separately following dorsal craniotomy and post-fixed the collected tissue in 4% paraformaldehyde in 0.1 M PB for 1 hour. We then washed tissue with 0.1 M PB and decoupled saccule, utricle, and lagena sensory epithelia from the otoliths by cutting around the end organ capsule and removing the otoliths and otolith membrane with forceps. We stored the auditory sensory epithelia in 0.1 M PB with 0.3% sodium azide for up to 6 months at +4°C prior to phalloidin staining. All animal care and tissue collection procedures were approved by University of Washington Institutional Care and Use Committee.
2.2. Morphology
2.2.1. Phalloidin staining:
We washed saccule, utricle, and lagena sensory epithelia twice with 0.1M phosphate buffered saline (PBS) and incubated them for 1 hour with phalloidin conjugated to rhodamine (Thermo Fisher Scientific Invitrogen, cat. no. R415) diluted 1:40 in 0.1 M PBS. We washed epithelia again with 0.1 M PBS and then placed them on coverslips (oriented with apical sides against the coverslip) and whole mounted them in Fluoromount-G mounting media (Southern Biotech, cat. no. 0100–01) onto slides. We sealed slides with nail polish and stored them at +4° C in the dark until fluorescence imaging.
2.2.2. Hair cell imaging:
The apical surface of HCs are highly reactive to phalloidin because HC stereocilia and the cuticular plate contain a high density of F-actin to which phalloidin binds. We imaged all epithelia on a Leica SP5 inverted confocal microscope (Leica Microsystems, Buffalo Grove, IL) with excitation/emission spectra set at 560/570–620nm. We imaged stereocilia bundles in z-series using a 40 × 1.25 NA oil immersion objective in 7 discrete saccular regions (see Fig. 1, top left panel) and 3 discrete utricle and lagena regions (n = 11–13) (see Fig. 2) similar to those described previously by Coffin et al. (2012). These auditory epithelia regions were selected to include both marginal and central regions in both rostral/caudal and dorsal/ventral areas of the sensory epithelia. We captured z-series in steps of 0.5 nm via Leica Application Suite Advanced Fluorescence software (Leica Microsystems).
Figure 1.
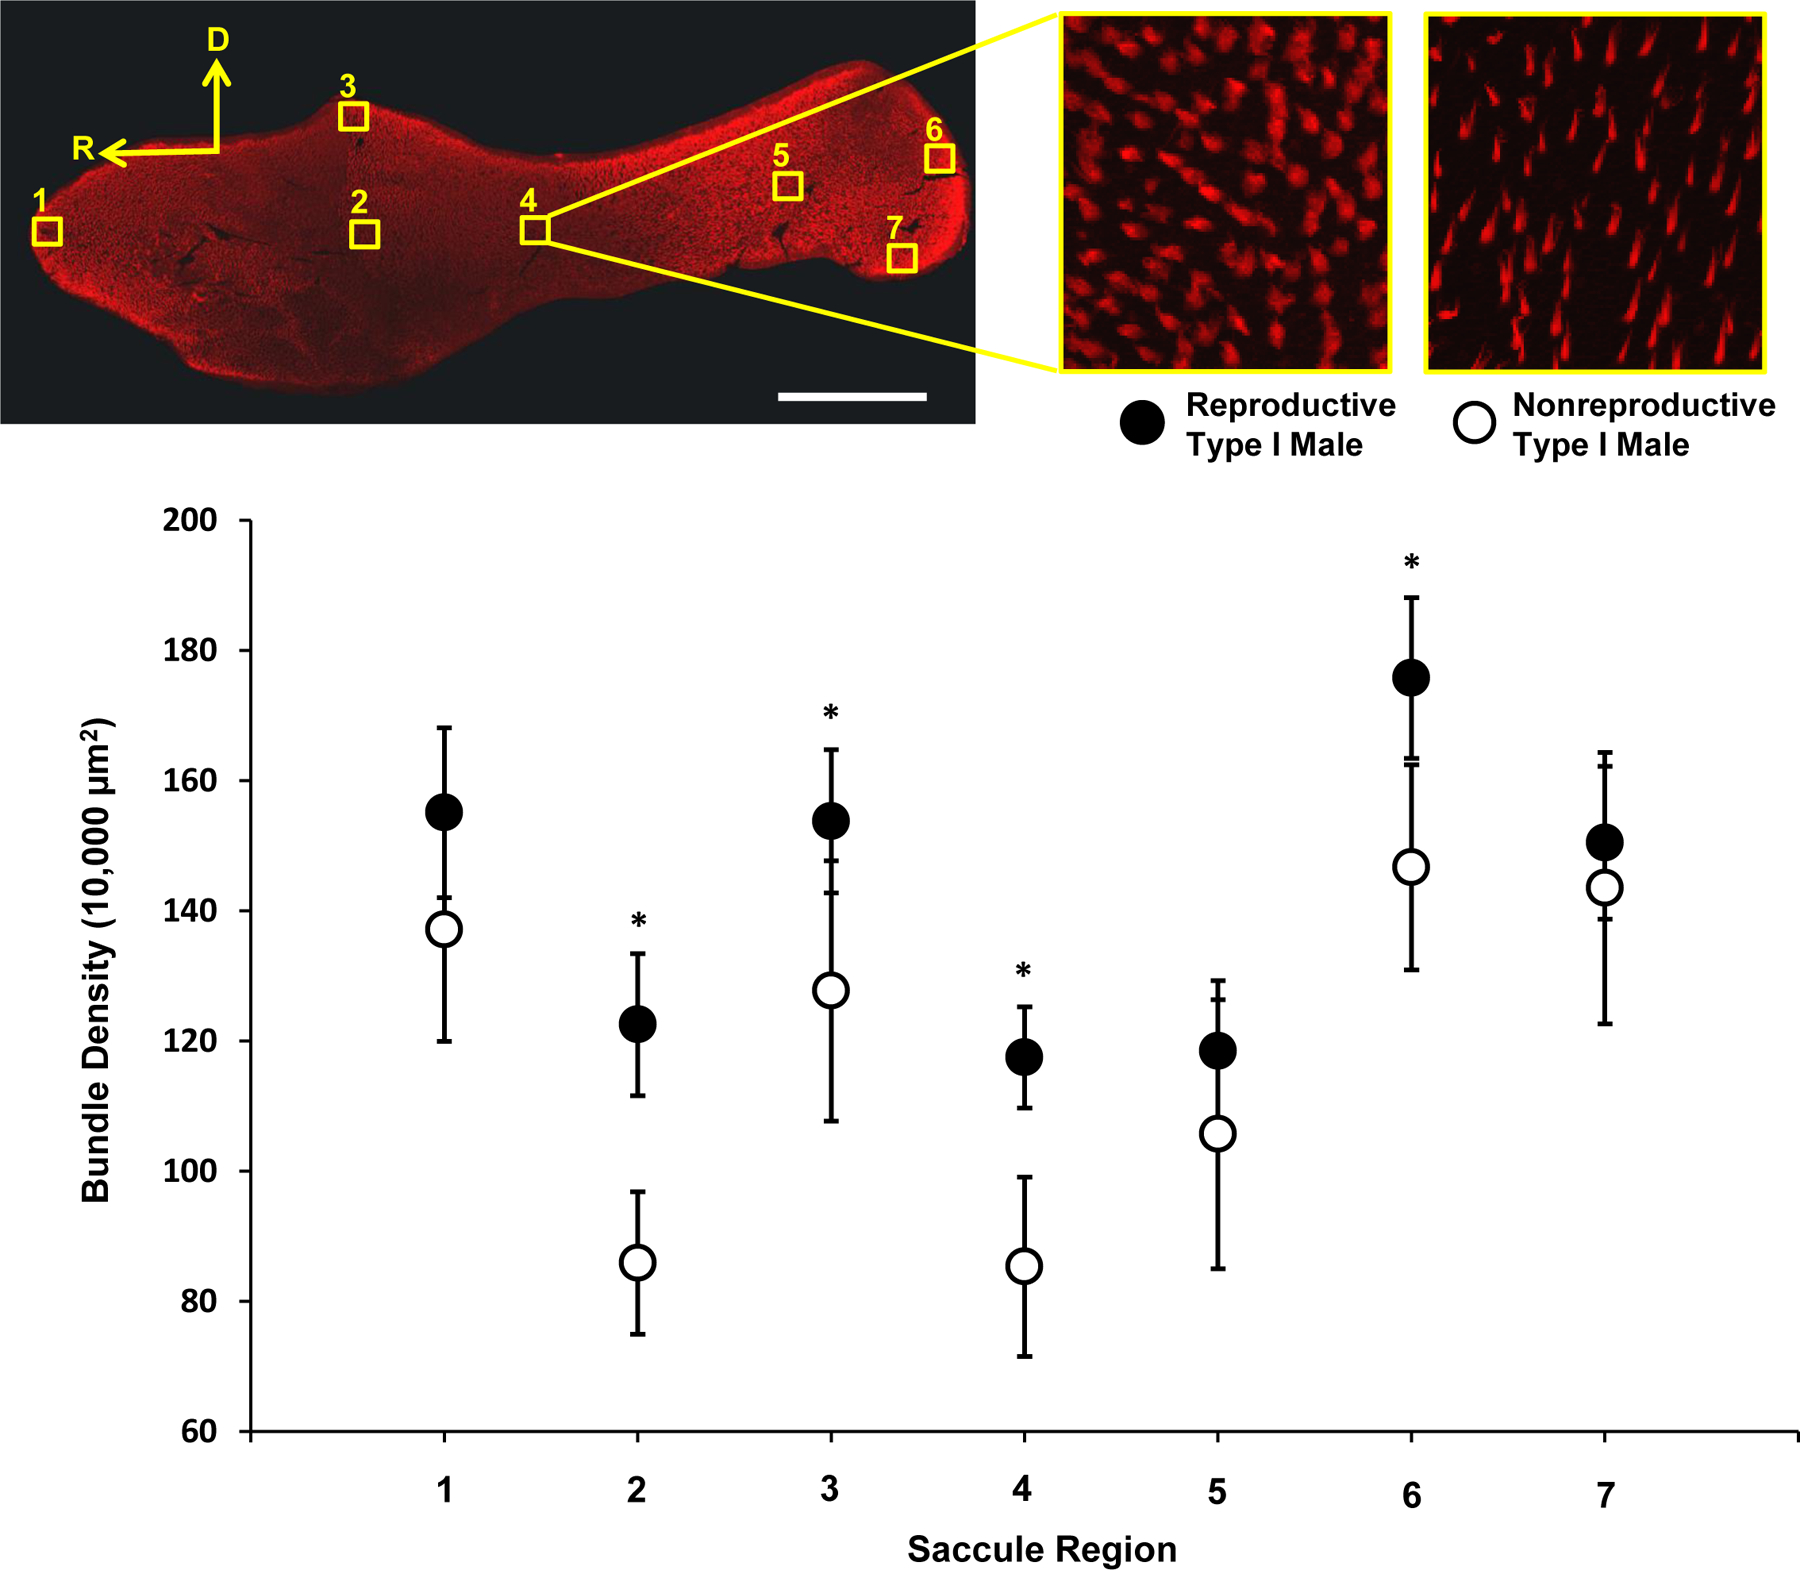
Saccular hair cell (HC) density in nonreproductive and reproductive type I males. Top panel, left: Hair cells were quantified in 4 marginal regions (1, 3, 6, and 7) and 3 central regions (2, 4, and 5). For HC counts, each region had a defined 100μm × 100μm square area and for SC counts, each region was a 50μm × 50μm square area. Top panel, middle, right: A representative comparison of saccular HC densities in epithelia region 4 of the saccule between a reproductive type I male (middle) and a nonreproductive type I male (right). White scale bar = 500μm. Bottom panel: Bundle density (HC/10,000μm2) was significantly greater in saccules of reproductive type I males compared to nonreproductive type I males. Data are plotted as means ±95% CI; * = p < 0.05. Filled symbols represent reproductive type I males while open symbols represent nonreproductive type I males.
Figure 2.
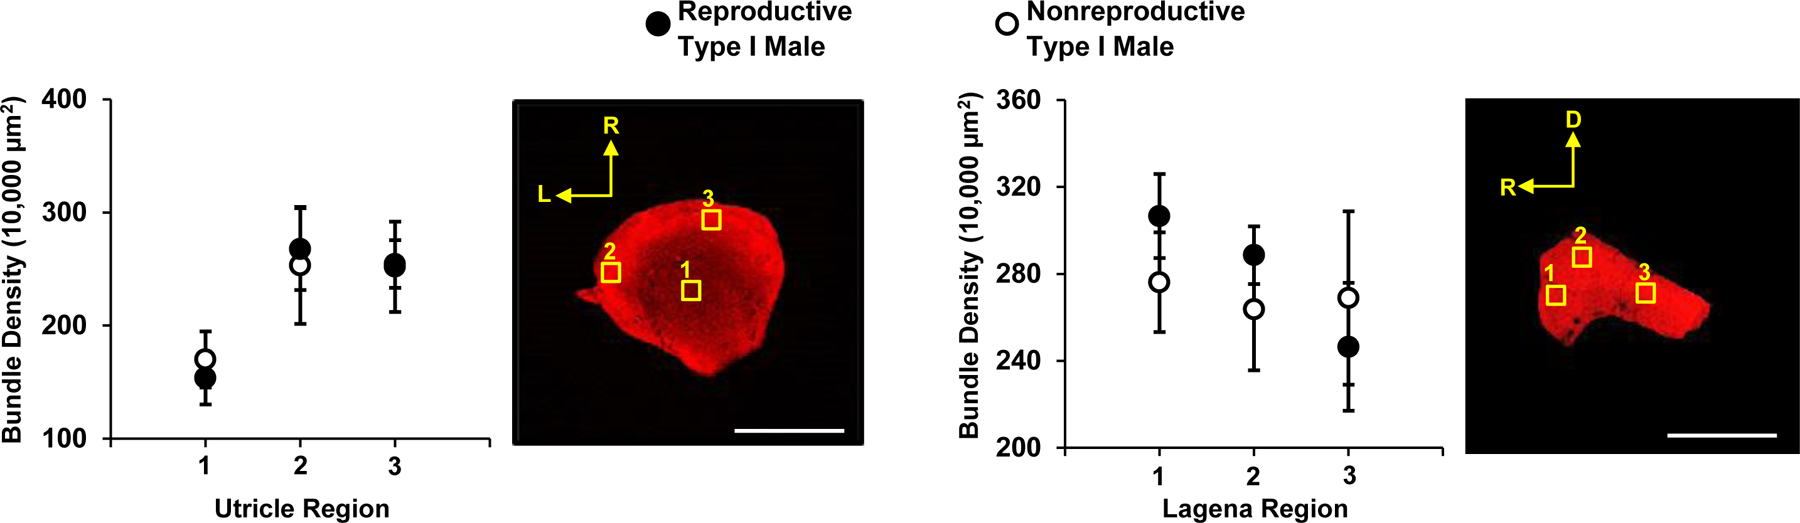
Utricular and lagenar hair cell (HC) density in nonreproductive and reproductive type I males. There was no difference in bundle density (HC/10,000μm2) between reproductive and nonreproductive type I males in the utricle (left figure) or lagena (right). Data are plotted as means ±95% CI; p > 0.05. White scale bar = 500μm. Filled symbols represent reproductive type I males while open symbols represent nonreproductive type I males.
2.2.3. Support cell imaging:
SCs contain a circumferential belt of F-actin close to the apical surface which binds phalloidin. Because this F-actin belt is located near the apical surface, we could image apical SCs in conjunction with HCs and defined SCs as cell outlines lacking stereocilia. We counted SCs and HCs in region 2 (a central region) and region 3 (a marginal region) (see Fig. 1, top left panel) in the saccules of nonreproductive (n = 8) and reproductive (n = 8) type I males using 63 × 1.4 NA oil immersion objective. Sample sizes were slightly smaller (n = 8) in SC/HC counts at this higher magnification compared to HC-only counts (n = 11–13) because HC stereocilia obscured the ability to visualize SCs in some of the samples which we did not attempt to analyze.
2.2.4. Hair cell/support cell quantification:
We quantified all HCs and SCs using Image-J software. To quantify HCs, we stacked z-series for each region into a single image and total HCs were counted in a 100μm X 100μm square area. We defined a HC as a separate stereocilia bundle. We included every bundle that was partially contained within each 100μm X 100μm square area in our analysis. Because we imaged SCs at a higher magnification than for HC-only counts, these counts were made in a 50μm X 50μm square area. SCs that were only partially represented in each 50μm X 50μm square area we also included in all analyses. In a separate analysis, we also counted HCs within each 50μm X 50μm square area to determine the spatial relationships between SC and HC densities and to better understand the relative densities of these two cell types at the apical layer.
2.2.5. Statistical analyses:
To eliminate the possibility that morphometrics such as SL, BM, and K were a confound in this study we analyzed potential differences by conducting independent samples t-tests for each morphometric between reproductive and nonreproductive type I males and then between reproductive type I males and females separately. We also used an independent samples t-test to determine if GSI differed between reproductive and nonreproductive type I males. We analyzed differences in HC density between reproductive and nonreproductive type I males in separate two-way ANOVAs for each end organ with reproductive condition and end organ epithelial region as the independent variables and then conducted separate a priori t-tests to examine differences in each of the 7 saccular regions between reproductive and nonreproductive type I males (i.e., we only compared region 1 of nonreproductive males with region 1 of reproductive males and region 2 of nonreproductive males with region 2 of reproductive males, etc). We used the same statistical methods to compare saccular HC density between reproductive females and reproductive type I males. Because the three largest reproductive type I males exceeded the size range of reproductive females (see Fig. 5, 6), we excluded the three largest males from the ANOVA and a priori t-tests comparing HC density in type I males vs. females. We took this conservative approach to ensure there was no confounding effect of SL on HC density. Using counts from the 50μm × 50μm square areas in saccular regions 2 and 3, we analyzed differences in SC density, HC density, and total apical cell density (HCs + SCs) in 3 separate two-way ANOVAs across reproductive and nonreproductive type I males . Lastly, we ran 2 separate multiple regression analyses with SL and sexual phenotype (reproductive females vs. reproductive type I males, and reproductive vs. nonreproductive type I males) as predictor variables and HC density as the criterion variable.
Figure 5.

Saccular HC density plotted over standard length. HC density did not correlate with SL in nonreproductive type I males, reproductive type I males, or reproductive females; p > .05. Data are plotted as combined counts of all 7 regions in the saccule per individual within each phenotype.
Figure 6.

HC quantities in the saccule were estimated using the method described in Popper and Hoxter, 1984 (see methods section 2.2.6 for details) and plotted as a function of SL.
2.2.6. Saccule area measurements:
To estimate HC quantities in type I males and females, we imaged whole saccules at 10 × 0.4 NA dry objective and merged in Adobe Photoshop. Whole saccule area was measured in Image-J. We then measured the area of the central zone (delineated visually as the area surrounded by the more stereocilia-dense outer margin) and calculated the area of the marginal zone for each individual midshipman by subtracting the central zone from the whole saccule area. We estimated total number of HCs in individual saccules using the following equation described by Popper and Hoxter (1984):
, where
and = the sum of HC bundles counted in all central and marginal regions,
and = the total area of the central and marginal zones measured in Image-J (in μm2), and
and = the summed area (in μm2) of the central and marginal regions operationally defined as the 100μm X 100μm square areas allotted for each region in Image-J (i.e., 30,000 μm2 and 40,000 μm2, respectively).
We then plotted total estimated HCs relative to SL to visualize HC quantities as a function of type I male and female size.
3. Results
3.1. Morphometrics:
We sampled a total of 36 adult plainfin midshipman: 13 reproductive type I males with a size range of 11.2 – 26.0 cm standard length (SL) (mean SL = 16.1 ± 5.5 cm SD, mean body mass (BM) = 79.2 ± 109.2 g SD, mean body condition (Fulton’s K) = 1.2 ± 0.3 SD, and mean gonadosomatic index (GSI) = 2.2 ± 1.5 SD), 12 nonreproductive type I males with a size range of 10.4–30.5 cm SL (mean SL = 13.0 ± 6.2 cm SD, mean BM = 61.7 ± 80.3 g SD, mean K = 1.1 ± 0.2 SD, and mean GSI = 0.5 ± 1.7 SD ), and 11 reproductive females with a size range of 10.0 – 20.0 cm SL (mean SL = 14.3 ± 2.8 cm SD, mean BM = 36.8 ± 24.3 g SD, mean K = 1.1 ± SD, and mean GSI = 13.5 ± 8.6 SD). There was no difference in SL between nonreproductive and reproductive type I males (t-test, t(23) = 0.12, p = 0.91) or between reproductive type I males and reproductive females (t-test, t(22) = 0.97, p = 0.34). Reproductive and nonreproductive type I males did not differ in BM (t-test, t(23) = 0.45, p = 0.66) or K (t-test, t(23) = 1.11, p = 0.27). In addition, reproductive type I males and reproductive females did not differ in BM (t-test, t(22) = 1.26, p = 0.22) or K (t-test, t(22) = 0.49, p = 0.63). The GSI of type I males was larger in summer reproductive males than in winter nonreproductive males (t-test, t(22) = 2.07, p < 0.05). The timing of collection and the mean GSI of reproductive females sampled was comparable to those reported in previous studies (Coffin et al., 2012).
3.2. Differences in end organ hair cell densities between reproductive and nonreproductive type I males:
Bundle density was significantly greater in the saccules of reproductive type I males (mean HC density = 141.9 ± 28.9 SD/10,000 μm2) compared to nonreproductive type I males (mean HC density = 119.9 ± 34.9 SD/10,000 μm2) (two-way ANOVA, F(1, 158) = 37.5, p < 0.05), with four of the seven saccule regions having HC densities that were greater in reproductive type I males than in nonreproductive type I males (a priori t-tests, p < 0.05). These were regions 3 and 6 (marginal epithelia zones) and regions 2 and 4 (central epithelia zones) (Fig. 1). We also found that HC density differed depending on saccule region (two-way ANOVA, F(6, 158) = 24.3, p < 0.05). There were no differences in the HC densities between nonreproductive and reproductive type I males sampled in the utricle (two-way ANOVA, F(1, 41) = 0.01, p = 0.92) or in the lagena (two-way ANOVA, F(1, 38) = 1.1, p = 0.31). HC density differed depending on the region in the utricle (two-way ANOVA, F(2, 41) = 19.7, p < 0.05), but not in the lagena (two-way ANOVA, F (2, 38) = 3.2, p = 0.053) (Fig. 2).
3.3. Differences in saccular support cell densities between reproductive and nonreproductive type I males:
Reproductive type I males had fewer apical SCs (mean SC density = 92.4 ± 14.6 SD/2,500 μm2) compared to nonreproductive type I males (mean SC density = 103.8 ± 13.1 SD/2,500 μm2) (two-way ANOVA, F(1,26) = 4.8, p < 0.05). SC density did not differ in the central vs. marginal region (two-way ANOVA, F(1, 26) = 0.1, p = 0.78) (Fig. 3). In order to compare the ratio of SCs to HCs, we examined in a separate analysis HC densities in the same 50μm × 50μm square areas and again found greater HC density in reproductive type I males (mean HC density = 39.4 ± 7.4 SD/2,500 μm2) compared to nonreproductive type I males (mean HC density = 28.3 ± 12.4 SD/2,500 μm2) (two-way ANOVA, F(1,26) = 26.7, p < 0.05). Also, the analyzed marginal region (region 3, mean HC density = 38.5 ± SD/2,500 μm2) had greater HC density compared to the central region (region 2, mean HC density = 30.1 ± SD/2,500 μm2) (two-way ANOVA, F(1, 26) = 12.2; p < 0.05), which is contrary to findings for SCs. Lastly, we analyzed differences in total saccule apical cells (calculated by adding HCs + apical SCs in the same 50μm × 50μm square areas) to determine whether there were seasonal changes in the total number of cells (HC+SC) and indirectly determine whether there was a seasonal change in the ratio of HCs to SCs. There was no significant difference in total apical cell density when comparing reproductive vs. nonreproductive type I males (two-way ANOVA, F(1, 26) = 0.003, p = 0.96) and there was no difference in total apical cell density depending on region (two-way ANOVA, F(1, 26) = 2.2, p = 0.15). In sum, our results indicate that the ratio of saccular HCs to apical SCs increases during the breeding season, but total apical cell density does not change (Fig. 3).
Figure 3.
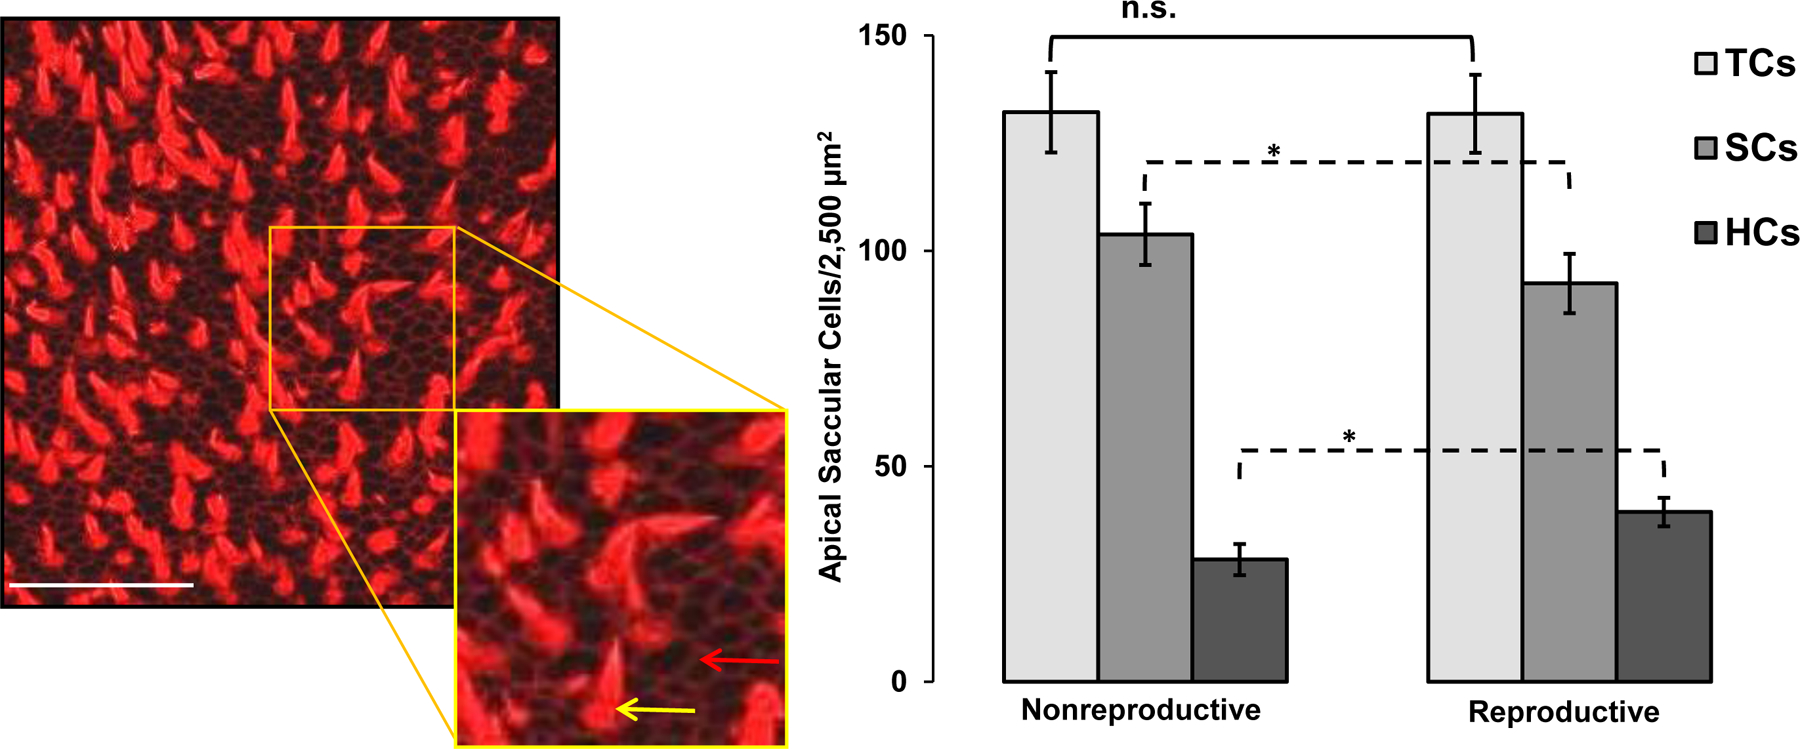
Saccular support cell (SC) density in nonreproductive and reproductive type I males. Left panel: SCs (red arrow, inset) were detectable in the same plane as HCs (yellow arrow) and were defined as cell outlines lacking stereocilia bundles. White scale bar = 50μm. Right panel: Data for the analyzed marginal region (region 3) and central region (region 2) were combined for the figure. There were differences in SC and HC density, but not for total cells (SC + HC) (cells/2,500μm2). On average, reproductive type I male midshipman had greater HC density and lower SC density compared to nonreproductive type I males. Data are plotted as means ±95% CI; n.s. = not statistically significant (p > 0.05); * = p < 0.05. TCs = total cells (SC + HC), SCs = support cells, HCs = hair cells.
3.4. Differences in saccular hair cell density between reproductive type I males and females:
Reproductive females had significantly greater saccular HC density (mean HC density = 159.6 bundles ± 24.6 SD/10,000μm2) compared to reproductive type I males (mean HC density = 141.9 bundles ± 28.9 SD/10,000μm2), F(1, 133) = 20.9, p < 0.05 (Fig. 4). After comparing each specific region across sex, we found that females had significantly greater HC density than type I males in regions 4 and 5, both central regions (a priori t-tests, p < 0.05) (Fig. 4). We again found that HC density differs by region, (two-way ANOVA, F(6,133) = 19.1, p < 0.05).
Figure 4.

Saccular hair cell (HC) density in reproductive type I males and females. Bundle density (HC/10,000 μm2) was greater in saccules of reproductive females compared to reproductive type I males. Data are plotted as means ±95% CI; * = p < 0.05.
3.5. Relationship between saccular hair cell density, reproductive condition, and size:
We ran separate multiple regression analyses with reproductive condition and SL as predictor variables to determine whether SL is a potential confound in the above comparisons. In the analysis for nonreproductive and reproductive type I males, reproductive condition significantly correlated with HC density (F(2,25) = 9.5, R2 = 0.4, p < 0.0; B = −186.6, p < 0.05) while SL did not (B = −4.9, p = 0.23). We found similar results in the multiple regression analysis between reproductive type I males and females (F(2, 23) = 6.4, R2 = 0.3, p < 0.05). Again, SL did not correlate with HC density (B = −6.7, p = 0.15), while reproductive condition did (B = 56.0, p < 0.05). Total HC density also did not correlate with size (SL) in any of the three reproductive conditions (i.e., reproductive type I males, reproductive females, and nonreproductive type I males) when analyzed in separate Pearson’s correlations (p > 0.05) (Fig. 5).
Lastly, we found that estimated total saccular HC quantity increased as a function of SL in adult type I males of both reproductive conditions and adult females. The largest type I male (SL = 30.5 cm) had an estimated approximately 91,835 HCs while the smallest type I male (SL = 10.4 cm) had an estimated approximately 20,091 HCs (Fig. 6).
4. Discussion
The primary aim of this study was to determine if type I male midshipman exhibit seasonal and reproductive-state dependent changes in HC density in the three putative auditory end organs (saccule, lagena, and utricle). We show that saccular HC density was greater in reproductive type I males than in nonreproductive type I males, and that the increase in saccular HC density was concurrent with a decrease in saccular SC density with no overall change in total saccular cell density (i.e., HC + SC). In contrast, we did not observe any seasonal changes in HC density in the utricle or lagena between nonreproductive and reproductive type I males, similar to previous results found in female midshipman (Coffin et al., 2012). In addition, we also show that saccular HC density was greater in reproductive females compared to reproductive type I males, which suggests a sexually dimorphic difference in HC density between the two sexual phenotypes. In this discussion, we interpret our results as they relate to possible adaptations for the enhanced reception of acoustic signals during midshipman social behavior.
Our results indicate that HC density in the saccule is 1.18 times greater in reproductive type I males than in nonreproductive type I males. The increase in HC density in reproductive type I males occurred in four out of the seven epithelial regions sampled from the saccules in nonreproductive and reproductive type I males. This seasonal increase in saccular HC density occurred throughout the sensory epithelia in both the central and marginal epithelial regions of the saccule. Consistent with these findings, Coffin et al. (2012) showed that reproductive females exhibited a 13% increase in saccular HC density that occurred in both the central and marginal regions of the saccular epithelia. In addition, the seasonal increase in HC density of reproductive females was concurrent with an increase in the recorded magnitude of evoked saccular potentials and a corresponding decrease in saccular thresholds (i.e., increase in sensitivity) recorded from the rostral, middle and caudal regions of saccule. This HC density increase in the central and marginal regions of the saccular epithelia is thought to, in part, contribute to the overall seasonal increase in female saccular sensitivity (Coffin et al., 2012). A similar correlation of increased HC density with enhanced saccular sensitivity likely exists in type I males as Rohmann and Bass (2011) showed that type I males also exhibit seasonal increases in HC sensitivity across the saccular epithelia during the reproductive season. Other teleost fishes including the cichlid oscar (Astronotus ocelatus), the goldfish (Carassius auratus), the European hake (Merluccius merluccius), the zebrafish (Danio rerio), and the closely related oyster toadfish (Opansus tau) and the Lusitanian toadfish (Halobatrachus didactylus) are known to add HCs throughout the entire epithelium during development and into the adult life history stage (Sokolowski and Popper, 1987; Popper and Hoxter, 1990; Lombarte and Popper, 1994; Lanford et al., 1996; Higgs et al., 2002; Chaves et al., 2017). This HC addition and change in saccular HC density during development is likely one of the main mechanisms that contributes to ontogenetic increases in auditory sensitivity (Corwin, 1983; Kenyon, 1996; Vasconcelos et al., 2015; Wang et al., 2015). Future studies that investigate midshipman inner ear development will be instrumental in understanding how HC addition and changes in HC density affect midshipman auditory sensitivity during ontogeny and across the adult reproductive cycle.
We found saccular–specific HC density increases in reproductive type I males similar to those reported for reproductive female midshipman (Coffin et al., 2012). The 13% increase in HC density in female midshipman occurred in 5 out of the 7 saccular epithelial regions sampled in reproductive females compared to nonreproductive females. In addition, Coffin et al. (2012) reported a negative relationship between saccular HC density and body size (SL) in both nonreproductive and reproductive females such that as SL increased HC density decreased. This negative relationship between body size and HC density has also been observed in other teleosts such as the oscar, the European hake and the Lusitanian toadfish (Popper and Hoxter, 1984; Lombarte and Popper, 1994; Chaves et al., 2017). Our results did not indicate a negative relationship between saccular HC density and SL in type I males or females, but such results were expected because we sampled individuals within a limited adult size range that were sexually mature. Because there were no differences in body size (SL) between nonreproductive and reproductive type I males (p = 0.91) nor between reproductive type I males and reproductive females (p = 0.34), we are confident that our reported results of saccular HC densities differences between nonreproductive and reproductive males and between reproductive males and females were attributed to seasonal and sexually dimorphic differences, respectively, rather than to ontogenetic differences in saccule HC density (i.e., related to age or body size).
One likely explanation for the reported negative relationship between HC density and body size reported in female midshipman and other teleosts is the likelihood that ontogenetic HC addition is probably slower relative to epithelial growth and expansion, which likely results in the reported decrease in HC density with body size (Popper and Hoxter, 1984; Lombarte and Popper, 1994; Lombarte and Popper, 2004; Chaves et al., 2017). In contrast, ontogenetic HC addition in zebrafish was reported to result in increased HC density with body size during ontogeny from 1.2 to 3.7 cm total length (Wang et al., 2015). Whether seasonal changes in HC density also occur in the saccule of type II male midshipman, a divergent male sexual phenotype that uses an alternative reproductive strategy to ‘sneak’ or satellite spawn, remains unknown. Future studies that investigate the relative HC densities of the auditory end organs in type II males across their reproductive cycle will be informative in determining whether seasonal HC density increases in the midshipman inner ear are a conserved trait and utilized by the three midshipman sexual phenotypes (females and type I and II males) during the reproductive season.
Although HC density is often negatively correlated with body size, the total number of HCs within the auditory end organs is known to increase with body size due to continual sensory epithelia growth and development (Popper and Hoxter, 1984; Lombarte and Popper, 1994; Chaves et al., 2017). In our study, the total estimated mean number of saccular HCs for type I males and females with a body size of 20–23.5 cm SL was 43,086 HCs, which was similar to the closely related Lusitanian toadfish with a comparable body size of 21–23 cm SL that had an estimated mean saccular number of 31,616 HCs (Chaves et al., 2017). Likewise, the estimated number of saccular HCs in the European hake of a similar total length range was less than 100,000 (Lombarte and Popper, 1994). In contrast, the estimated mean number of saccular HCs in the oscar with a body size of 19 cm SL was 252,385 HCs (Popper and Hoxter, 1984) and was approximately 6 times greater than that in the midshipman. While the area of the saccular macula in the oscar is generally larger than in the midshipman (e.g., a 19 cm SL oscar had saccular area of 6,370,145 um2 compared to a mean saccular area of 4,351,552 um2 in type I male and female midshipman of 20–23.5 cm SL), the 1.5 fold difference in the macular area of the saccule between the two species likely does not alone account for such differences in estimated HC numbers between the species. Taken together, these species-specific differences in HC addition in teleost end organs emphasize the need for future studies to examine how inner ear sensory morphology and development vary in teleost species with different ecologies and life history strategies.
The observed increase in saccular HC density in reproductive type I males was concurrent with a decrease in saccular SC density while total cell density (HC + SC) on the apical surface of the saccular epithelia did not differ from that in nonreproductive type I males. We observed an 11% decrease in SCs in reproductive compared to nonreproductive type I males which led to an increase in HC to SC ratio in reproductive type I males while total apical cell (HCs + SCs) density in the saccule did not change. The change in HC to SC ratio in reproductive type I males suggests that SCs may transdifferentiate into HCs in both the central and marginal regions of the saccule prior to the summer breeding season, perhaps during the spring pre-nesting season when midshipman gonads undergo seasonal recrudescence and development (Sisneros et al., 2004). Previous work in 6 month-1 year old oscars found that new HCs arise from an actively dividing population of neuroepithelial cells that migrate to the apical lumen prior to division and differentiation into HCs and SCs (Presson and Popper, 1990). Because we used the HC marker phalloidin, we were only able to quantify SCs on the apical surface of the saccular epithelium and not SCs located in the basal layers of the epithelium below the apical surface. However, HC precursors are known to migrate to the apical surface of the sensory epithelium prior to differentiating into HCs during mitotic cell division and during direct transdifferentiation of SCs into HCs in both fish and birds (Raphael, 1992; Oesterle and Stone, 2008; Brignull et al., 2009). Thus, quantifying SC cell density in the apical layer of the saccular epithelium can likely provide important information regarding the changes that occur in the saccular epithelium. In addition, SCs at the apical layer may be compressed and not properly detected with the resolution available using confocal microscopy. Future studies that examine HC proliferation and cell death using specific SC and HC markers for mitotic cell division and cell death at all epithelium layers in conjunction with scanning electron microscopy will provide valuable insight into the mechanisms responsible for the reproductive-state dependent changes in saccular HC density in type I male and female midshipman.
We found that reproductive type I males had a significantly lower saccular HC density than reproductive females during the summer breeding season. These differences in saccular HC density between type I males and females would suggest that there might be differences in saccular auditory sensitivity between type I males and females during the midshipman breeding summer. However, previous studies that examined the auditory evoked potentials of HCs in the saccule of females (Sisneros, 2009; Coffin et al., 2012) and type I males (Rohmann and Bass, 2011) revealed no such differences in auditory sensitivity at the level of the HCs between type I males and females. Auditory physiology studies that compare the sensitivity of the saccular afferents and higher order neurons in the auditory CNS of reproductive type I males and females have yet to be performed. The observed higher saccular HC density in females may lead to a higher convergence ratio of saccular HCs to saccular afferents which could effectively increase auditory sensitivity at the level of the auditory afferents as previously shown by Corwin (1983) in the thornback ray (Raja clavata) where the HC to ganglion cell convergence ratio was shown to increase during ontogeny resulting in increased sensitivity of the auditory afferents. Future studies that examine and compare the afferent connectivity of the saccular HCs in reproductive type I males and females would provide needed insight into whether there are sexually dimorphic differences in midshipman HC afferent connectivity and auditory sensitivity during the breeding season.
The reproductive-state dependent increase in saccular HC density in type I males likely enhances auditory sensitivity during the breeding season and such an increase in auditory sensitivity could potentially be beneficial for the detection of social acoustic signals. Type I males are known to produce three types of social acoustic signals that include grunts, growls, and advertisement calls (Bass et al., 1999). Much of the life history and social behavior of male and female midshipman rely on the production and detection of social acoustic signals, especially during the summer breeding season. Thus, reproductive state-dependent changes in HC density in reproductive type I males and females may, in part, contribute to the enhanced detection of midshipman acoustic signals. Based on saccule potential recordings, Rohmann and Bass (2011) showed that reproductive type I males are more sensitive than nonreproductive males to frequencies from 145–385 Hz, which is in the range of frequencies that contain the dominant acoustic energy associated within each of the three known midshipman vocalizations (i.e, grunts, growls, and hums) (Rohmann and Bass, 2011). Thus, this reproductive-state dependent change in auditory sensitivity may enable reproductive type I males to better detect and assess other territorial males in order to avoid or invite physical interactions while choosing nest locations in the intertidal nesting environment. Whether reproductive-dependent changes in saccular HC density also occur in type II males, which likely rely on eavesdropping for the selection of cuckoldry sites for satellite or sneaking spawning, remains to be determined.
Reproductive type I male plainfin midshipman (Porichthys notatus) have increased saccular hair cell density compared to nonreproductive type I males.
Hair cell density does not differ in the other two putative midshipman inner ear auditory end organs, the utricle and lagena, between reproductive and nonreproductive type I males.
Reproductive type I males have decreased support cell density at the apical surface of the saccular epithelium concurrent with increased hair cell density while total cell (hair cell + support cell) density does not change between reproductive and non-reproductive type I males.
Reproductive female plainfin midshipman have increased saccular hair cell density compared to reproductive type I males.
Acknowledgements:
We would like thank Paul Forlano, Jonathan Perelmuter, Brooke Vetter, Ruiyu Zeng, and William Palmer for help with animal collections and the UC Davis Bodega Marine Lab for logistical support. This work was supported by a National Institutes of Health auditory neuroscience training grant (T32DC005361) to NRL and by a National Science Foundation grant (IOS 1456700) to JAS.
Footnotes
Publisher's Disclaimer: This is a PDF file of an unedited manuscript that has been accepted for publication. As a service to our customers we are providing this early version of the manuscript. The manuscript will undergo copyediting, typesetting, and review of the resulting proof before it is published in its final form. Please note that during the production process errors may be discovered which could affect the content, and all legal disclaimers that apply to the journal pertain.
References
- Bass AH, Bodnar D and Marchaterre MA, 1999. Complementary explanations for existing phenotypes in an acoustic communication system. In: Hauser MD, Konishi M (Eds.), The design of animal communication, MIT Press, Cambridge, MA, pp. 493–514. [Google Scholar]
- Brignull HR, Raible DW, Stone JS, 2009. Feathers and fins: Non-mammalian models for hair cell regeneration. Brain Res 1277, 12–23. 10.1016/j.brainres.2009.02.028 [DOI] [PMC free article] [PubMed] [Google Scholar]
- Chaves PP, Valdoria CMC, Amorim MCP, Vasconcelos RO, 2017. Ontogenetic development of the inner ear saccule and utricle in the Lusitanian toadfish: Potential implications for auditory sensitivity. Hear. Res 353, 112–121. 10.1016/j.heares.2017.06.008 [DOI] [PubMed] [Google Scholar]
- Coffin AB, Mohr RA, Sisneros JA, 2012. Saccular-specific hair cell addition correlates with reproductive state-dependent changes in the auditory saccular sensitivity of a vocal fish. J. Neurosci 32, 1366–76. 10.1523/JNEUROSCI.4928-11.2012 [DOI] [PMC free article] [PubMed] [Google Scholar]
- Corwin JT, 1981. Postembryonic production and aging of inner ear hair cells in sharks. J. Comp. Neurol 201, 541–553. 10.1002/cne.902010406 [DOI] [PubMed] [Google Scholar]
- Corwin JT, 1983. Postembryonic growth of the macula neglecta auditory detector in the ray, Raja clavata: Continual increases in hair cell number, neural convergence, and physiological sensitivity. J. Comp. Neurol 217, 345–356. 10.1002/cne.902170309 [DOI] [PubMed] [Google Scholar]
- Higgs DM, Souza MJ, Wilkins HR, Presson JC, & Popper AN (2002). Age- and size-related changes in the inner ear and hearing ability of the adult zebrafish (Danio rerio). JARO 10.1007/s101620020035 [DOI] [PMC free article] [PubMed]
- Kenyon TN, 1996. Ontogenetic changes in the auditory sensitivity of damselfishes (pomacentridae). J. Comp. Physiol. A. Sensory, Neural, Behav. Physiol 179, 553–561. 10.1007/BF00192321 [DOI] [Google Scholar]
- Lanford PJ, Presson JC, Popper AN, 1996. Cell proliferation and hair cell addition in the ear of the goldfish, Carassius auratus. Hear. Res 100, 1–9. 10.1016/0378-5955(96)00110-4 [DOI] [PubMed] [Google Scholar]
- Lombarte A, Popper AN, 2004. Quantitative changes in the otolithic organs of the inner ear during the settlement period in European hake Merluccius merluccius. Mar. Ecol. Prog. Ser 267, 233–240. 10.3354/meps267233 [DOI] [Google Scholar]
- Lombarte A, Popper AN, 1994. Quantitative analyses of postembryonic hair cell addition in the otolithic endorgans of the inner ear of the European hake, Merluccius merluccius (Gadiformes, Teleostei). J. Comp. Neurol 345, 419–428. 10.1002/cne.903450308 [DOI] [PubMed] [Google Scholar]
- Lombarte A, Yan HY, Popper AN, Chang JS, Platt C, 1993. Damage and regeneration of hair cell ciliary bundles in a fish ear following treatment with gentamicin. Hear. Res 64, 166–174. 10.1016/0378-5955(93)90002-I [DOI] [PubMed] [Google Scholar]
- Millimaki BB, Sweet EM, Riley BB, 2010. Sox2 is required for maintenance and regeneration, but not initial development, of hair cells in the zebrafish inner ear. Dev. Biol 338, 262–269. 10.1016/j.ydbio.2009.12.011 [DOI] [PMC free article] [PubMed] [Google Scholar]
- Oesterle EC, Stone JS, 2008. Hair cell regeneration: Mechanisms guiding cellular proliferation and differentiation, In: Salvi RJ, Popper AN, Fay RR (Eds.), Hair Cell Regeneration, Repair, and Protection Springer, New York, pp. 141–197. [Google Scholar]
- Popper AN, Hoxter B, 1984. Growth of a fish ear: 1. Quantitative analysis of hair cell and ganglion cell proliferation. Hear. Res 15, 133–142. 10.1016/0378-5955(84)90044-3 [DOI] [PubMed] [Google Scholar]
- Popper AN, Hoxter B, 1990. Growth of a fish ear II. Locations of newly proliferated sensory hair cells in the saccular epithelium of Astronotus ocellatus. Hear. Res 45, 33–40. 10.1016/0378-5955(90)90180-W [DOI] [PubMed] [Google Scholar]
- Presson JC, & Popper AN (1990). Possible precursors to new hair cells, support cells, and Schwann cells in the ear of a post-embryonic fish. Hear. Res 10.1016/0378-5955(90)90135-C [DOI] [PubMed]
- Raphael Y, 1992. Evidence for supporting cell mitosis in response to acoustic trauma in the avian inner ear. J. Neurocytol 21, 663–671. 10.1007/BF01191727 [DOI] [PubMed] [Google Scholar]
- Rohmann KN, Bass AH, 2011. Seasonal plasticity of auditory hair cell frequency sensitivity correlates with plasma steroid levels in vocal fish. J. Exp. Biol 214, 1931–1942. 10.1242/jeb.054114 [DOI] [PMC free article] [PubMed] [Google Scholar]
- Sisneros JA, 2009. Seasonal plasticity of auditory saccular sensitivity in the vocal plainfin midshipman fish, Porichthys notatus. J. Neurophysiol 102, 1121–1131. 10.1152/jn.00236.2009 [DOI] [PubMed] [Google Scholar]
- Sisneros JA, Forlano PM, Knapp R, Bass AH, 2004. Seasonal variation of steroid hormone levels in an intertidal-nesting fish, the vocal plainfin midshipman. Gen. Comp. Endocrinol 136, 101–116. 10.1016/j.ygcen.2003.12.007 [DOI] [PubMed] [Google Scholar]
- Smith ME and Monroe JD, 2016. Causes and consequences of sensory hair cell damage and recovery in fishes. In Sisneros JA (Ed.), Fish Hearing and Bioacoustics Springer, New York, pp. 393–417. [DOI] [PubMed] [Google Scholar]
- Sokolowski BHA, Popper AN, 1987. Gross and ultrastructural development of the saccule of the toadfish Opsanus tau. J. Morphol 194, 323–348. 10.1002/jmor.1051940311 [DOI] [PubMed] [Google Scholar]
- Vasconcelos RO, Alderks PW, Ramos A, Fonseca PJ, Amorim MCP, Sisneros JA, 2015. Vocal differentiation parallels development of auditory saccular sensitivity in a highly soniferous fish. J. Exp. Biol 218, 2864–2872. 10.1242/jeb.123059 [DOI] [PubMed] [Google Scholar]
- Wang J, Song Q, Yu D, Yang G, Xia L, Su K, Shi H, Wang, Jian, Yin, S., 2015. Ontogenetic development of the auditory sensory organ in zebrafish (Danio rerio): Changes in hearing sensitivity and related morphology. Sci. Rep 5, 1–15. 10.1038/srep15943 [DOI] [PMC free article] [PubMed] [Google Scholar]
- Warchol ME, 2011. Sensory regeneration in the vertebrate inner ear: Differences at the levels of cells and species. Hear. Res 273, 72–79. 10.1016/j.heares.2010.05.004 [DOI] [PubMed] [Google Scholar]