

Abstract
Research on the interactions of naturally existing flavonoids with various noncanonical DNA such as i-motif (IM) DNA structures is helpful in comprehending the molecular basis of binding mode as well as providing future direction for the application and invention of novel effective therapeutic drugs. IM DNA structures have been identified as prospective anticancer therapeutic targets, and flavonoids are smaller molecules with a variety of health-promoting attributes, including anticancer activities. The extensive investigation comprising a series of techniques reveals the contrasting mode of the binding behavior of fisetin and morin with various IM DNA structures. We have discovered that structural alterations of hydroxyl groups located at different places of aromatic rings influence flavonoid’s reactivity. This minor structural alteration appears to be critical for fisetin and morin’s capacity to interact differentially with HRAS1 and HRAS2 IM DNA. Hence, fisetin appears to be an efficient ligand for HRAS1 and morin is considered to be an efficient ligand for HRAS2 IM DNA. This novel exploration opens up the possibility of employing the strategy for regulation of gene expression in cancerous cells. Our finding also reveals the flavonoid-mediated specific interaction with IM DNA while pointing toward tangible strategies for drug discovery and other essential cellular functions.
Introduction
Current genomic investigations have revealed that noncoding portions including introns, regulatory elements, repetitive sequences, and telomeres contribute around 98% of biological DNA.1 Numerous forms of noncoding DNA sequences have essential biological activities, such as replication and regulation of protein-coding regions through transcription and translation.2 Additionally, noncoding sequences such as IM DNA are likely to have roles that have not yet been established.3 Unfortunately, our understanding of IM DNA biology remains restricted, owing in part to a paucity of adequate small-molecule probes to investigate the biological significance of these structures. Several G-quadruplex DNA (G4) ligands have been explored in studies to better understand the functions of these structures.4 In contrast, just a few molecules/ligands have been shown to interact with IM DNA. In acidic conditions, hemi-protonated cytosine–cytosine base pairs (C–C+) can generate a tetraplex structure known as the IM in cytosine-enriched DNA sequences. This structure contains two broad and two narrow grooves, as well as its C–C+ plane is shorter than that of G4′s G-quartet.5 Even so, there are evidences for the generation of IMs at neutral pHs under supercoiling situations, molecular crowding circumstances, and in the presence of interacting molecules and cations.6−9 Furthermore, the growing number of IM interacting molecules has offered new opportunities for investigation into its biological roles and detection in human cell nuclei.
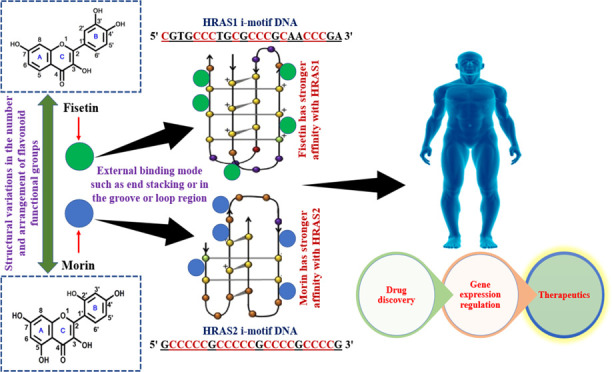
To date, small molecules such as mitoxantrone,10 berberine,11 TMPyP4,12 and IMC-4813 have been reported as potential i-motif ligands. Flavonoids are polyphenolic natural compounds that are present in a variety of fruits, grains, nuts, wine, tea, vegetables, and other foods.14,15 They are known to have a variety of health-beneficial properties with high potency and minimal systemic toxicity.3 Flavonoid molecules have a basic diphenyl propane skeleton (also known as C6–C3–C6), which consists of two benzene rings (A- and B-rings) joined by a heterocyclic pyran or pyrone ring (C-ring) in the center (Figure 1a). Fisetin (3,3′,4′,7-tetrahydroxyflavone), a bioactive plant flavonol has received attention for its multimodal therapeutic activity in cell culture and animal models associated with human illnesses.16−18 Fisetin possesses a unique spectroscopic property of extraordinarily sensitive inherent ‘two color’ fluorescence, which occurs as a result of a photoinduced excited-state intramolecular proton transfer (ESIPT) process.3 On the other hand, morin (3,5,7,2′,4′-pentahydroxyflavone), a biflavonoid has showed pharmacological activities by altering numerous cellular signaling pathways. A plethora of evidences indicate morin’s therapeutic benefits on a variety of chronic and life-threatening degenerative disorders.19−22 In this study, we logically chose two flavonoids, fisetin and morin, to conduct detailed exploration into different IM DNA architectures. The choice was made because fisetin and morin have remarkably comparable structures, varying only by a hydroxyl group (−OH) in the A-ring and the configuration of the B-ring. Fisetin’s B-ring has 3′-OH and 4′-OH groups, while morin’s B-ring contains 2′-OH and 4′-OH groups. The A-ring of fisetin has a 7′-OH group; in contrast, the A-ring of morin comprises both 5′-OH and 7′-OH groups (Figure 1b,c). According to several recent studies, the arrangement and number of −OH groups on the B-ring of flavonoids are critical for their DNA, RNA, and protein binding characteristics.23−26
Figure 1.

Schematic representation of basic structures of flavonoid (a), fisetin (3,3′,4′,7-tetrahydroxyflavone) (b), and morin (3,5,7,2′,4′-pentahydroxyflavone) (c).
Here, we have investigated the binding interactions of fisetin and morin with different i-motif DNA structures (HRAS1, HRAS2, VEGF, c-MYC, BCL2, c-KIT1, c-KIT2, and h-TELO). To study these interactions, we have utilized different spectroscopic measurements along with isothermal titration calorimetry (ITC). From these studies, we have demonstrated that fisetin shows preferential interaction with HRAS1 IM DNA compared to the other IM DNA structures, while morin exhibits a much stronger extent of interaction with HRAS2 IM DNA than all tested forms of IM DNA structures. The distinction in a binding manner with HRAS1 and HRAS2 IM DNA structures are due to the structural variation between fisetin and morin in terms of the absence/presence and arrangement of hydroxyl groups.
Experimental Methods
Materials and Preparation of Stock Samples
Different IM forming DNA sequences (HRAS1, HRAS2, VEGF, c-MYC, h-TELO, BCL2, c-KIT1, and c-KIT2) and the flavonoids (fisetin and morin) were acquired from Sigma-Aldrich and utilized in their original form. The solvents employed generally of spectroscopic quality. The buffer solution that was used to create the IM structure here comprises 50 mM KCl, 10 mM KH2PO4, and 1 mM K2EDTA (IM buffer, pH 5.4). The desalted DNA sequences were kept at 4 °C after being dissolved in double distilled water. IM DNA structures were created by adding the appropriate quantity of DNA from the primary stock to the solution of buffer and annealing the resultant mixtures at 95 °C for 5 min. After progressively cooling to room temperature (25 °C), the resulting solutions were allowed to settle overnight at 4 °C. Because of their limited solubility in aqueous media, fisetin and morin stock solutions were produced in methanol, and the ultimate experimental concentrations of the flavonoids (fisetin and morin) were maintained in the micromolar level, (10–6 M) in <1% (v/v) methanol.
Ultraviolet–Visible Absorption Measurements
To explore the binding between the ligands and different IM DNAs, UV–vis absorption spectrum of the ligands in the absence and presence of IM DNAs were measured using a Hitachi-UH5300 spectrophotometer and cuvettes made of quartz with a path length of 1 cm. In UV–vis absorption titration experiments, we kept ligands (fisetin and morin) concentration constant at 15 μM, and different IM DNAs were added with gradually increasing concentrations (0–30 μM). All of these UV–vis absorption measurements were performed in IM buffer (pH 5.4, 25°C). The spectra were taken at a rate of 400 nm min–1 with a data interval of 1 nm.
Steady-State Spectrofluorometric Studies
The fluorescence emission spectra of flavonoids (fisetin and morin) were recorded with a Biobase BK F-96 pro fluorescence spectrometer using a quartz cuvette of 1 cm path length. Experiments were carried out by keeping the concentration of flavonoids constant at 10 μM and were subsequently titrated with increasing concentrations (0–30 μM) of different IM DNA structures. All of these spectrofluorometric measurements were performed in IM buffer (pH 5.4, 25°C). Emission spectral patterns of fisetin and morin at different pH conditions (pH 4, 5, 6, 7, and 8) in IM buffer solutions were also monitored. The spectral bandwidths for excitation and emission were tuned at 5 and 10 nm, respectively. The excitation wavelength (365 nm) was held constant for emission spectral assessments, whereas the emission wavelength differed across the regions of relevance. With a scanning rate of 200 nm min–1 and a reaction time of 0.5 s, emission spectra were obtained.
Steady-State Fluorescence Anisotropy Measurements
A Fluorolog spectrometer (Horiba scientific) equipped with polarizers was used to assess steady-state fluorescence anisotropy. The sample-containing solutions were collected in suprasil quartz cells with a 1 cm path length. Fisetin and morin emission spectra were acquired in the 370–650 nm range at an excitation wavelength of 365 nm while maintaining excitation and emission spectral band passes at 5 nm in wavelength. All of these spectrofluorometric measurements were performed in IM buffer (pH 5.4, 25°C).
Steady-state fluorescence anisotropy (r) values were calculated using the expression
| 1 |
G is the detecting system’s sensitivity factor. IVV, IVH, IHV, and IHH are signals from fluorescence for excitation and emission, respectively, with the polarizer set at (0,0°), (0,90°), (90,0°), and (90,90°).
Time-Resolved Fluorescence Decay Measurements
Fluorescence lifetime metrics were taken using the time-correlated single photon counting (TCSPC) strategy on a Fluorolog spectrometer (Horiba scientific, DD-375L). A laser diode was used as an excitation source to induce fisetin and morin at 373 nm. The full width at half-maximum of the IRF was 108 ps. To increase the signal-to-noise ratio, 5000 photon counts were gathered in the peak channel. The experiments were done out using emission slits with a spectral band pass of 4 nm. An emission monochromator was used to reduce scattered light and separate the emission. The emission decay data at 550 nm (fisetin) and 520 nm (morin) were evaluated using the TCSPC’s DAS-6 (Decay Analysis software 6) program and fitting with a multiexponential decay equation
| 2 |
where F(t) is the intensity of fluorescence at time t and αi and τi are the pre-exponential component and decay period, respectively, relating to the ith decay. The goodness of the fits was calculated by ϰ2 criteria and visual assessment of the residuals of the fitted function to the data. The mean (average) fluorescence lifetimes (τavg) were computed utilizing the equation
| 3 |
Circular Dichroism (CD) Spectroscopic Studies
At ambient temperature, the circular dichroism (CD) spectrum was collected on a Jasco (J-1500) spectropolarimeter (Jasco International Co., Ltd.) using a cuvette with a 1 millimeter path length. Each spectrum was the average of 3 scans, with a scan spectrum ranging from 200 to 350 nm and a scan rate of 100 nm min–1. The IM DNA concentration was kept consistent (10 μM), while concentrations (10, 20 μM) of fisetin and morin were varied. All of the experiments were performed in IM buffer (pH 5.4, 25°C). The corresponding buffer blanks were used to correct background. The curve fitting program Origin Pro 8 was used to assess the CD curves.
UV Melting Analysis
Thermal denaturation studies were carried out with a Hitachi-UH5300 spectrophotometer outfitted with a Julabo F12 water circulator and a 3J1–0104 water-pumped cell holder device utilizing a quartz cuvette with a 1 centimeter path length. Thermal denaturation studies were performed on samples heated from 30 to 98 °C at a rate of 1 °C min–1. The absorption value of 10 μM IM DNA at 260 nm was measured consistently at a rate of 0.5 °C/min from 30 to 98 °C. All of the experiments were performed in IM buffer (pH 5.4, 25°C). The UV melting curves were adjusted for normalization and evaluated with the Origin Pro 8 program.
Isothermal Titration Calorimetric (ITC) Studies
We used an isothermal calorimeter and a Microcal ITC200 microcalorimeter (Northampton, MA) for demonstrating the binding activity of the flavonoid–IM DNA. Before titration, every sample and buffer have been degassed to verify that no bubbles were developed. A fixed volume of fisetin (200 μM) and morin (200 μM) were injected into pre-annealed DNA (100 μM). Titration involved injecting 2 μL of flavonoids into the DNA solution, with an aggregate of 19 injections required to produce the entire binding curve. The temperature was kept fixed at 25 °C for the measurements. The power output was incorporated after every injection, and the molar binding enthalpies were computed. These readings were then normalized by the number of flavonoids administered and compensated for heats of dilution. The temperatures of dilution were evaluated by titrating the ligand into the buffer under otherwise equivalent conditions of experimentation. The isotherms were analyzed using in-built software Origin (Microcal ITC200, Northampton, MA). To assess the heat of dilution, control experiments were performed. The binding isotherms obtained in the titrations were analyzed with model equations. The data points obtained best fitted the “one set of sites” models. The standard molar entropy (ΔS) and the standard molar Gibbs energy (ΔG) were calculated using standard thermodynamic relationship ΔG = −RT ln K, where R (1.9872041 Cal K–1 mol–1) is the gas constant and T is the temperature in kelvins.
After fitting the isotherms, equilibrium constants (Ka), enthalpy changes (ΔH), and entropy changes (ΔS) associated with flavonoid–IM DNA complexation were determined. The ΔG (Gibbs free energy) was calculated utilizing the relationship
| 4 |
Results and Discussion
Ultraviolet–Visible Absorption Measurements
For initial assessment of the binding interactions, the ultraviolet–visible absorption spectra of the flavonoids (fisetin and morin) were analyzed in the absence and presence of distinct IM DNA constructs. In generally, the absorption profiles of the flavonoid indicated two absorption bands (band I and band II). Band I correspond to the light absorbance of the cinnamoyl moiety (B+C ring), whereas band II corresponds to the absorbing capacity of the benzoyl moiety (A+C ring). The typical UV absorption spectrum of fisetin and morin in the aqueous buffer solution (pH 5.4) exhibits absorption maxima (max) at 356 and 382 nm, respectively. The lowered absorption, accompanied by a red shift in the absorbance maxima, suggested a probable polarity transfer surrounding the flavonoid compounds as a result of their binding association with IM DNA structures.
The absorption spectra of fisetin showed reduced absorbance (24.39% hypochromism) and a 22 nm red shift of the absorbance maxima in the presence of increasing concentration of HRAS1 IM (Figure 2a). The lowered absorption, in addition to the red shift in the absorbance maxima, suggested a probable polarity switching around the fisetin compounds as a result of the binding interaction with HRAS1 IM. For the HRAS2, VEGF IM, BCL2 IM, c-MYC IM, h-TELO IM, c-KIT1 IM, and c-KIT2 IM structures, the degree of hypochromism was lower in comparison to the HRAS1 IM DNA structure, with no detectable shifting of the spectrum of fisetin (Figures 2b and Figure S1 and Table 1). In the case of morin, increasing concentration of HRAS2 IM DNA results in a considerable reduction in absorption (21.23%) along with a 10 nm red shift of the absorbance maximum (Figure 2c). This reveals that morin perceives a hydrophobic milieu within the HRAS2 IM DNA matrix, in which it is protected from the polar aqueous surroundings. The hypochromism and bathochromism differ enormously based on the IM DNA configurations, and for the HRAS1, VEGF IM, BCL2 IM, c-MYC IM, h-TELO IM, c-KIT1 IM, and c-KIT2 IM structures, the extent of hypochromism was less compared to the HRAS2 IM DNA structure, with no observable spectral shift of morin (Figures 2d and S2 and Table 1). Probably, the observed bathochromic effects occurred by the interaction of the vacant π antibonding orbital (π*) of fisetin and morin with the π bonding orbital of the HRAS1 and HRAS2 DNA bases and established a π–π* conjugation, resulting in the lowering in the π–π* transition vitality and a red shift in the absorption profile. However, the empty π*-orbital of flavonoids are partially filled with electrons, lowering the transition probability and inducing hypochromism, since the lower the probability, the lesser the molar absorbance ratio.27
Figure 2.

Upper panel: absorption spectra of fisetin (15 μM) in the absence and presence of successive additions of HRAS1 (a) and HRAS2 (b) IM DNA (30 μM). Lower panel: absorption spectra of morin (15 μM) in the absence and presence of successive additions of HRAS2 (c) and HRAS1 (d) IM DNA (30 μM).
Table 1. Different Flavonoids and i-Motif Forming Sequences Used in This Studya.
| flavonoids | molecular formula | nature |
|---|---|---|
| fisetin | C15H10O6 | 3,3′,4′,7-tetrahydroxyflavone |
| morin | C15H10O7 | 3,5,7,2′,4′-pentahydroxyflavone |
| oligo name (i-motif) | length (bases) | sequence (5′–3′) |
|---|---|---|
| HRAS1 | 23 | d(CGTGCCCTGCGCCCGCAACCCGA) |
| HRAS2 | 23 | d(GCCCCCGCCCCCGCCCCGCCCCG) |
| VEGF | 24 | d(GACCCCGCCCCCGGCCCGCCCCGG) |
| BCL2 | 39 | d(CAGCCCCGCTCCCGCCCCCTTCCTCCCGCGCCCGCCCCT) |
| c-MYC | 28 | d(TCCCCACCTTCCCCACCCTCCCCACCCT) |
| h-TELO | 22 | d(CCCTAACCCTAACCCTAACCCT) |
| c-KIT1 | 22 | d(CCCTCCCTCCCAGCGCCCTCCC) |
| c-KIT2 | 20 | d(CCCCTCCCTCGCGCCCGCGC) |
| absorption studies |
fluorescence studies |
|||
|---|---|---|---|---|
| (flavonoid–DNA interaction) | hypochromicity (%) | red shift (nm) | fluorescence enhancement (fold) | red shift (nm) |
| Fisetin–HRAS1 | 24.3 | 22 | 5.3 | 40 |
| Fisetin–HRAS2 | 12 | 12 | 1.7 | 20 |
| Fisetin–VEGF | 4.1 | 11 | 2.6 | 25 |
| Fisetin–BCL2 | 4.3 | 8 | 2.3 | 20 |
| Fisetin–c-MYC | 6 | 10 | 1.4 | 20 |
| Fisetin–h-TELO | 3 | 11 | 1.3 | 10 |
| Fisetin–c-KIT1 | 6 | 10 | 1.4 | 15 |
| Fisetin–c-KIT2 | 4.3 | 9 | 1.2 | 10 |
| Morin–HRAS1 | 13.7 | 4 | 1.0 | 1 |
| Morin–HRAS2 | 21.2 | 10 | 1.4 | 4 |
| Morin–VEGF | 6.8 | 3 | no enhancement | no shift |
| Morin–BCL2 | 3.4 | 2 | no enhancement | no shift |
| Morin–c-MYC | 3.4 | 2 | no enhancement | no shift |
| Morin-h-TELO | 6.8 | 4 | no enhancement | no shift |
| Morin–c-KIT1 | 3.4 | 2 | no enhancement | no shift |
| Morin–c-KIT2 | 3.4 | 3 | no enhancement | no shift |
For screening spectral parameters of interactions between fisetin and morin with different IM DNA structures obtained from absorption and steady-state fluorescence studies.
These findings clearly indicated the potential for association of fisetin with HRAS1 IM and morin with HRAS2 IM when compared to other IM DNAs. In this respect, it is important to highlight that intercalative or stacking binding of small molecules to DNA is characterized by considerable alterations in absorption profiles (hypochromism Δλ ≥ 35%) and a significant shifting in the absorption spectra, whereas external binders exhibit lesser red shifts (Δλ ≥ 8 nm). Based on the amplitude of the spectrum alterations in the absorption profile, we assume that both flavonoids (fisetin and morin) interact with the IM DNA structures through an external binding manner like in the groove or loop region or end stacking. In our study, we also found that HRAS1 and HRAS2 IM DNA-induced absorption spectrum shifts of fisetin and morin have an isosbestic point (Figure 2a,c), implying that the 1:1 binding stoichiometry is also sustained.28,29
Steady-State Spectrofluorometric Studies
The fluorescence properties of fisetin and morin while bound to different IM DNA structures were studied. The binding environment has a significant impact on the ESIPT (excited-state intramolecular proton transfer) process and related photophysical variables of fluorescence. In the ESIPT process, the hydrogen bonding connection occurs in a variety of organic compounds that include both hydrogen donor and hydrogen acceptor groups. The hydrogen bonding connections could be quickly altered by the photoinduced procedures, and the primary characteristics of the compounds could be altered concurrently. The intermolecular hydrogen bonds between solvent and solute substances can be significantly enhanced in excited states (Figure 3). Because of the overlapping of normal and tautomer emission bands, the fluorescence emission spectrum of fisetin in aqueous environments revealed a wide emission band. The inclusion of HRAS1 IM resulted in considerable changes in fisetin emission characteristics. There was notable dual fluorescence when HRAS1 IM had been added, with the formation of a strong yellow-green tautomer fluorescence band with highest intensity at approximately 540–545 nm and a blue-violet normal emission spectrum with a maximal at around 490–500 nm. The S1 (first excited state) to S0 normal (N*, non-proton-transferred) emission was delegated to the blue-violet fluorescence band, and the broad Stokes-shifted yellow-green fluorescence spectrum was assigned to tautomer species emissions. (T*) was generated by an ESIPT procedure from the C(3)–OH to the C(4)=O of the fisetin molecules (Figure 3). The detected enhanced tautomer emission showed that in the presence of HRAS1 IM, the fisetin molecules have been subjected to extremely hydrophobic surroundings and promotes the ESIPT process by minimizing external H-bonding interference to ESIPT (Figure 3).
Figure 3.

Photoinduced excited-state intramolecular proton transfer (ESIPT) in fisetin and morin. Ground and excited (indicated by*) states of normal (N) and tautomer (T) forms of fisetin and morin. Excited first-singlet normal states and tautomer forms are denoted as N* and T*, respectively.
The ratio of tautomer (IT; 545 nm) to normal (IN; 450 nm) emission band intensities (IT/IN) is a useful measure for monitoring the rise in comparative production of the ESIPT tautomer species as well as an indicator of the hydrophobicity of fisetin’s milieu. The value of IT/IN grows significantly with a higher concentration of HRAS1 IM DNA, but other IM DNA only shows a minor increase. Furthermore, we discovered that fisetin has a stronger affinity for HRAS1 IM DNA, leading in a 5.35-fold increase in tautomer intensity of fluorescence and a significant red-shifting (40 nm) for the tautomer absorption maxima (Figure 4a). This fluorescence enhancement is substantially greater compared to HRAS2, VEGF IM, BCL2 IM, c-MYC IM, h-TELO IM, c-KIT1 IM, and c-KIT2 IM DNA structures (Figures 4b and S3 and Table 1).
Figure 4.

Fluorescence emission spectra of 10 μM fisetin (λex = 365 nm) in the presence of increasing concentrations of HRAS1 (a) and HRAS2 (b) IM (30 μM).
In the case of the low-fluorescence molecule morin, we revealed that in the presence of HRAS2 IM, there is a slight increase in the fluorescence emission of morin (1.44-fold intensity enhancement with 3.96 nm red-shifting), demonstrating the preferential affinity for HRAS2 IM DNA (Figure S4a). We did not find any fluorescence enhancement and shifting in HRAS1, VEGF IM, BCL2 IM, c-MYC IM, h-TELO IM, c-KIT1 IM, and c-KIT2 IM DNA structures (Figures S4b and S5 and Table 1). Flavonoids with a C(3)–OH group next to the C(4)=O group are known to efficiently undergo photoinduced ESIPT, resulting in significant Stokes-shifted, good fluorescence yield tautomer emission in a nonpolar surrounding. Both of the 5-OH and 3-OH moieties are found in morin, and they are near to the C(4)=O group. The C(4)=O···HO–C(5) hydrogen link interferes with the C(4)=O···HO–C(3) hydrogen bond, leading to reduced tautomer emission of fluorescence in the free forms of morin. Morin binding to HRAS2 IM DNA breaks its internal bonds of hydrogen engaging the 5-OH group. Once the attached morin is photoexcited, the ESIPT mechanism through the C(4)=O···HO–C(3) hydrogen bond is accelerated, which leads to the stimulation of strong fluorescence from the inherently weakly fluorescent morin (Figure 3). This result suggests that morin molecules are largely positioned in a less polar and less protic milieu inside the HRAS2 IM DNA matrix, making nonradiative deactivation mechanisms less effective and favoring morin’s ESIPT activity, resulting in slightly higher emission. The binding environment has a significant impact on the ESIPT process and the photophysical characteristics of fluorescence. Because of the hydrogen bonding behavior, the fluorescence of the experimental flavonoids (fisetin and morin) is also affected by the nature and pH of the solvents. Fisetin and morin’s emission spectra displayed different spectral patterns in the buffer solution of several pH parameters (pH 4, 5, 6, 7, and 8) (Figure S6). It has been assumed that these two molecules may undergo tautomeric formations (T*) in pH 5.4 which can be one of the driving forces for preferential interactions between fisetin–HRAS1 and morin–HRAS2.
From the above UV absorption and steady-state fluorescence studies, we have found that fisetin preferentially interacts with HRAS1 and morin preferentially interacts with HRAS2 among all other tested IM DNA structures. The following experiments are performed according to the notion of our study.
Steady-State Fluorescence Anisotropy Measurements
Steady-state anisotropy measurements give a sensitive indication of the fluorophore molecule’s rotational motion in the macromolecular surroundings, which directly reflects the degree of constraint imposed by the interaction mechanism.30,31 However, steady-state fluorescence anisotropy measurements are used to track and to collect further information in favor of flavonoid’s (fisetin and morin) interaction with HRAS1 and HRAS2 IM DNA structures. Fluorophores’ anisotropy values are often relatively lower in fluidic solutions and enhance in motionally restricted media such as biomembranes, protein, DNA, micelles, cyclodextrin, and so on.23 In our experimental buffer solution, the anisotropic value of fisetin was found to be 0.204, which is elevated to 0.280 in the presence of HRAS1 IM DNA and 0.225 in the presence of HRAS2 IM DNA (Figure 5 and Table 2). This rise in anisotropy indicates that fisetin binds to the HRAS1 DNA matrix and is occupying a motionally restricted surrounding.
Figure 5.

Left panel: fluorescence anisotropy decay (r) for the fisetin (10 μM, λex = 365 nm) in buffer and also in the HRAS1 and HRAS2 IM DNA (20 μM) (a). Right panel: fluorescence anisotropy decay (r) for the morin (10 μM, λex = 365 nm) in buffer and also in the HRAS2 and HRAS1 IM DNA (20 μM) (b).
Table 2. Fluorescence Decay Parameters of Fisetin and Morin (10 μM) in Buffer and in the Presence of HRAS1 and HRAS2 IM DNA (20 μM)a.
| sample | anisotropy (r) | IHH | IHV | IVH | IVM | IVV | G factor |
|---|---|---|---|---|---|---|---|
| 10 μM fisetin | 0.204 | 8484 | 9429 | 7187 | 8637 | 13964 | 1.11 |
| 10 μM fisetin + 20 μM HRAS1 | 0.280 | 8421 | 9584 | 7081 | 9378 | 16904 | 1.13 |
| 10 μM fisetin + 20 μM HRAS2 | 0.225 | 11651 | 13382 | 9792 | 12339 | 20526 | 1.14 |
| 10 μM morin | 0.132 | 4941 | 2654 | 3854 | 3832 | 2998 | 0.53 |
| 10 μM morin + 20 μM HRAS2 | 0.154 | 5296 | 2844 | 4180 | 4169 | 3507 | 0.53 |
| 10 μM morin + 20 μM HRAS1 | 0.137 | 5337 | 2892 | 4138 | 4118 | 3295 | 0.54 |
IVV, IVH, IHV, and IHH represent fluorescence signals for excitation and emission with the polarizer set at positions (0,0°), (0,90°), (90,0°), and (90,90°), respectively, and G is the sensitivity factor of the detection systems.
In the case of morin, in our experimental buffer solution, the anisotropic value of morin was found to be 0.132 which rises to 0.154 in the presence of HRAS2 IM DNA and 0.137 in the presence of HRAS1 IM DNA (Figure 5 and Table 2). This increase in anisotropy suggests that morin is attached to the HRAS2 IM DNA matrix and is in a motionally restricted environment.
Time-Resolved Fluorescence Decay Measurements
To investigate and confirm the interaction of fisetin and morin with HRAS1 and HRAS2 IM DNA structures, time-resolved fluorescence decay measurements were performed. This lifetime measurement is a sensitive indication of a fluorophore’s local environment and is susceptible to excited-state interactions. Rather than stressing individual decay components derived from bi/triexponential decay fitting, we assessed the behavior of flavonoids inside DNA environments using the average fluorescence lifetime (τavg).23,24
The fluorescence intensity decay of fisetin ESIPT tautomer species in the absence of IM DNA follows a biexponential function with two lifespan components, comprising of a fast component (0.03 ns, with 45% contribution) and a slower component (0.36 ns, with 55% contribution). We found that in HRAS1 IM DNA milieu, the decay of fisetin follows a triexponential pattern consisting of a fast component (1.52 ns, with 37% contribution) representing the free fisetin and a slower dominating component (5.84 ns, with 48% contribution) and another fast component (0.27 ns, with 15% contribution) attributed to the DNA-bound fisetin with the τavg being 2.54 ns (Figure 6a and Table 3). The average lifetime of fisetin progressively enhances with elevated concentration of HRAS1 IM indicating a substantial alteration of the microenvironment of HRAS1 IM-bound fisetin molecule. Compared to HRAS1 IM DNA, τavg is shorter in the HRAS2 IM DNA environment (Figure 6b), indicating that the fisetin molecules are present in a more hydrophobic environment in the HRAS1 IM–fisetin binding complex compared to the HRAS2 IM–fisetin binding complex, which is also reflected in the greater emission yield observed.
Figure 6.

Upper panel: time-resolved fluorescence decay profile of fisetin (10 μM, λex = 373 nm) in aqueous buffer and in the presence of HRAS1 (a) and HRAS2 (b) IM DNA (10 μM, 20 μM). (B) Lower panel: time-resolved fluorescence decay profile of morin (10 μM, λex = 373 nm) in aqueous buffer and in the presence of HRAS2 (c) and HRAS1 (d) IM DNA (10 μM, 20 μM).
Table 3. Fluorescence Decay Parameters of Fisetin and Morin (10 μM) in Buffer and in the Presence of Different Concentrations (10 and 20 μM) of HRAS1 and HRAS2 IM DNA.
| sample | τ1 (ns) | α1 | τ2 (ns) | α2 | τ3 (ns) | α3 | τavg (ns) | χ2 |
|---|---|---|---|---|---|---|---|---|
| 10 μM fisetin in buffer | 0.03 | 0.45 | 0.36 | 0.55 | --- | --- | 0.19 | 1.05 |
| 10 μM fisetin+ 10 μM HRAS1 | 1.25 | 0.40 | 5.56 | 0.49 | 0.15 | 0.11 | 2.32 | 0.98 |
| 10 μM fisetin+ 20 μM HRAS1 | 1.52 | 0.37 | 5.84 | 0.48 | 0.27 | 0.15 | 2.54 | 0.94 |
| 10 μM fisetin+ 10 μM HRAS2 | 1.12 | 0.51 | 0.09 | 0.20 | 4.25 | 0.29 | 1.82 | 0.99 |
| 10 μM fisetin+ 20 μM HRAS2 | 1.13 | 0.51 | 1.00 | 0.19 | 4.24 | 0.30 | 2.12 | 0.95 |
| 10 μM morin in buffer | 0.6 | 0.33 | 0.2 | 0.57 | 5.27 | 0.10 | 2.02 | 0.93 |
| 10 μM morin+ 10 μM HRAS2 | 0.8 | 0.26 | 5.55 | 0.15 | 0.25 | 0.59 | 2.20 | 0.91 |
| 10 μM morin+ 20 μM HRAS2 | 0.9 | 0.24 | 5.79 | 0.18 | 0.27 | 0.58 | 2.32 | 0.93 |
| 10 μM morin+ 10 μM HRAS1 | 0.8 | 0.28 | 4.92 | 0.12 | 0.24 | 0.60 | 1.98 | 0.92 |
| 10 μM morin+ 20 μM HRAS1 | 1.00 | 0.27 | 4.82 | 0.15 | 0.24 | 0.58 | 2.02 | 0.91 |
The fluorescence intensity decay of morin in the absence of IM DNA follows a triexponential function with three lifespan components, comprising of a fast component (0.6 ns, with 33% contribution), another faster component (0.2 ns, with 57% contribution), and a slower component (5.27, 10% contribution). We found that, in the HRAS2 IM DNA environment, the decay of morin follows a triexponential pattern consisting of a fast component (0.9 ns, with 24% contribution) representing the free morin, and a slower component (5.79 ns, with 18% contribution) and another fast component (0.27 ns, with 58% contribution) attributed to the HRAS2 IM DNA-bound morin with the τavg being 2.32 ns (Figure 6c and Table 3). Morin’s average lifespan increases progressively according to rising HRAS2 IM concentration, demonstrating a significant change in the milieu of HRAS2 IM-bound morin. Compared to HRAS2 IM DNA, τavg is shorter in the HRAS1 IM DNA environment (Figure 6d), indicating that the morin molecule experiences more hydrophobic milieu in HRAS2 IM than in the HRAS1 IM DNA, which is also reflected in the greater emission yield observed.
The decreased polarity surrounding fisetin and morin in the HRAS1 and HRAS2 IM DNA milieu is also reflected in a detectable increase in fluorescence lifespan. When a fisetin/morin molecule is confined within the HRAS1/HRAS2 IM DNA’s hydrophobic regions, the reduced accessibility to H2O suppresses the nonradiative decay channels, resulting in an increase in the lifespan of the bound fisetin/morin. The increase in τavg shows that when flavonoids (fisetin and morin) binds to IM DNA (HRAS1 and HRAS2), it is exposed to a solvent-free milieu in the IM DNA matrix, resulting in reduced ESIPT interruptions.
Circular Dichroism (CD) Spectroscopic Studies
CD is a highly sensitive technique for analyzing any structural changes in the backbone of DNA. This method is beneficial for studying IM DNA–ligand interactive associations.32,33 We have performed CD spectroscopic analysis to validate the secondary architectures of the experimental IM DNA and to investigate the probable structural alterations caused by flavonoid binding. In the absence of fisetin and morin, HRAS1 IM and HRAS2 IM showed a positive band at 278 and 290 nm and a negative band at 242 and 264 nm that are the distinctive bands of IM DNA structures. These IM DNA structures are deteriorated at higher pH (Figure S7). After addition of fisetin, we have found no significant differences in peak locations or band intensities (Figure 7a,b). These findings indicated that the secondary conformations of the HRAS1 IM DNA are maintained after binding with fisetin. We also found no significant alterations in peak locations as well as band intensities when increasing concentration of morin (20 and 40 μM) was added in the HRAS2 IM DNA (Figure 7c). These findings suggested that the secondary conformations of HRAS2 IM are persisted following binding with morin. Notably, we also found some peak shifting of HRAS1 IM DNA after the addition of morin (Figure 7d).
Figure 7.

Upper panel: circular dichroic spectral profile of HRAS1 (a) and HRAS2 (b) IM DNA (20 μM) in the presence of fisetin (20 and 40 μM). Lower panel: circular dichroic spectral profile of HRAS2 (c) and HRAS1 (d) IM DNA (20 μM) in the presence of morin (20 and 40 μM).
It has previously been shown that external mode of binding like groove binding as well as electrostatic binding has essentially no influence on the CD spectra but in the intercalative manner of binding impacts both the positive and negative bands.24 In our current experiments, we found no significant change in the location of the peaks or intensities of band with the addition of fisetin and morin, regardless of IM DNA structures. Furthermore, from the CD spectroscopic investigations, we can conclude that there are no notable changes in the secondary conformations of the HRAS1 and HRAS2 IM DNA in the presence of fisetin and morin. The CD findings further point to the existence of an external manner of binding association (such as binding in the loop region) between fisetin with HRAS1 IM and morin with HRAS2 IM DNA structures.
UV Melting Analysis
Thermal denaturation experiments (UV melting) provided another reliable way for investigating the binding of flavonoids to IM DNA structures.34 Local openings in the DNA double helix stretch throughout the entire molecule at certain temperatures, completing the detachment of two strands. Small-molecule intercalations within the double helical is known to elevate the melting temperature (Tm) of DNA by roughly 8°C due to the improved durability of the helical structure in the presence of an intercalator, whereas groove as well as electrostatic mode of binding produce no evident increase in melting temperature.29
We have also conducted thermal melting studies to investigate the influence of flavonoids (fisetin and morin) on the stability of HRAS1 and HRAS2 IM DNA. For every observed transition, Tm was analyzed from the melting curve’s middle point. Tm values were calculated by measuring the absorbance of IM DNA bases at 260 nm. The melting profiles and the variations of the Tm, in the absence and presence of the flavonoids (fisetin and morin), are shown in Figure 8a–d. This demonstrates that as the concentration of fisetin increases, it also improves the thermal endurance of HRAS1 IM DNA, with a 7°C rise in Tm in the presence of 20 μM fisetin. Furthermore, these findings support our hypothesis that fisetin can specifically target and stabilize the HRAS1 IM DNA framework. On the other hand, with rising concentration of morin (20 μM), there is no such gradual increment in the melting temperature of HRAS2 IM DNA. We also found that there is some gradual enhancement of melting temperature of HRAS1 IM DNA (∼4°C) with rising concentration of morin (20 μM). These results clearly ruled out the possibility of fisetin and morin for the intercalation mode of binding and further reinforce the probability for loop binding to HRAS1 IM and HRAS2 IM DNA.
Figure 8.

Upper panel: UV melting profiles of HRAS1 (a) and HRAS2 (b) IM DNA (10 μM) alone and in the presence of fisetin (10 and 20 μM). Lower panel: UV melting profiles of HRAS2 (c) and HRAS1 (d) IM DNA (10 μM) alone and in the presence of morin (10 and 20 μM). Variations of the DNA melting temperature (ΔTm) in °C induced by fisetin and morin.
Isothermal Titration Calorimetric (ITC) Studies
ITC sheds light on the molecular mechanisms that drive IM’s interaction with ligands. Additionally, it is a robust approach that measures the binding enthalpy (ΔH), the free energy of Gibbs (ΔG), and entropy (ΔS) in a single experiment, and it is a high-accuracy method for evaluating binding affinities and stoichiometry.35,36 The thermodynamic parameters and energetics of binding between fisetin and morin and HRAS1 and HRAS2 IM DNA were studied by ITC. The amount of heat generated during the complexation process between fisetin and morin with HRAS1 and HRAS2 IM complexes is shown by the area of each peak. We verified that there was no reasonable influence from background data measured by dilution of flavonoids with a comparable experimental setup. The process of binding of fisetin and morin with HRAS1 and HRAS2 IM DNA is exothermic in nature (Figures 9 and 10). The number of binding sites (n) may be estimated directly and reliably using calorimetric analysis. The thermogram generated by integrating the power output of each injection with respect to time and correcting for heats of dilution deviates substantially from a simple sigmoidal trend. During the initial titration step, there is a little increase, followed by a shallow minimum of the isotherm before the amplitude of exothermic heat for subsequent titration stages quickly declines. For fisetin–HRAS1 IM complex, the enthalpy changes (ΔH is −14.79 kcal mol–1) for the association process is more negative than the entropy changes (TΔS is −8.12 kcal mol–1), indicating the binding procedure to be enthalpy-driven. The Gibbs free energy change (ΔG is −6.67 kcal mol–1) is also negative, inferring the binding process/reaction to be spontaneous (Table 4). The ITC data of fisetin and HRAS1 IM DNA complexation generated a binding constant (Kb value) of 9.41 × 10⁴ M–1 which corresponds to the results of fluorometric investigations. In the case of HRAS2 IM DNA, ITC results were disorganized due to substantially less interaction with fisetin (data shown). From ITC, the obtained Kb value of HRAS2 IM–fisetin complex was 1.34 × 10⁴ M–1, which is lower than that of the HRAS1 IM–fisetin complex (Figure 9).
Figure 9.

ITC profile generated from the interaction between HRAS1 and HRAS2 IM DNA with fisetin. Upper panel shows the isothermal plot of fisetin and HRAS1 (a) and HRAS2 (b) IM DNA complex formation, and the lower panel represents the integrated binding isotherm generated from integration of the peak area as a function of the molar ratio. The solid line (red) represents the best fit data using the ‘one site binding model’.
Figure 10.

ITC profile generated from the interaction between HRAS2 and HRAS1 IM DNA with morin. Upper panel shows the isothermal plot of morin and HRAS2 (a) and HRAS1 (b) IM DNA complex formation, and the lower panel represents the integrated binding isotherm generated from integration of the peak area as a function of the molar ratio. The solid line (red) represents the best fit data using the ‘one site binding model’.
Table 4. Thermodynamic Parameters Determined from Calorimetric Measurements of Temperature-Dependent Interaction of Fisetin–HRAS1 IM and Morin–HRAS2 IM Complexes.
| sample | temp (°C) | N (binding sites) | ΔH (kcal/mol) | TΔS (kcal/mol) | ΔG (kcal/mol) | binding constant (Kb) |
|---|---|---|---|---|---|---|
| Fisetin–HRAS1 | 30 | 0.854 | –14.79 | –8.12 | –6.67 | 9.41 × 10⁴ M–1 |
| Fisetin–HRAS2 | 30 | 0.869 | –13 | –8.69 | –4.31 | 1.34 × 10⁴ M–1 |
| Morin–HRAS2 | 30 | 0.239 | –338 | –336.33 | –1.67 | 2.54 × 10⁴ M–1 |
| Morin–HRAS1 | 30 | 0.235 | –331 | –329.8 | –1.20 | 1.69 × 10⁴ M–1 |
On the other hand, for the morin–HRAS2 IM complex, the enthalpy change (ΔH is −338 kcal mol–1) for the association process is more negative than the entropy change (TΔS is −336.33 kcal mol–1), disclosing the binding procedure to be enthalpy-driven. The Gibbs free energy change (ΔG is −1.67 kcal mol–1) is also negative, inferring the binding process/reaction to be spontaneous (Table 4). The calculated large differences of enthalpy and entropy changes between fisetin and morin are probably due to the positional rearrangements of hydroxyl groups (−OH) in the two molecules. The confidence levels of the calculated ΔH, TΔS, and ΔG are found to be 95%. The ITC data of the morin and HRAS2 IM DNA complex generated a Kb value of 2.54 × 10⁴ M–1 which corresponds to the results of fluorometric investigations. In the case of HRAS1 IM DNA, ITC results were disorganized due to substantially less interaction with morin (data shown). From ITC, the obtained Kb value of the HRAS1 IM–morin complex was 1.69 × 10⁴ M–1, which is lower than the HRAS2 IM–morin complex (Figure 10).
The binding constant (Kb) values derived from ITC clearly demonstrated that fisetin has a stronger binding affinity with HRAS1 than HRAS2 and morin has a stronger binding affinity with HRAS2 than HRAS1, validating multispectroscopic findings.
Probable Functional Role and Positional Influences of the Hydroxyl Groups (−OH) in the Stabilization of the Noncanonical IM DNA Structures
The findings of the experiments presented here demonstrate the importance of hydroxyl groups connected at various points in the B-ring of flavonoids of noncanonical IM DNA constructs. In this current study, we employed two flavonoids with structural differences in the arrangement of the hydroxyl groups in ring B and additional hydroxyl group in ring A. The absorption and fluorescence emission spectrum revealed that these minor structural changes have a significant impact on the characteristics of the flavonoids. Previously, it was revealed that the presence of hydroxyl groups that are present on the B-ring of flavonoids has a significant impact in the long-term stability of both the B-form and the protonated state of calf thymus DNA.26,37
The structural variations between fisetin and morin lead to distinct interactions with HRAS1 and HRAS2 IM DNA structures, according to our findings. The hydroxyl group attached in various locations in the flavonoid structure may contribute to the stability of the Hoogsteen base pairs.26 In addition to (−OH) moieties in flavonoid structural configurations, electron resonance between both the A- and B-rings is critical for their antioxidant and biological functions. The B-ring (−OH) moiety is the most important determining factor in reactive oxygen species scavenging. The differential impact is attributed to the presence of extra hydroxyl groups in morin but not in fisetin. Taking all data into account, we found that the existence of hydroxyl residues on the flavonoid’s B-ring and, more precisely, the arrangement of hydroxyl residues on the B-ring and the presence of additional hydroxyl residues in the A-ring of flavonoids have a substantial effect on its activity.
From our previous investigations and also from other studies (including molecular docking and molecular simulation),9,38−40 it may be predicted that both the flavonoid’s (fisetin and morin) B- and (A+C)-rings may closely reside in the loop regions of the corresponding IM DNA.9 The positional rearrangements of the −OH groups in the B-ring of fisetin and morin may be the main cause of the observed distinct binding interactions with HRAS1 and HRAS2 IM DNA because it tilts the ring in such a manner that it expands out from the loop region and is unable to fit in the same binding site.40
Conclusions
Small compounds like flavonoids that target these noncanonical DNA structures are helpful as research tools to investigate their roles, and they are commonly regarded as having considerable therapeutic prospectives. Furthermore, drug formulation must be geared not only toward discriminating between distinct IM DNA constructions but also toward ensuring preferential detection of certain i-motif DNA structures. In this present investigation, all of the experimental results unambiguously establish that fisetin has a higher affinity with HRAS1 IM DNA (52.17% cytosine residues) and morin has a higher affinity with HRAS2 IM DNA (78.26% cytosine residues). As a consequence of the evidence presented here, we may infer that the binding of fisetin to HRAS1 IM and morin to HRAS2 IM DNA structures is highly influenced by the respective IM DNA bases. We assume that the differences in IM DNA binding are probably due to flavonoid structural changes. The observed significant changes of enthalpy and entropy of fisetin and morin upon binding with HRAS1 and HRAS2 IM are probably due to the confirmational differences of these two ligand structures. Fisetin selectively binds with the HRAS1 IM DNA over the other IM DNAs because it only has a 7′-OH group in the A-ring and 3′-OH and 4′-OH groups in the B-ring. Fisetin has a planar structural shape, which allows it to engage more strongly with HRAS1 IM DNA. Morin, on the other hand, has 5′-OH and 7′-OH groups in the A-ring and 2′-OH and 4′-OH groups in the B-ring and interacts considerably with the HRAS2 IM DNA compared to the rest IM DNAs. The nonplanar structural form of morin may enable it to fit and interact more firmly with HRAS2 IM DNA. This research might help us understand how minor structural differences in the amount and organization of flavonoid functional groups affect their affinity and selectivity for binding IM structures. The novel structural properties of fisetin and morin for the preferred IMs (HRAS1 and HRAS2) might be relevant in cancer theranostics.
To our best knowledge, this is the first discovery of two closely related structural flavonoid compounds (fisetin and morin) with drastically differing selectivity for interacting with different HRAS1 and HRAS2 IM DNA structures. This characteristic of fisetin and morin can be used to further stimulate the production of anticancer compounds. Such research may contribute to a better knowledge of the unique interactions of small compounds with IM DNA structures, which will aid in the process of discovering drugs.
Acknowledgments
Sagar Bag thanks UGC, Govt. of India for providing fellowship [UGC-JRF, NTA reference number: 201610001623]. Sudipta Bhowmik thanks “Intramural Seed Money Research Committee, SBV” for “SBV-Seed money” (SBV/IRC/SEED MONEY/134/2022) for necessary research chemicals and consumables.
Supporting Information Available
The Supporting Information is available free of charge at https://pubs.acs.org/doi/10.1021/acsomega.3c03105.
UV–vis absorption spectra of 15 μM fisetin in the absence and presence of VEGF IM (a), c-MYC IM (b), c-KIT1 IM (c), c-KIT2 IM (d), BCL2 IM (e), and h-TELO IM (f) DNA; UV–vis absorption spectra of 15 μM morin in the absence and presence of VEGF IM (a), c-MYC IM (b), c-KIT1 IM (c), c-KIT2 IM (c), BCL2 IM (d), and h-TELO IM (f) DNA; fluorescence emission spectra of 10 μM fisetin (λex = 365 nm) in the absence and presence of VEGF IM (a), c-MYC IM (b), c-KIT1 IM (c), c-KIT2 IM (d), BCL2 IM (e), and h-TELO IM (f) DNA; fluorescence emission spectra of 10 μM morin (λex = 365 nm) in the presence of increasing concentrations of HRAS2 (a) and HRAS1 (b) IM DNA (30 μM); fluorescence emission spectra of 10 μM morin (λex = 365 nm) in the absence and presence of VEGF IM (a), c-MYC IM (b), c-KIT1 IM (c), c-KIT2 IM (d), BCL2 IM (e), and h-TELO IM (f) DNA; monitoring the fluorescence spectral changes of fisetin (a) and morin (b) at different pH parameters (pH 4, 5, 6, 7, and 8) of the experimental phosphate buffer (50 mM KCl, 10 mM KH2PO4, and 1 mM K2EDTA); and monitoring CD spectral changes of HRAS1 (a) and HRAS2 (b) at different pH parameters (pH 5.4, 6, 7, and 8) of the experimental phosphate buffer (50 mM KCl, 10 mM KH2PO4, and 1 mM K2EDTA) (PDF)
Author Contributions
Conceptualization and experimental design: S.B. and S.B. Investigation: S.B., S.G., and S.K. Data acquisition and analysis: S.B., G.P., and S.B. Supervision: S.B. The final article was revised and approved by all of the authors.
The authors declare no competing financial interest.
Supplementary Material
References
- Pagni S.; Mills J. D.; Frankish A.; Mudge J. M.; Sisodiya S. M. Non-coding regulatory elements: Potential roles in disease and the case of epilepsy. Neuropathol. Appl. Neurobiol. 2022, 48, e12775 10.1111/nan.12775. [DOI] [PMC free article] [PubMed] [Google Scholar]
- Pang B.; van Weerd J. H.; Hamoen F. L.; Snyder M. P. Identification of non-coding silencer elements and their regulation of gene expression. Nat. Rev. Mol. Cell Biol. 2022, 1–13. 10.1038/s41580-022-00549-9. [DOI] [PubMed] [Google Scholar]
- Bag S.; Burman M. D.; Bhowmik S. Structural insights and shedding light on preferential interactions of dietary flavonoids with G-quadruplex DNA structures: A new horizon. Heliyon 2023, 9, e13959. 10.1016/j.heliyon.2023.e13959. [DOI] [PMC free article] [PubMed] [Google Scholar]
- Li Y.; Zhu Y.; Wang Y.; Feng Y.; Li D.; Li S.; Qin P.; Yang X.; Chen L.; Zhao J.; Zhang C.; Li Y. Characterization of RNA G-quadruplexes in porcine epidemic diarrhea virus genome and the antiviral activity of G-quadruplex ligands. Int. J. Biol. Macromol. 2023, 231, 123282 10.1016/j.ijbiomac.2023.123282. [DOI] [PubMed] [Google Scholar]
- Bonnet H.; Morel M.; Devaux A.; Boissieras J.; Granzhan A.; Elias B.; Lavergne T.; Dejeu J.; Defrancq E. Assessment of presumed small-molecule ligands of telomeric i-DNA by biolayer interferometry (BLI). Chem. Commun. 2022, 58, 5116–5119. 10.1039/D2CC00836J. [DOI] [PubMed] [Google Scholar]
- Sedghi Masoud S.; Nagasawa K. i-Motif-binding ligands and their effects on the structure and biological functions of i-motif. Chem. Pharm. Bull. 2018, 66, 1091–1103. 10.1248/cpb.c18-00720. [DOI] [PubMed] [Google Scholar]
- Benabou S.; Aviñó A.; Eritja R.; González C.; Gargallo R. Fundamental aspects of the nucleic acid i-motif structures. RSC Adv. 2014, 4, 26956–26980. 10.1039/C4RA02129K. [DOI] [Google Scholar]
- Ali A.; Bhattacharya S. DNA binders in clinical trials and chemotherapy. Bioorg. Med. Chem. 2014, 22, 4506–4521. 10.1016/j.bmc.2014.05.030. [DOI] [PubMed] [Google Scholar]
- Takahashi S.; Bhattacharjee S.; Ghosh S.; Sugimoto N.; Bhowmik S. Preferential targeting cancer-related i-motif DNAs by the plant flavonol fisetin for theranostics applications. Sci. Rep. 2020, 10, 2504 10.1038/s41598-020-59343-2. [DOI] [PMC free article] [PubMed] [Google Scholar]
- Wright E. P.; Day H. A.; Ibrahim A. M.; Kumar J.; Boswell L. J.; Huguin C.; Stevenson C. E.; Pors K.; Waller Z. A. Mitoxantrone and analogues bind and stabilize i-motif forming DNA sequences. Sci. Rep. 2016, 6, 39456 10.1038/srep39456. [DOI] [PMC free article] [PubMed] [Google Scholar]
- Pages B. J.; Gurung S. P.; McQuaid K.; Hall J. P.; Cardin C. J.; Brazier J. A. Stabilization of long-looped i-motif DNA by polypyridyl ruthenium complexes. Front. Chem. 2019, 7, 744. 10.3389/fchem.2019.00744. [DOI] [PMC free article] [PubMed] [Google Scholar]
- Martino L.; Pagano B.; Fotticchia I.; Neidle S.; Giancola C. Shedding light on the interaction between TMPyP4 and human telomeric quadruplexes. J. Phys. Chem. B 2009, 113, 14779–14786. 10.1021/jp9066394. [DOI] [PubMed] [Google Scholar]
- Kang H. J.; Kendrick S.; Hecht S. M.; Hurley L. H. The transcriptional complex between the BCL2 i-motif and hnRNP LL is a molecular switch for control of gene expression that can be modulated by small molecules. J. Am. Chem. Soc. 2014, 136, 4172–4185. 10.1021/ja4109352. [DOI] [PMC free article] [PubMed] [Google Scholar]
- de Sousa Silva G. V.; Lopes A. L. V. F. G.; Viali I. C.; Lima L. Z. M.; Bizuti M. R.; Haag F. B.; Tavares de Resende e Silva D. Therapeutic properties of flavonoids in treatment of cancer through autophagic modulation: a systematic review. Chin. J. Integr. Med. 2023, 29, 268–279. 10.1007/s11655-022-3674-9. [DOI] [PMC free article] [PubMed] [Google Scholar]
- Teng H.; Deng H.; Zhang C.; Cao H.; Huang Q.; Chen L. The role of flavonoids in mitigating food originated heterocyclic aromatic amines that concerns human wellness. Food Sci. Hum. Wellness 2023, 12, 975–985. 10.1016/j.fshw.2022.10.019. [DOI] [Google Scholar]
- Syed D. N.; Adhami V. M.; Khan N.; Khan M. I.; Mukhtar H.. October. Exploring the molecular targets of dietary flavonoid fisetin in cancer. In Seminars in Cancer Biology; Academic Press, 2016; Vol. 40, pp 130–140. [DOI] [PMC free article] [PubMed] [Google Scholar]
- Fazel Nabavi S.; Braidy N.; Habtemariam S.; Sureda A.; Manayi A.; Mohammad Nabavi S. Neuroprotective effects of fisetin in Alzheimer’s and Parkinson’s Diseases: From chemistry to medicine. Curr. Top. Med. Chem. 2016, 16, 1910–1915. 10.2174/1568026616666160204121725. [DOI] [PubMed] [Google Scholar]
- Prasath G. S.; Subramanian S. P. Modulatory effects of fisetin, a bioflavonoid, on hyperglycemia by attenuating the key enzymes of carbohydrate metabolism in hepatic and renal tissues in streptozotocin-induced diabetic rats. Eur. J. Pharmacol. 2011, 668, 492–496. 10.1016/j.ejphar.2011.07.021. [DOI] [PubMed] [Google Scholar]
- Hyun H. B.; Lee W. S.; Go S. I.; Nagappan A.; Park C.; Han M. H.; Hong S. H.; Kim G.; Kim G. Y.; Cheong J.; Ryu C. H.; et al. The flavonoid morin from Moraceae induces apoptosis by modulation of Bcl-2 family members and Fas receptor in HCT 116 cells. Int. J. Oncol. 2015, 46, 2670–2678. 10.3892/ijo.2015.2967. [DOI] [PubMed] [Google Scholar]
- Kandemir F. M.; Yıldırım S.; Kucukler S.; Caglayan C.; Darendelioğlu E.; Dortbudak M. B. Protective effects of morin against acrylamide-induced hepatotoxicity and nephrotoxicity: A multi-biomarker approach. Food Chem. Toxicol. 2020, 138, 111190 10.1016/j.fct.2020.111190. [DOI] [PubMed] [Google Scholar]
- Verma V. K.; Malik S.; Narayanan S. P.; Mutneja E.; Sahu A. K.; Bhatia J.; Arya D. S. Role of MAPK/NF-κB pathway in cardioprotective effect of Morin in isoproterenol induced myocardial injury in rats. Mol. Biol. Rep. 2019, 46, 1139–1148. 10.1007/s11033-018-04575-9. [DOI] [PubMed] [Google Scholar]
- Rajput S. A.; Wang X. Q.; Yan H. C. Morin hydrate: A comprehensive review on novel natural dietary bioactive compound with versatile biological and pharmacological potential. Biomed. Pharmacother. 2021, 138, 111511 10.1016/j.biopha.2021.111511. [DOI] [PubMed] [Google Scholar]
- Bhattacharjee S.; Chakraborty S.; Sengupta P. K.; Bhowmik S. Exploring the interactions of the dietary plant flavonoids fisetin and naringenin with G-quadruplex and duplex DNA, showing contrasting binding behavior: spectroscopic and molecular modeling approaches. J. Phys. Chem. B 2016, 120, 8942–8952. 10.1021/acs.jpcb.6b06357. [DOI] [PubMed] [Google Scholar]
- Bhattacharjee S.; Sengupta P. K.; Bhowmik S. Exploring the preferential interaction of quercetin with VEGF promoter G-quadruplex DNA and construction of a pH-dependent DNA-based logic gate. RSC Adv. 2017, 7, 37230–37240. 10.1039/C7RA05930B. [DOI] [Google Scholar]
- Kongpichitchoke T.; Hsu J. L.; Huang T. C. Number of hydroxyl groups on the B-ring of flavonoids affects their antioxidant activity and interaction with phorbol ester binding site of PKCδ C1B domain: in vitro and in silico studies. J. Agric. Food Chem. 2015, 63, 4580–4586. 10.1021/acs.jafc.5b00312. [DOI] [PubMed] [Google Scholar]
- Pradhan A. B.; Bhuiya S.; Haque L.; Das S. Role of hydroxyl groups in the B-ring of flavonoids in stabilization of the Hoogsteen paired third strand of Poly (U). Poly (A)* Poly (U) triplex. Arch. Biochem. Biophys. 2018, 637, 9–20. 10.1016/j.abb.2017.11.008. [DOI] [PubMed] [Google Scholar]
- Zhang G.; Guo J.; Pan J.; Chen X.; Wang J. Spectroscopic studies on the interaction of morin–Eu (III) complex with calf thymus DNA. J. Mol. Struct. 2009, 923, 114–119. 10.1016/j.molstruc.2009.02.011. [DOI] [Google Scholar]
- Ghosh P.; Purkayastha P. Selective interaction of methylindoloquinolines with DNA. RSC Adv. 2014, 4, 22442–22448. 10.1039/c4ra03650f. [DOI] [Google Scholar]
- Husain M. A.; Rehman S. U.; Ishqi H. M.; Sarwar T.; Tabish M. Spectroscopic and molecular docking evidence of aspirin and diflunisal binding to DNA: a comparative study. RSC Adv. 2015, 5, 64335–64345. 10.1039/C5RA09181K. [DOI] [Google Scholar]
- Principles of Fluorescence Spectroscopy; Lakowicz J. R., Ed.; Springer: Boston, MA, US, 2006. [Google Scholar]
- Paul B. K.; Guchhait N. Exploring the strength, mode, dynamics, and kinetics of binding interaction of a cationic biological photosensitizer with DNA: implication on dissociation of the drug–DNA complex via detergent sequestration. J. Phys. Chem. B 2011, 115, 11938–11949. 10.1021/jp206589e. [DOI] [PubMed] [Google Scholar]
- Madku S. R.; Sahoo B. K.; Lavanya K.; Reddy R. S.; Bodapati A. T. S. DNA binding studies of antifungal drug posaconazole using spectroscopic and molecular docking methods. Int. J. Biol. Macromol. 2023, 225, 745–756. 10.1016/j.ijbiomac.2022.11.137. [DOI] [PubMed] [Google Scholar]
- Varghese N.; Jose J. R.; Krishna P. M.; Philip D.; Joy F.; Vinod T. P.; Prathapachandra Kurup M. R.; Nair Y. In vitro Analytical Techniques as Screening Tools to investigate the Metal chelate-DNA interactions. ChemistrySelect 2023, 8, e202203615 10.1002/slct.202203615. [DOI] [Google Scholar]
- Platella C.; Ghirga F.; Musumeci D.; Quaglio D.; Zizza P.; Iachettini S.; D’Angelo C.; Biroccio A.; Botta B.; Mori M.; Montesarchio D. Selective Targeting of Cancer-Related G-Quadruplex Structures by the Natural Compound Dicentrine. Int. J. Mol. Sci. 2023, 24, 4070. 10.3390/ijms24044070. [DOI] [PMC free article] [PubMed] [Google Scholar]
- Funke A.; Karg B.; Dickerhoff J.; Balke D.; Müller S.; Weisz K. Ligand-Induced Dimerization of a Truncated Parallel MYC G-Quadruplex. ChemBioChem 2018, 19, 505–512. 10.1002/cbic.201700593. [DOI] [PubMed] [Google Scholar]
- Bastos M.; Abian O.; Johnson C. M.; Ferreira-da-Silva F.; Vega S.; Jimenez-Alesanco A.; Ortega-Alarcon D.; Velazquez-Campoy A. Isothermal titration calorimetry. Nat. Rev. Methods Primers 2023, 3, 17. 10.1038/s43586-023-00199-x. [DOI] [Google Scholar]
- Pradhan A. B.; Haque L.; Bhuiya S.; Ganguly A.; Das S. Deciphering the positional influence of the hydroxyl group in the cinnamoyl part of 3-hydroxy flavonoids for structural modification and their interaction with the protonated and B form of calf thymus DNA using spectroscopic and molecular modeling studies. J. Phys. Chem. B 2015, 119, 6916–6929. 10.1021/acs.jpcb.5b02827. [DOI] [PubMed] [Google Scholar]
- Panczyk T.; Wojton P.; Wolski P. Molecular dynamics study of the interaction of carbon nanotubes with telomeric DNA fragment containing noncanonical G-quadruplex and i-motif forms. Int. J. Mol. Sci. 2020, 21, 1925. 10.3390/ijms21061925. [DOI] [PMC free article] [PubMed] [Google Scholar]
- Oliveira A. P. S.; Lima D. R.; Bezerra L. L.; Monteiro N. K.; Loiola O. D.; Silva M. G. V. Virtual screening of flavonoids from Chamaecrista genus: ADME and pharmacokinetic properties, interactions of flavonoid–DNA complex by molecular docking and molecular dynamics. J. Biomol. Struct. Dyn. 2022, 1–9. 10.1080/07391102.2022.2124455. [DOI] [PubMed] [Google Scholar]
- Bhattacharjee S.; Chakraborty S.; Chorell E.; Sengupta P. K.; Bhowmik S. Importance of the hydroxyl substituents in the B–ring of plant flavonols on their preferential binding interactions with VEGF G–quadruplex DNA: Multi-spectroscopic and molecular modeling studies. Int. J. Biol. Macromol. 2018, 118, 629–639. 10.1016/j.ijbiomac.2018.06.115. [DOI] [PubMed] [Google Scholar]
Associated Data
This section collects any data citations, data availability statements, or supplementary materials included in this article.