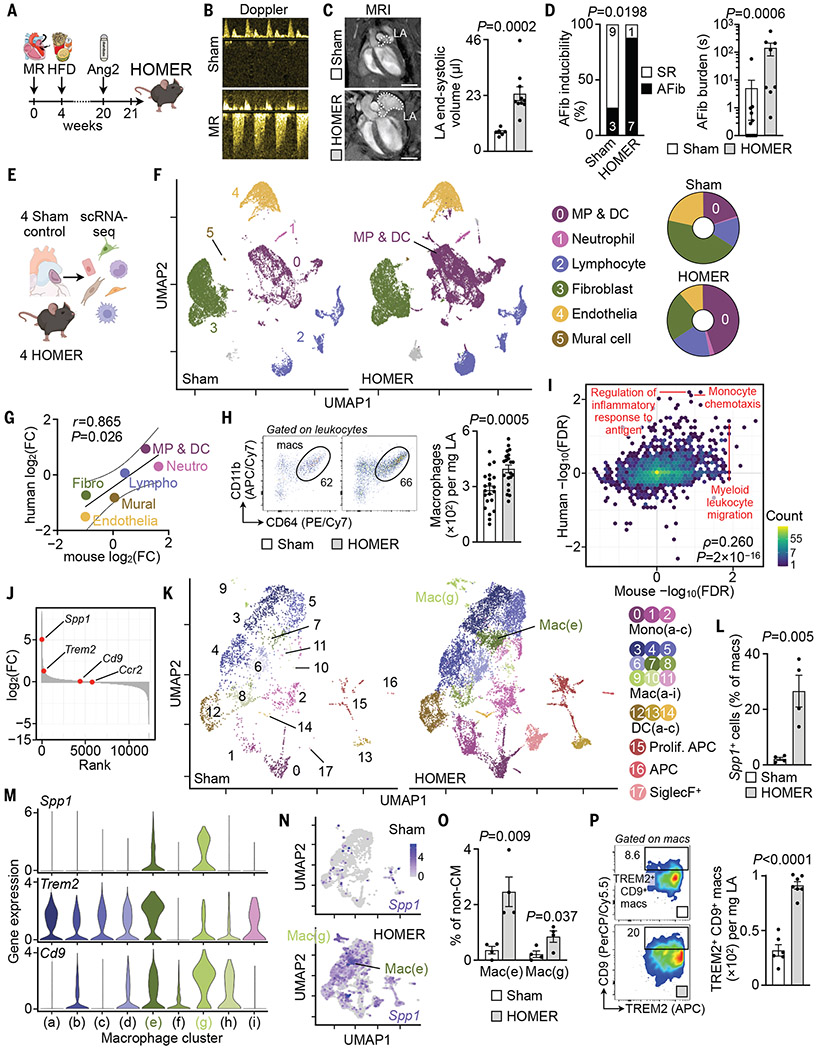
Fig. 2. Single-cell atlas of mouse atria.
(A) HOMER mice are exposed to mitral valve regurgitation (MR), high-fat diet (HFD), and angiotensin 2 (Ang2). (B) Doppler of MR. (C) (Left) MRI of left atrium (LA). Scale bars, 3 mm. (Right) LA end-systolic volume, n = 6 to 10 per group from two independent experiments, two-tailed Mann–Whitney test. (D) AFib inducibility and burden. n = 8 to 12 per group from two independent experiments. (Left) Two-sided Fisher’s exact test. (Right) Two-tailed Mann–Whitney test. Other parameters are shown in table S7. SR, sinus rhythm. (E) scRNA-seq was performed in four sham and four HOMER mice. (F) (Left) UMAP. (Right) Cell population distributions. (G) Log2(FC) of cell abundance in mouse and human atria. (H) Flow cytometry of sham and HOMER atria. n = 21 per group from five independent experiments, two-tailed Student’s t test. APC/Cy7, allophycocyanin/cyanine 7; PE/Cy7, phycoerythrin/cyanine 7. (I) Scatterplot showing C5 GOBP GSEA species concordance. GSEA is performed on lists of genes ranked according to differential expression in the disease state. −log10(FDR) is plotted for mouse (x axis) and human (y axis). −log10(FDR) are negative if the gene set is down-regulated. Yellow indicates high and blue indicates low gene set density. (J) Genes in MP/DC cluster ranked according to log2(FC) between four HOMER and four sham mice. The y axis was broken at −5 for displaying the top down-regulated genes. (K) Subclustering of MP/DCs from four sham and four HOMER mice. APC, antigen-presenting cell. (L) Atrial Spp1+ macrophages by scRNA-seq. n = 4 per group, two-tailed Student’s t test. (M) Gene expression levels (represented by log-transformed normalized counts) across macrophage clusters. (N) Spp1 expression in MP/DCs from sham and HOMER mice. (O) Spp1+ subpopulations in sham and HOMER mice. n = 4 per group, two-tailed Student’s t test. non-CM, noncardiomyocyte. (P) Flow cytometry of atrial macrophages in sham and HOMER mice. n = 6 to 7 per group from two independent experiments, two-tailed Student’s t test. PerCP/Cy5.5, peridinin-chlorophyll-protein/cyanine 5.5. All bar graph data are mean ± SEM with individual values for data distribution.

