Abstract
Animals associate cues with outcomes and update these associations as new information is presented. This requires the hippocampus, yet how hippocampal neurons track changes in cue–outcome associations remains unclear. Using two-photon calcium imaging, we tracked the same dCA1 and vCA1 neurons across days to determine how responses evolve across phases of odor–outcome learning. Initially, odors elicited robust responses in dCA1, whereas, in vCA1, odor responses primarily emerged after learning and embedded information about the paired outcome. Population activity in both regions rapidly reorganized with learning and then stabilized, storing learned odor representations for days, even after extinction or pairing with a different outcome. Additionally, we found stable, robust signals across CA1 when mice anticipated outcomes under behavioral control but not when mice anticipated an inescapable aversive outcome. These results show how the hippocampus encodes, stores and updates learned associations and illuminates the unique contributions of dorsal and ventral hippocampus.
As a child, an unexpected encounter with an ice cream truck can be a highly rewarding experience. To better predict the circumstances that led to this occurrence, the brain gathers information surrounding the incident, from broad cues associated with the availability of reward (the presence of music, the neighborhood in which the encounter occurred), to more detailed stimulus representations (the specific melody played, the precise location of the encounter), to the positive outcome from the experience of consuming ice cream. After repeated encounters, the most predictive features are identified and used to inform behavior, such as grabbing your parents’ money and running outside when the melody is heard.
The above illustrates a fundamental objective of the brain: to extract the underlying structure of the world and model its causal relationships. Moreover, the brain must be able to flexibly update these models as cue–outcome relationships change (for example, when the melody is replaced or the truck no longer carries your favorite flavors). Although the importance of examining the population dynamics underlying cognitive processes is becoming increasingly appreciated1,2, it is still unclear how learned associations are represented at the population level and how these representations change as a function of learning.
One area heavily implicated in encoding learned associations is the hippocampus (HPC). Genetic, anatomical and functional data suggest that the dorsal and ventral subdivisions of the rodent HPC (dHPC and vHPC) play distinct roles when learning about the world3,4. Previous studies showed that neuronal responses in dHPC encode relatively specific information about the world, such as position within an environment, elapsed time, the identity of individual stimuli and conjunctive representations, such as object–location couplings5–8. In contrast, vHPC representations respond to more abstract elements that generalize across distinct objects and events9–12 with subsets of cells hypothesized to reflect the overall valence of an experience13,14. Thus, during learning, detailed representations by dHPC may support the formation of associative memories based on local cues, such as the precise identity of an object in an environment, whereas broad vHPC representations may generalize knowledge across multiple experiences and/or attach significance to contexts in which associations occur.
Although dHPC and vHPC may encode unique features of an explored environment, it remains largely unknown how these areas are engaged during the encoding of associative memories. Moreover, how neural responses are transformed when learned relationships are manipulated and updated is also unclear. In this study, we used two-photon in vivo imaging of population activity in dCA1 or vCA1 to track the activity of the same neurons across multiple days as mice learned to associate odor stimuli with appetitive or aversive outcomes. This allowed us to examine how task-related information is represented across the dorsoventral (DV) hippocampal axis, including how these representations evolve with learning, their stability over time, the influence of different outcomes on these encoding properties and how neural representations adapt when cue–outcome relationships are altered.
Results
Representations of odor identity in CA1
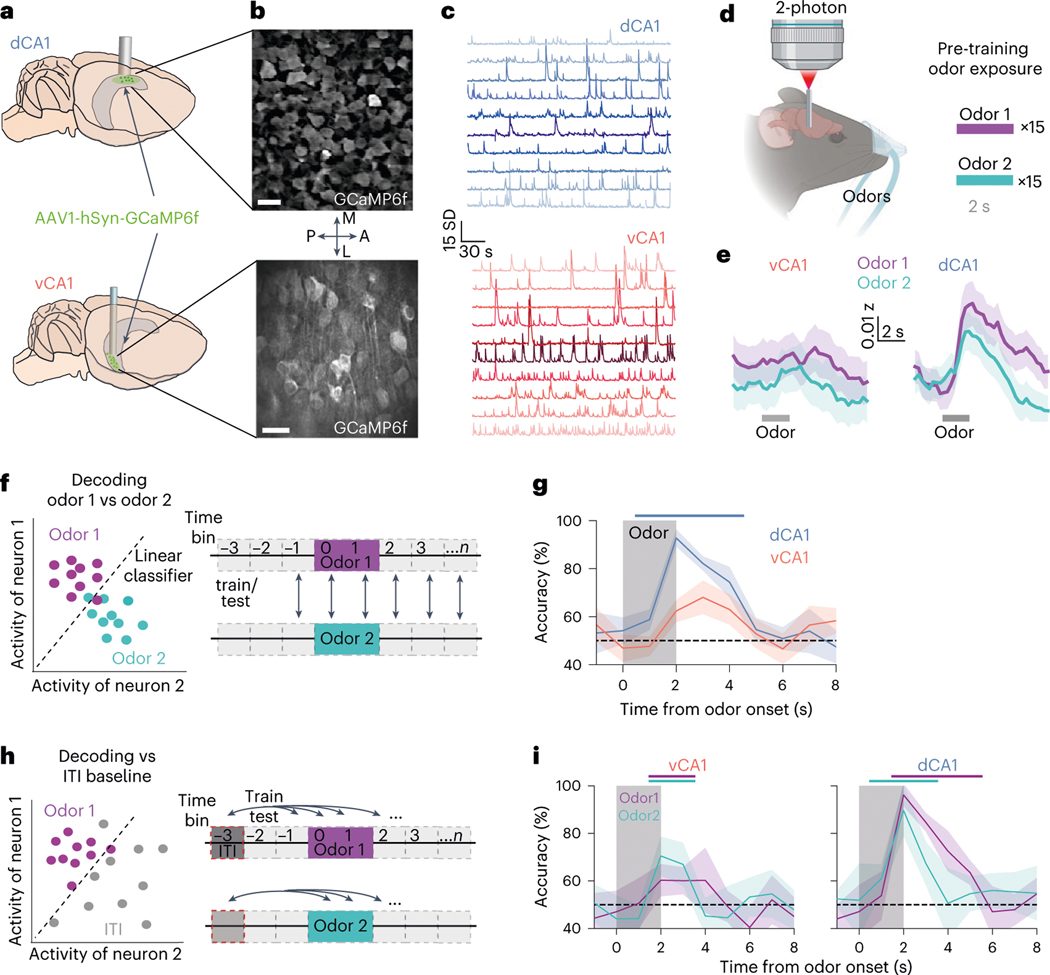
To assess baseline responding to odors before training, we first recorded odor representations in CA1 in response to two passively delivered odorants. We imaged neural responses in dCA1 and vCA1 using high-resolution two-photon microscopy in mice expressing the calcium indicator GCaMP6f (Fig. 1a–c and Extended Data Fig. 1). In dCA1, we found that both odors elicited robust neuronal responses (Fig. 1e and Extended Data Fig. 1e). To examine whether population responses were distinct for each odor, we trained a linear classifier to distinguish trial-type activity patterns (Fig. 1f) and then tested classification accuracy using held-out trials. As the number of dimensions (that is, neurons) influences decoder performance, this parameter was held constant across comparisons (Supplementary Table 1). Decoding analyses showed that odor identity could be decoded from dCA1 population activity with high accuracy (Fig. 1g and Extended Data Fig. 2). Odor-evoked population responses could also be accurately discriminated from inter-trial interval (ITI) (baseline) activity (Fig. 1h,i). Conversely, odor responses in vCA1 neurons were weaker than in dCA1 (Fig. 1e and Extended Data Fig. 1d), and linear decoders performed significantly worse compared to dCA1 when reading out trial identity or discriminating odor-evoked activity from baseline activity (Fig. 1e–i and Extended Data Fig. 2). Collectively, these data suggest that, during initial exposure to odorants that lack behavioral relevance or meaningful associations, odor identities are strongly represented in dCA1 but less so in vCA1.
Fig. 1 |. Before conditioning, odor stimuli are more strongly represented in dCA1 versus vCA1.
a, AAV expressing GCaMP6f was targeted to dCA1 or vCA1, and a GRIN lens was implanted above the injection site. b,c, Sample FOVs demonstrating GCaMP expression (b) and time series (c) data of denoised fluorescent traces. Scale bar in b = 25 μm. d, Calcium signals were imaged while mice received 30 trials of 2-second odor exposures (15 of each odor). e, Population mean (±s e.m.) of -scored fluorescent signals occurring around the onset of odor 1 (purple) or odor 2 (cyan). Gray bar is the odor delivery period. n = 11 vCA1 and 5 dCA1 mice. f, Left: simplified schematic of decoding procedure with two neurons. Dots represent the single-trial ‘population’ activity vector during odor delivery. Linear classifiers were trained to distinguish population activity patterns during odor 1 trials versus odor 2 trials for each 1-second time bin. g, Decoding accuracy for odor 1 versus odor 2 trials (line is mean; shading is ±s d ). Colored-coded bar denotes time bins where accuracy is significantly higher for dCA1 compared to vCA1 (P < 0.01, two-sided Mann–Whitney -test; n = 10 decoding iterations using 454 cells for each region). See Supplementary Table 1 for all statistical analysis details. h, Left: decoding schematic. Dots represent the single-trial ‘population’ activity vector during baseline (gray) or odor delivery (purple) periods. Right: Linear classifiers were trained to distinguish population activity patterns occurring during baseline from those occurring at time bin . i, Same as g above but decoding versus baseline for each time bin (line is mean; shading is ±s.d.). Color-coded bars above graphs denote time bins for each odor where decoding accuracy is significantly greater than chance (P < 0.01, two-sided Mann–Whitney -test; n = 10 decoding iterations from -matched 454 cells). Although there was no difference in how well each odor could be discriminated from baseline activity for dCA1, we did observe a significant difference between odors for vCA1 (dCA1: Mann–Whitney -test = 70 5, P = 0 13; vCA1: Mann–Whitney -test = 18, P = 0.017). AAV, adeno-associated virus.
Learning enhances odor representations in vCA1
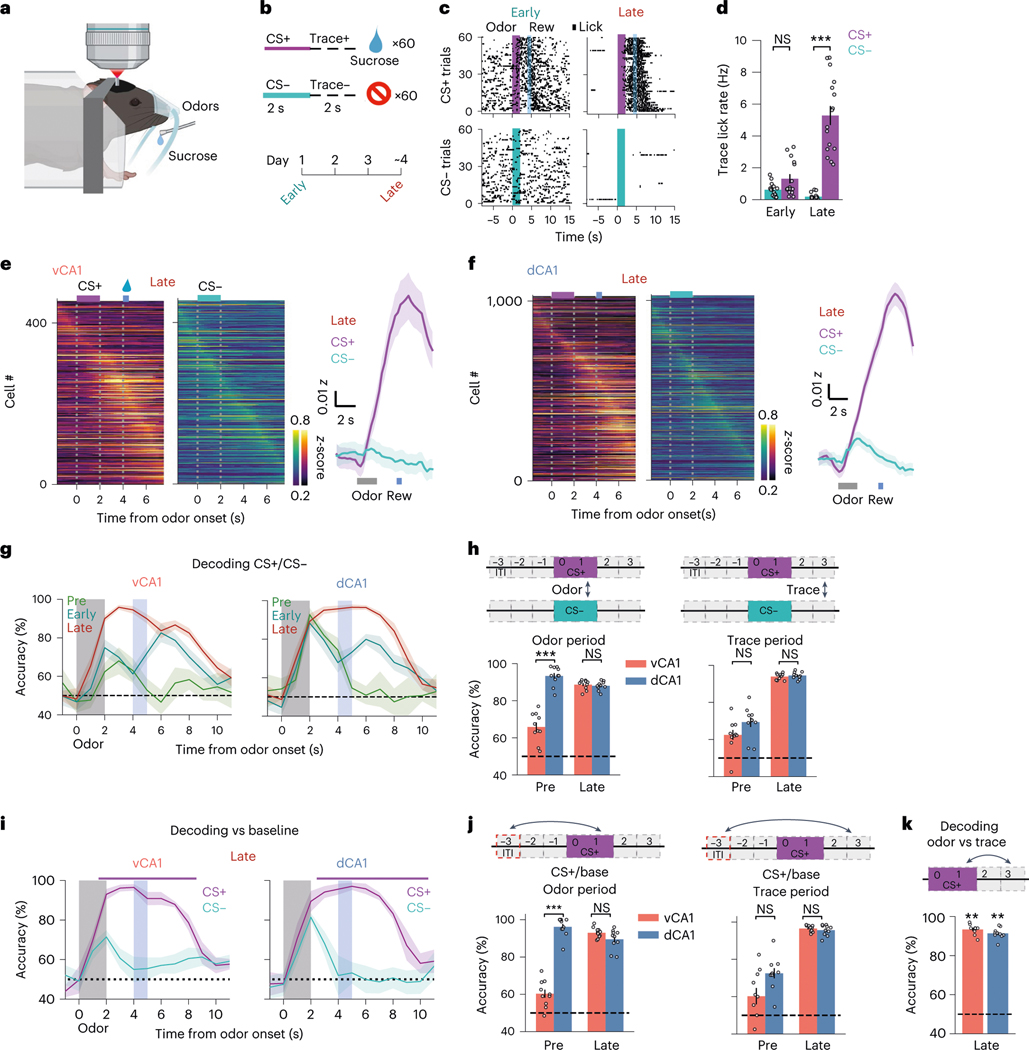
Given the role of the vHPC in emotional and motivational processes15, we reasoned that odor representations may be enhanced in vCA1 if paired with a salient outcome. To disambiguate odor representations from potential reward anticipation signals, we used a two-odor trace appetitive conditioning paradigm wherein the conditioned stimulus (CS+) odor was separated from sucrose reward delivery by a 2-second trace period. After ~4 days of training, mice displayed anticipatory licks during the CS+ trace period, with minimal licking during all other task periods (Fig. 2a–d).
Fig. 2 |. Discrimination training enhances task representations.
a,b, Task schematics. Calcium activity was imaged during learning of an odor discrimination task. c, Lick rasters for an individual animal across learning. d, Mean lick rates during the 2-second pre-reward (trace) period for all animals (n = 16 mice: 11 vCA1, 5 dCA1; two-sided Mann–Whitney -test; error bars indicate mean ± s.e.m.). e, Left: mean -scored fluorescent signals for all vCA1 cells during Late session, ordered by peak time bin. See Extended Data Fig. 2a for Early session. Right: population mean (shading indicates ±s.e.m.). f, Same as in e but for dCA1. g, Mean trial type decoding accuracies from ten decoding iterations, using -matched 454 cells (line indicates mean; shading indicates ±s d ). Odor delivery period is the vertical gray bar. Sucrose delivery period (CS+ trials only) is the vertical blue bar. Odor-period encoding selectively increases in vCA1, whereas trace period representations increase in both vCA1 and dCA1. h, Decoding accuracies for CS+ versus CS− during odor (left) or trace (right) periods (n = 10 decoding iterations from -matched 454 cells; two-sided Mann–Whitney -test; error bars indicate mean ± s.e.m.). i, Decoding accuracies for each trial type versus ITI baseline (line indicatees mean; shading indicates ±s d ). Color-coded bar above shows periods where the CS+ decoding accuracy versus baseline is significantly greater than that of CS− (P < 0.01; two-sided Mann–Whitney -test; n = 10 decoding iterations using 454 cells). Note the low decoding accuracy for CS− trials during the odor period in vCA1 animals, suggesting that trial type decoding in g is largely being driven by increased responsiveness to the behaviorally meaningful CS+ trials. j, Same as h but decoding CS+ versus ITI baseline (n = 10 decoding iterations using -matched 454 cells; two-sided Mann–Whitney -test; error bars indicate mean ± s.e.m.). k, Decoding results for distinguishing odor-versus trace period-activity (mean ± s.e.m.; two-sided Mann–Whitney -test; n = 10 decoding iterations using 454 cells). Population activity patterns during odor and trace periods could be well distinguished from one another in both areas. *P < 0.05, **P < 0.01, ***P < 0.001. See Supplementary Table 1 for all statistical analysis details. NS, not significant.
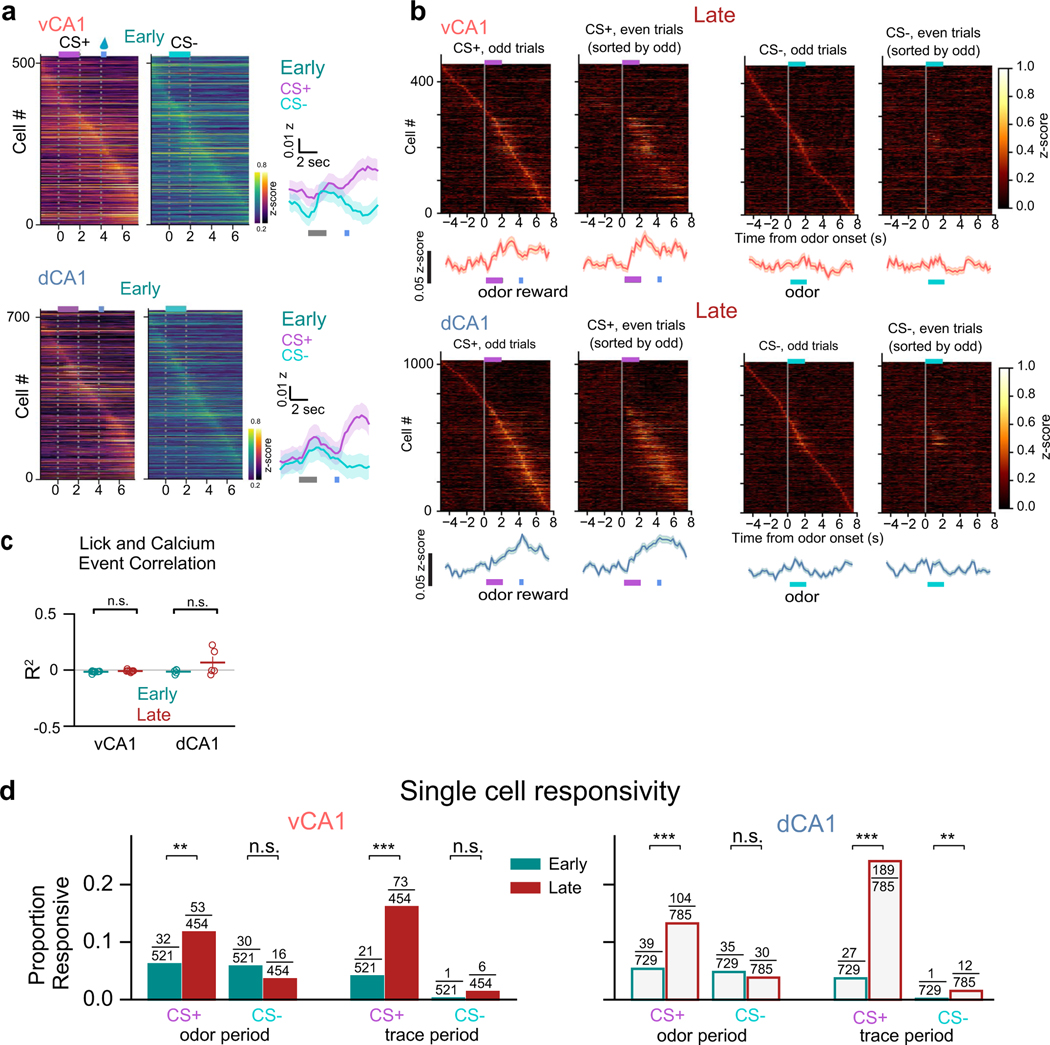
In vCA1, learning of the odor–reward association was accompanied by an overall increase in mean activity during the CS+ odor presentation (Fig. 2e) and heightened ability to discriminate CS+ versus CS−population activity during the odor period (Fig. 2g,h and Extended Data Fig. 4a). This increase in trial-type decoding accuracy in vCA1 appeared to be driven by altered processing of the now-salient CS+ odor, as both odor responsivity (Fig. 2e) and accuracy for decoding odor period versus baseline activity (Fig. 2i,j and Extended Data Fig. 4c) increased with learning for the CS+ odor but not the CS− odor. Thus, assigning value to a stimulus leads to increased odor-evoked activity and encoding in ventral CA1. This was in contrast to dCA1, where odor-decoding accuracy was high before training and remained so with learning (Fig. 2g,h and Extended Data Fig. 4a–c). However, dCA1 did show a learning-related increase in the proportion of cells responsive to the CS+ odor but not the CS− odor (Extended Data Fig. 3d), suggesting that stimulus representations in dCA1 may also be sensitive to perceived value.
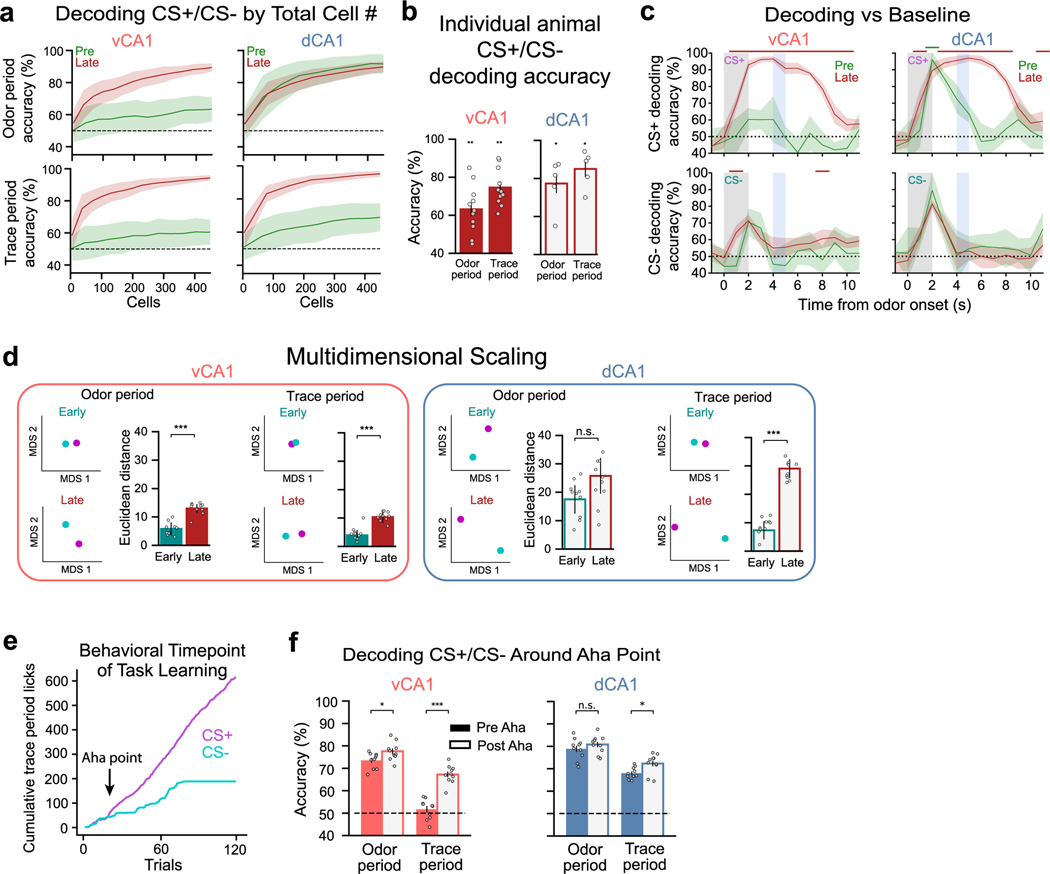
We next examined representations in the trace period, during which trained animals anticipate reward availability. We found parallel changes in trace period representations in dCA1 and vCA1 with learning (Fig. 2g–j and Extended Data Fig. 4a–d). Mean trace-period-evoked activity in both dCA1 and vCA1 markedly increased after CS+ delivery but not after CS− delivery. Correspondingly, CS+/CS− trial-type decoding accuracy during the trace period was significantly higher in both regions after learning. These trace period representations emerged in concert with the initial signs of behavioral learning (Extended Data Fig. 4e,f), could not be explained solely by licking behavior (Extended Data Fig. 3c) and were distinct from odor period representations (Fig. 2k).
Together, these data suggest that a representation of odor identity is present in dCA1, independent of learning, whereas representations in vCA1 show greater dependence on learned behavioral significance. In addition, with learning, both vCA1 and dCA1 are recruited during the trace period before reward delivery, possibly encoding information related to the expectation of reward.
Extinction and reinstatement of odor representations in vCA1
We next examined how stimulus representations change upon extinction of the odor–reward contingency. Would vCA1 continue to exhibit strong representations of odor, perhaps reflecting an enduring memory of the CS–unconditioned stimulus (US) association, or would decoding performance fall back to baseline levels, suggesting that vCA1 signals track current stimulus value?
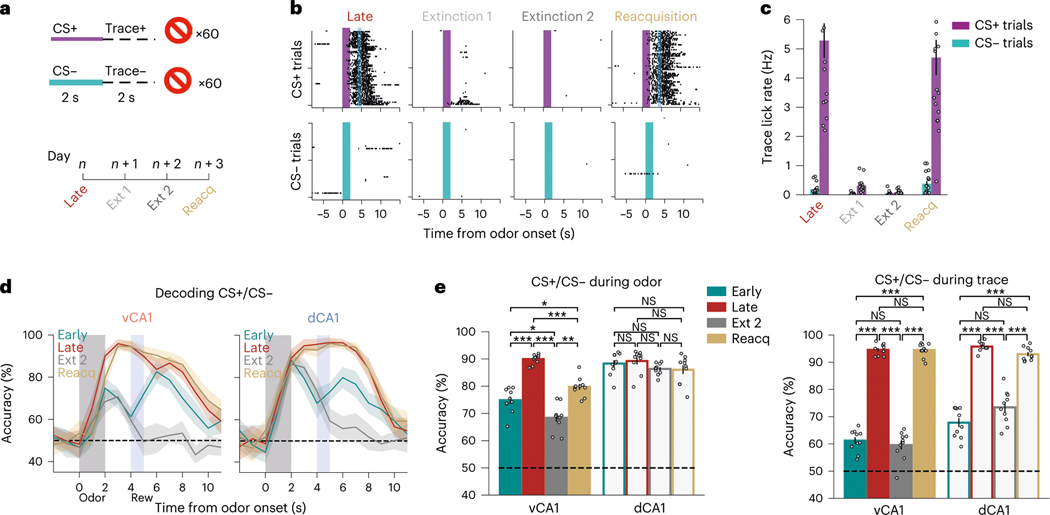
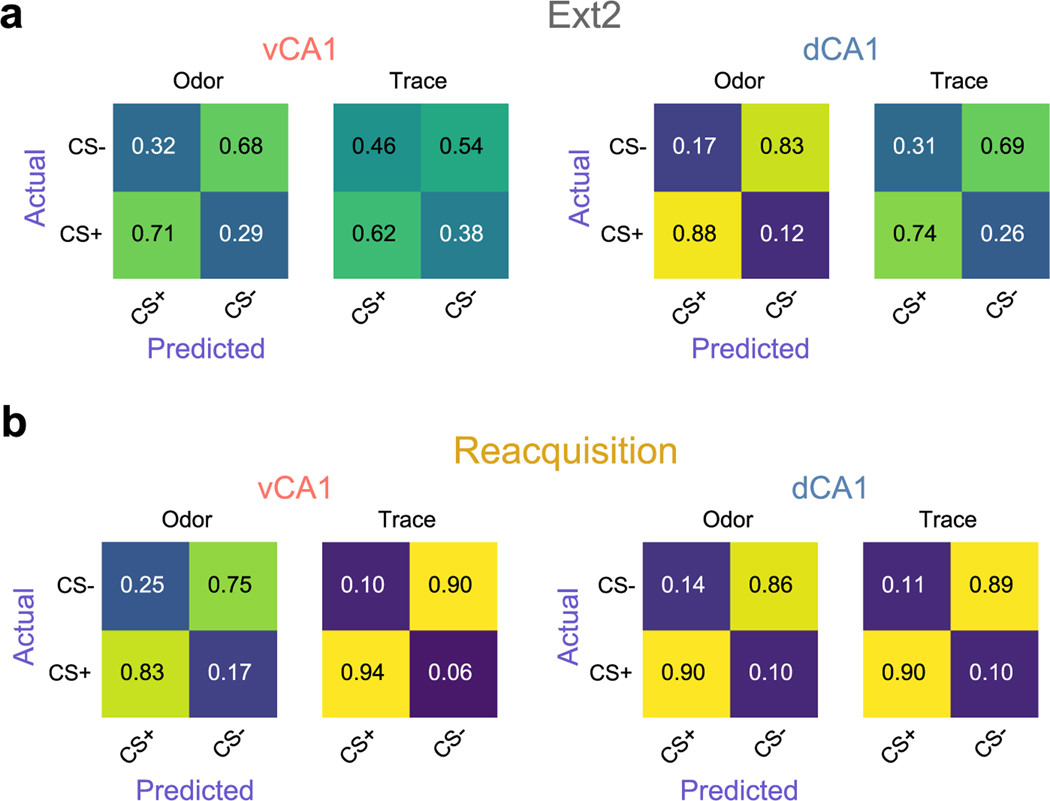
After mice learned the odor–reward association, we extinguished it, omitting reward from CS+ trials. Mice rapidly extinguished the conditioned response early in the first session of extinction (Fig. 3a–c). In an extinction retrieval session 24 hours later (Ext2), we found that odor classification accuracy resembled that of early, pre-learning sessions—that is, low in vCA1 but high in dCA1 (Fig. 3d,e and Extended Data Fig. 5a).
Fig. 3 |. Learned odor representations are sensitive to extinction but can be rapidly reinstated.
a, Task schematic. After acquisition of the cue–outcome discrimination task, mice were run through 2 days of extinction training where reward was omitted from all trials. The next day, animals underwent a Reacquisition session where the odor–sucrose contingency was restored. b, Lick rasters from an individual animal. Mice displayed a near absence of licking during the second day of extinction training and rapid resumption of anticipatory licking during the Reacquisition session, illustrating an intact memory of the task structure. c, Mean trace period lick rates (error bars ± s.e.m.) across all animals (n = 11 vCA1 and 5 dCA1). d, Trial-type decoding accuracies (mean of ten decoding iterations; line indicates mean; shading indicates ±s.d.). Analyses used 454 cells for each region. Early and Late are as in Fig. 2g and are shown for reference. e, Trial-type decoding accuracies during odor (left) or trace (right) periods (n = 10 decoding iterations using -matched 454 cells; two-sided Mann–Whitney -test; error bars indicate mean ± s.e.m.). Odor period decoding accuracy tracked with odor value in vCA1 but not in dCA1. Trace period accuracy tracked reward expectation in both hippocampal regions. *P < 0.05, **P < 0.01, ***P < 0.001. See Supplementary Table 1 for all statistical analysis details. NS, not significant.
The next day, we reinstated conditioned responses in a reacquisition session. Animals rapidly resumed anticipatory licking behavior during CS+ trials, indicating an intact memory of the rewarded task structure. Correspondingly, odor identity classification accuracy increased in vCA1 (Fig. 3d,e and Extended Data Fig. 5b). These data indicate that the discriminability of odor representations in vCA1 is sensitive to the current value associated with an odor.
Task representations reorganize and then stabilize with learning
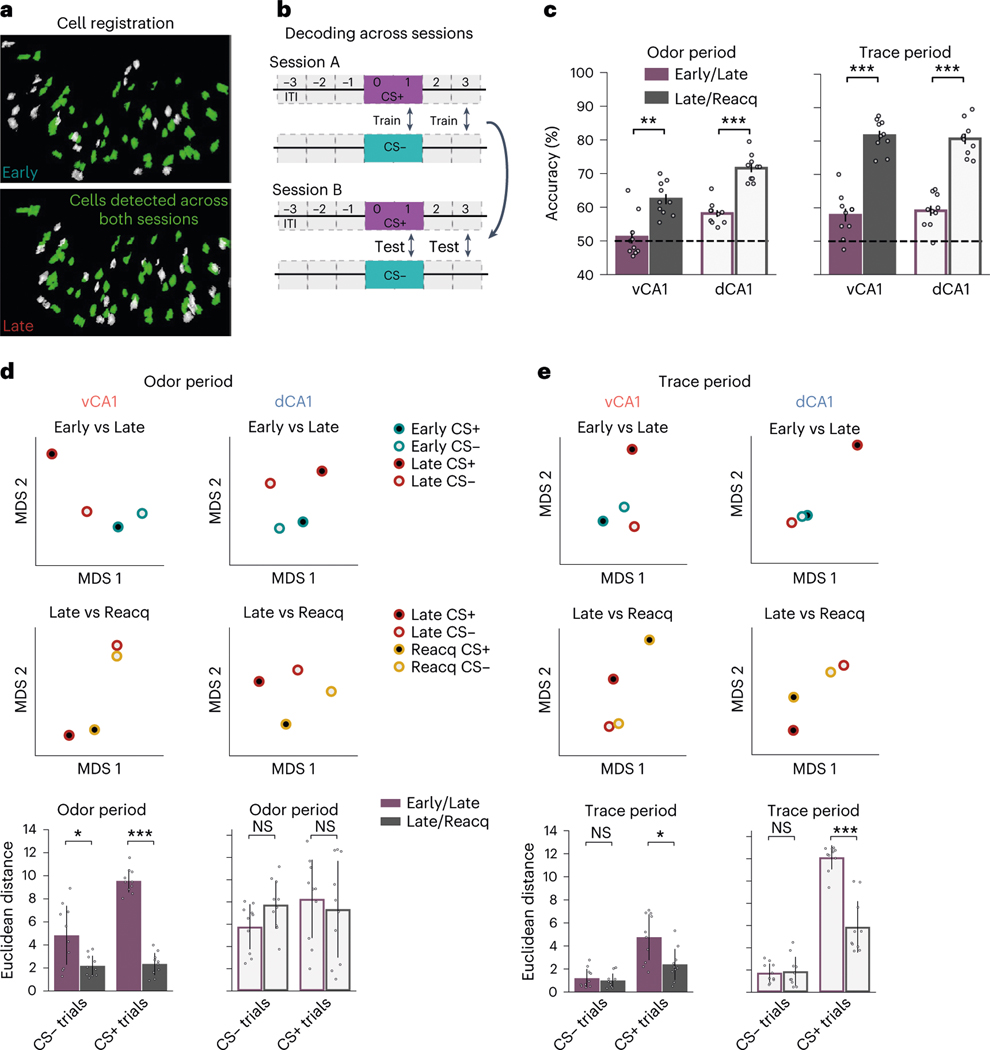
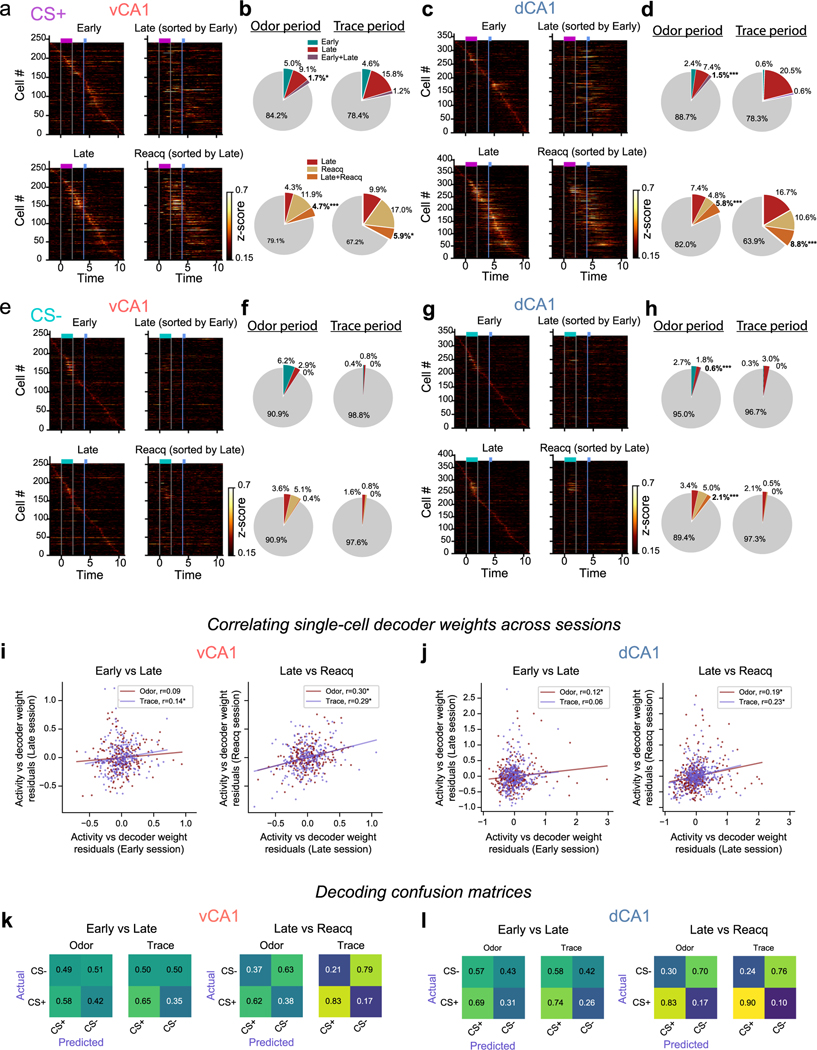
To probe the stability of odor and trace representations across different phases of training, we applied a cross-session classifier to neurons tracked across sessions (Fig. 4a,b). For this, a linear classifier was trained to discriminate trial type in one session, and classification accuracy was tested using data from a separate session. When examining vCA1 activity during the odor period, we found that a cross-session decoder performed poorly across initial learning (decoder trained in one session (Early) and tested in another session (Late) and in the reciprocal direction (train on Late, test on Early); results reflect average of both directions (Fig. 4c)). In dCA1, although odor identities were reliably represented both before (Early) and after (Late) discrimination training, we found that a cross-session decoder performed poorly across these sessions, indicating that, as in vCA1, odor representations in this region are transformed with learning. Cross-session decoding of CS+/CS− using trace period activity from Early to Late sessions was poor for both dCA1 and vCA1, suggesting a change in trace period representations with learning (Fig. 4c and Extended Data Fig. 6k).
Fig. 4 |. Task representations stabilize with learning.
a, Example of cells from the same FOV registered across Early and Late sessions. b, Across-session trial-type decoding schematic. A linear decoder was trained to discriminate CS+ versus CS− population activity during one session (session A), and classification accuracy was tested using CS+ and CS− activity patterns from a different session (session B). The reciprocal direction (train on session B, test on session A) was also analyzed, and final decoding results reflect the average of both directions. c, Across-session decoding results (n = 10 decoding iterations from -matched 241 cells; two-sided Mann–Whitney -test; error bars indicate mean ± s.e.m.). Decoding performance is significantly higher for odor and trace periods after task acquisition (Late/Reacquisition) versus during learning (Early/Late), indicating a stabilization of task representations after learning. Despite high odor period decoding accuracy in dCA1 for Early and Late sessions individually (Fig. 3e), decoding across these sessions was comparatively low. Thus, although dCA1 activity distinguishes odors robustly at all training points, odor representations are transformed with learning. d, To analyze within-session and across-session similarity between trial-type population activity patterns, we projected the hyper-dimensional neural data onto two-dimensional space via MDS (Methods). Here, the relationship between activity patterns is represented in geometrical space; the closer two points are in space, the more similar their activity patterns are. Top: two-dimensional dot plots showing an individual MDS run. Bottom: average Euclidean distance between specified points. In vCA1, CS+ odor representations show considerable transformation with initial learning (Early/Late) but then largely stabilize (Late/Reacquisition), whereas CS− odor representations show comparatively little change with learning. dCA1 odor representations fluctuate across all sessions (n = 10 MDS runs; two-sided Mann–Whitney -test with Bonferroni correction; error bars indicate mean ± s d ). e, As d but for trace period. CS− trace representations show little change with learning, whereas CS+ representations show large initial changes with learning that then stabilize (n = 10 MDS runs; two-sided Mann–Whitney -test with Bonferroni correction; error bars indicate mean ± s d ). *P < 0.05, **P < 0.01, ***P < 0.001. See Supplementary Table 1 for all statistical analysis details. NS, not significant.
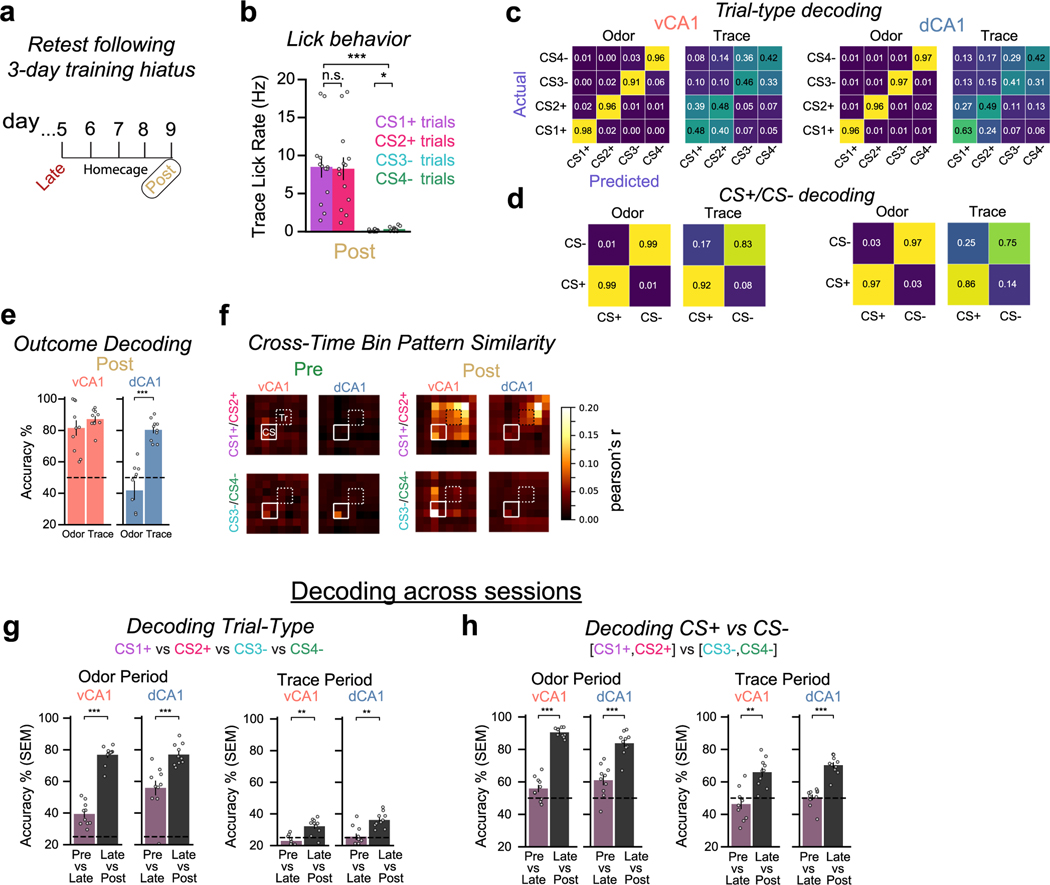
We next used cross-session decoding to examine the stability of task representations once learned. Using data from cells tracked across Late and Reacquisition sessions, we found that odor-period and trace-period representations remained relatively stable in both vCA1 and dCA1 (Fig. 4c and Extended Data Fig. 6k). This contrasts with the instability of task representations observed during initial learning and indicates that, once learned, representations of odor and trace are, to a large extent, stable across days and across the degradation and reinstatement of odor–reward contingencies. This was also true in the absence of any additional learning (that is, no extinction training between sessions), as similar results were found in a separate cohort of mice that were imaged in an odor–reward learning task in Early/Late sessions and an additional session (Post) 4 days after the Late session (Extended Data Fig. 8a–d). Here, cross-session decoding accuracy was significantly lower across Early/Late sessions compared to Late/Post (Extended Data Fig. 8g,h). Collectively, these results indicate that CA1 may be a storage site for these odor–outcome representations.
To further probe how population activity changes across training, we used multidimensional scaling (MDS) to visualize the geometric architecture of the representations (Fig. 4d,e). When examining vCA1 odor period representations, we found that CS+ representations and, to a lesser extent, CS− representations were modified with initial learning (Early versus Late). Once learned, however, CS+ and CS− representations both remained relatively stable in vCA1, as seen in the reduced Euclidean distance between Late and Reacquisition representations (Fig. 4d). Intriguingly, such a reduction in Euclidean distance across Late and Reacquisition sessions was not observed in dCA1, suggesting that, although odor representations stabilize with learning, they remain dynamic at the population level. Analysis of trace period representations produced similar results for both dCA1 and vCA1. Here, CS− representations showed little separation throughout training, whereas CS+ representations displayed a large change with initial learning that then stabilized across Late and Reacquisition sessions (Fig. 4e).
Analysis of single-cell responses showed a similar pattern: high turnover in the identity of odor-responsive and trace-responsive cells during initial learning that subsequently stabilized across Late and Reacquisition sessions (Extended Data Fig. 6a–h). Finally, we compared how decoder weights assigned to each cell changed across sessions to identify training-related changes in the contribution of individual cells to decoding. This analysis also revealed a stabilization of task representations after initial learning (Extended Data Fig. 6i,j).
Pre-reward signals generalize across predictive cues
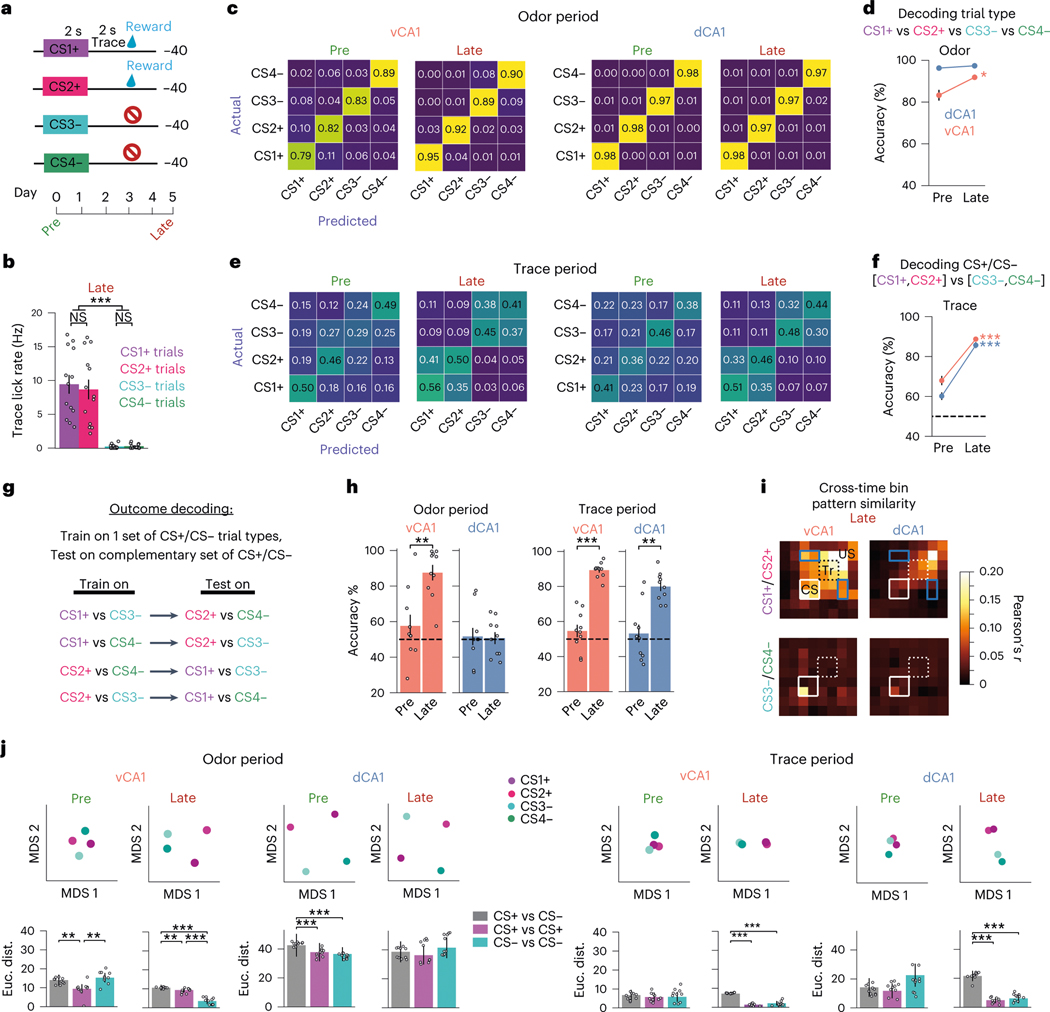
Our results thus far show that learning increases recruitment of both dCA1 and vCA1 during the odor and trace periods. However, what information is being encoded during each of these epochs is not well elucidated by the two-odor task. Thus, to better address this question, we trained mice with four odor stimuli: two that were always followed by sucrose reward (CS1+ and CS2+) and two that were followed by no outcome (CS3− and CS4−). This design allowed us to directly test the similarity of representations across trial types with distinct cue identities but the same outcome (Fig. 5a,b).
Fig. 5 |. Individual odor representations dominate dCA1, whereas vCA1 incorporates information about future outcome. Both regions represent anticipated outcome during the trace period.
a, Four-odor task schematic. b, Mean trace period lick rates during the Late session (n = 13 mice: 8 vCA1, 5 dCA1; two-sided Mann–Whitney -test; error bars indicate mean ± s.e.m.). c, Confusion matrices for decoding trial type (150 cells per region). The axis is the true trial type, and the axis is predicted. The ascending diagonal is the correct classification, and other entries are incorrectly identified as the corresponding trial type. d, Average trial-type classification accuracy during odor was unchanged with learning in dCA1 but increased in vCA1 (n = 10 decoding iterations using -matched 150 cells; two-sided Mann–Whitney -test; error bars indicate mean ± s.e.m.). Statistical analyses compared Pre versus Late for each region. e, Same as in c but decoding using trace period activity patterns. Unlike the odor period, there is an increased incidence of parallel trial types (for example, CS1+ and CS2+) being confused during trace, indicative of similar representations. f, CS+ trial types could be better discriminated from CS− trial types with learning in both vCA1 and dCA1 (n = 10 decoding iterations using -matched 150 cells; two-sided Mann–Whitney -test; error bars indicate mean ± s.e.m.). g, A linear classifier was trained to discriminate activity between reward-predictive and non-predictive trial types (for example, CS1+ versus CS3−) and then tested using data from the complementary trial types (CS2+ and CS4−). h, Mean decoding accuracy for all combinations of trial type (n = 10 decoding iterations using -matched 150 cells; two-sided Mann–Whitney -test; error bars indicate mean ± s.e.m.). i, Pearson’s correlation of activity patterns across CS+ (top) or CS− (bottom) trials. White box denotes odor; dashed box denotes trace. vCA1 displayed elevated pattern similarity between CS1+ and CS2+ trials that spanned across all task time bins. Blue boxes denote the data points that report similarity between odor period and sucrose representations. j, Visualization of within-session pattern similarities via MDS. Top: example MDS run. Bottom: average (n = 10 MDS runs; two-sided Mann–Whitney -test; error bars indicate mean ± s.e.m.). After training, trace period representations cluster into groups based on trial type. *P < 0.05, **P < 0.01, ***P < 0.001. See Supplementary Table 1 for all statistical analysis details. NS, not significant.
We first tested how well a linear classifier could predict each of the four trial types using population activity during the odor or trace periods (Fig. 5c–f and Extended Data Fig. 7a,b for confusion matrices of CS+ and CS− trials combined). We found that, after learning, odor identity could be predicted with high accuracy during the odor delivery period for both dCA1 and vCA1. During the trace period, individual trial types remained discriminable, although classification accuracy was lower in both regions compared to the odor delivery period, with classifier errors predominantly occurring between trial types with the same outcome (for example, CS1+ versus CS2+). Thus, after learning, trace period activity is highly discriminable between trial-type categories (CS+ versus CS−) but less so within each category.
The reduced decoding accuracy between CS1+ and CS2+ trials during the trace period suggests a common signal across these trial types. To more directly test this, we trained a linear classifier to discriminate activity between a reward-predictive trial type (for example, CS1+) versus a non-predictive trial type (for example, CS3−) and then tested classification accuracy using data from the complementary trial types (CS2+ and CS4−), which the decoder had never seen (‘outcome decoding’; Fig. 5g). Here, high decoding accuracy would indicate similar neural states across related trial types (for example, CS1+ and CS2+).
Such outcome decoding was no better than chance for either task period before learning (Fig. 5h). After learning, however, we found high outcome decoding accuracy during the trace period in both dCA1 and vCA1 (Fig. 5h), further indicating that there exists a representation related to reward expectancy that is independent of the identity of the cue that precedes it. Outcome decoding accuracy during the odor period was also high for vCA1, indicating that, in addition to encoding cue identity during this period, vCA1 populations simultaneously represent the predicted outcome associated with those cues. Together, these data suggest that neural representations transition from encoding cue identity to outcome expectation in dCA1, whereas, in vCA1, expected outcome is represented throughout the entire trial and is multiplexed with information about specific cue identity during odor exposure. This was further corroborated by examining the similarity of population activity patterns that were present during trial epochs (cue, trace and outcome periods). Here, we found evidence of a common representation across all three reward trial epochs in vCA1 but not in dCA1 (Fig. 5i and Extended Data Fig. 8g,h for data from Post session 4 days after Late session). Finally, dimensionality reduction analysis returned results that were analogous with the decoding results above (Fig. 5j).
Aversive conditioning and reversal learning
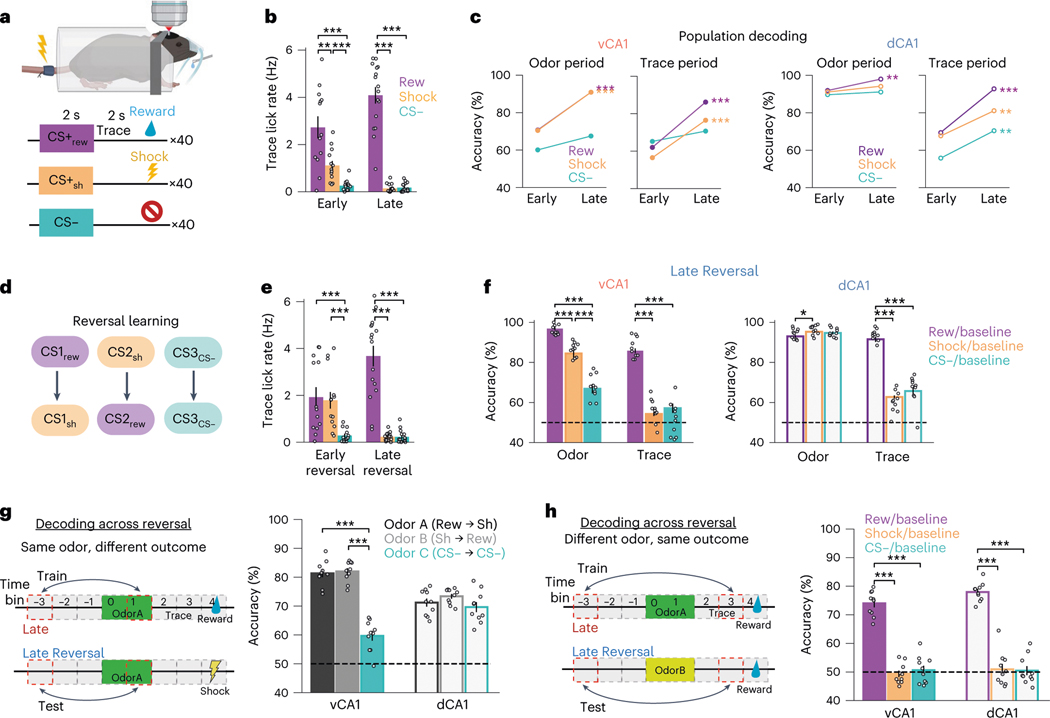
We next examined whether the neural changes associated with appetitive learning are also present during aversive (shock) conditioning. For this, we trained mice in an associative learning task with three novel CS odors (Fig. 6a) that were paired with either sucrose (CS+rew), tail shock (CS+sh) or nothing (CS−).
Fig. 6 |. Aversive conditioning and reversal learning.
a, Task schematic. Three odors predicting sucrose reward (CS+rew), inescapable tail shock (CS+sh) or nothing. b, Mean trace period lick rates (n = 13: 10 vCA1, 3 dCA1 mice; two-sided Mann–Whitney -test with Bonferroni correction; error bars indicate mean ± s.e.m.). c, Comparison of trial-type decoding accuracy for Early and Late sessions (n = 10 decoding iterations using -matched 444 cells; two-sided Fisher’s exact test). Statistics comparisons reflect Early versus Late decoding accuracies (±s.e.m., Mann–Whitney -test). See Extended Data Fig. 9 for confusion matrices. Odor period changes mirrored those of the two-odor task, showing increased decoding accuracy for odors with learned value. Interestingly, trace period analysis showed that decoding accuracy was lower for CS+sh trials compared to CS+rew. d, Reversal learning schematic. The identity of odors predicting sucrose and shock was swapped, whereas CS− odor remained the same. e, Mean trace lick rates across all animals (n = 13 mice: 10 vCA1, 3 dCA1; two-sided Mann–Whitney -test with Bonferroni correction; error bars indicate mean ± s.e.m.). f, Within-session decoding accuracies for each trial type versus baseline during odor (left) or trace (right) periods (n = 10 decoding iterations using -matched 444 cells; two-sided Mann–Whitney -test with Bonferroni correction; error bars indicate mean ± s.e.m.). Note the near absence of decoding accuracy above chance during the trace period for CS+sh trials. g, Left: schematic showing cross-session odor versus baseline decoding for a specific odor paired with different outcomes. Right: Cross-session decoding accuracies indicate that an odor’s representation is conserved even when the outcome associated with the odor changes (n = 10 decoding iterations using -matched 281 cells; two-sided Mann–Whitney -test with Bonferroni correction; error bars indicate mean ± s.e.m.). h, Decoding during outcome anticipation (trace period) for a specific outcome preceded by different odors. Reward-anticipation-like signals are conserved across different predictive cues, whereas shock anticipatory coding, which is only weakly present in Late Reversal (f), is not (n = 10 decoding iterations using -matched 281 cells; two-sided Mann–Whitney -test with Bonferroni correction; error bars indicate mean ± s.e.m.). *P < 0.05, **P < 0.01, ***P < 0.001. See Supplementary Table 1 for all statistical analysis details.
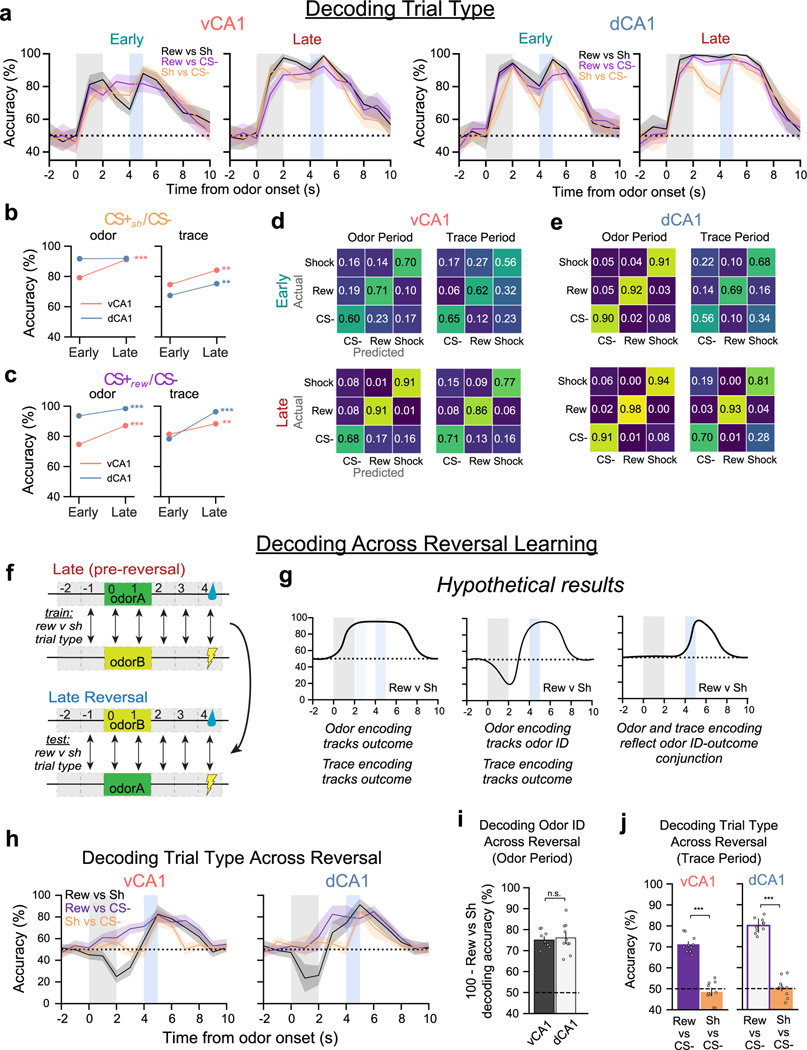
Analysis of the odor period vCA1 neural data revealed that CS+sh results were qualitatively similar to those for the CS+rew condition, with both trial types showing an increase in odor encoding with learning. (Fig. 6c and Extended Data Fig. 9a–e). Of note, however, was a difference in trace-period decoding accuracy; although decoding accuracy increased with learning in shock trials for both vCA1 and dCA1, it was significantly lower compared to reward trials (Fig. 6c).
Once CS+rew and CS+sh pairings were well learned, we reversed the contingencies, where the previously rewarded odor was now paired with shock and vice versa (Fig. 6d). This allowed us to further examine the nature of information being encoded during odor and trace periods—specifically, whether odor representations are independent of the outcome they predict and whether trace period representations for a particular outcome are independent of the odor cue that precedes it. After initial learning (Late session), animals were trained on reversed contingencies until anticipatory licks were observed only during the CS+rew trial (Late Reversal session) (Fig. 6e). Using neurons tracked across Late and Late Reversal, we first asked whether odor representations were dissociable from specific paired outcomes. We approached this using two methods: (1) training a classifier to discriminate odor period activity from ITI baseline activity during the final session before reversal (Late) and testing odor/ITI classification accuracy on data after the reversed contingencies had been learned (Late Reversal; Fig. 6g); and (2) training a linear classifier to discriminate reward and shock trials during Late and testing classification accuracy using Late Reversal data (Extended Data Fig. 9f–i). In vCA1 and dCA1, both methods indicated that the neural representation for a specific odor remained intact regardless of whether the odor predicted sucrose or shock.
Next, we assessed whether outcome expectation signals during the trace period remained stable after reversal learning. For this, we performed the same analysis as above but using trace period data. In both dCA1 and vCA1, the cross-session decoders performed well when decoding reward anticipation signals across reversal (Fig. 6h and Extended Data Fig. 9j). These results mirrored our four-odor results and suggest that the CA1 encodes a signal related to reward anticipation that is independent of the odor that precedes it. Surprisingly, there was not a conserved representation across reversal learning when anticipating shock (Fig. 6h and Extended Data Fig. 9j). Additional analyses revealed this was due to the absence of trace-period anticipatory shock encoding during Late Reversal (Fig. 6f). Together, these results indicate that odor representations in both dCA1 and vCA1 are independent of the nature of the associated US and that stable signals preceding reward, but not shock, emerge with learning in these regions.
Instrumental control and task representations in CA1
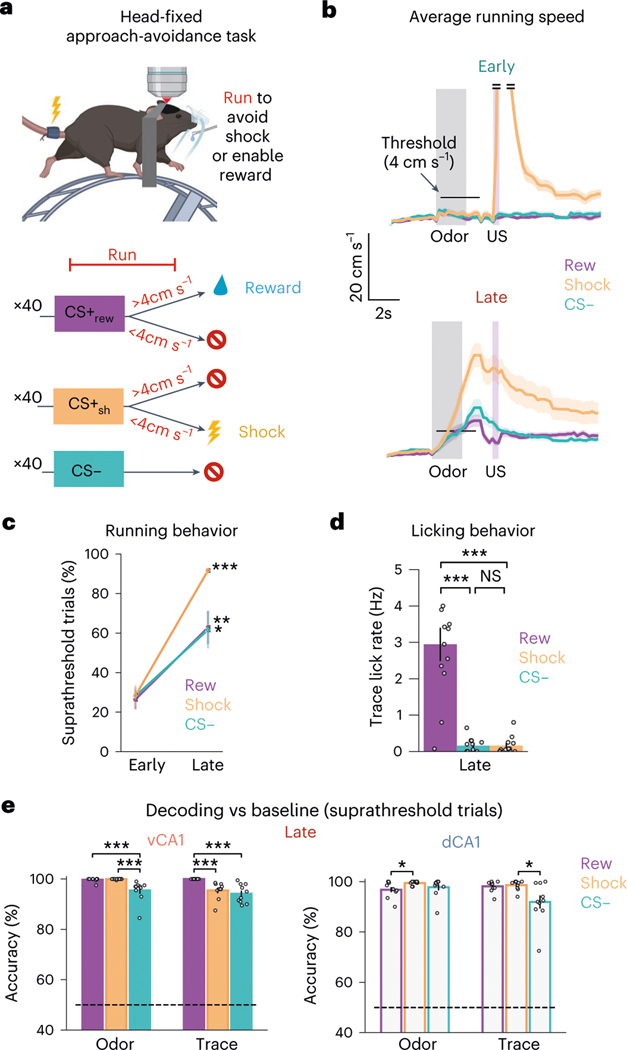
Why was pre-reward signaling so strong in dCA1 and vCA1, whereas pre-shock was not? A potential cause, we reasoned, may be the difference in the behavioral relevance of these outcomes: whereas reward trials required an operant response (licking), shock delivery was inescapable and, therefore, behaviorally irrelevant. We thus developed a head-fixed approach-avoidance task (Fig. 7a). Here, mice head-fixed on a running wheel were exposed to the three-odor task but could now run (>4 cm s−1) during the odor and trace periods to either escape shock or enable reward delivery, depending on the odor presented. Notably, both shock escape and reward delivery required the same operant response.
Fig. 7 |. Instrumental control of outcomes increases task-related representations in associative learning.
a, To assess whether the behaviorally irrelevant nature of the inescapable shock contributed to the decoding accuracy differences observed for CS+sh and CS+rew (Fig. 6), we implemented a new task: head-fixed approach-avoidance. Mice running on a wheel could escape shock delivery or enable sucrose delivery if running velocity reached ≥4 cm s−1 during the odor and trace periods. b, Mean task running velocity across all animals for each trial type (n = 12 mice: 8 vCA1, 4 dCA1; line indicates mean; shading indicates ±s d ). c, The percentage of trials with suprathreshold running significantly increased for all trial types from Early to Late sessions (n = 12 mice: 8 vCA1, 4 dCA1; two-sided Mann–Whitney -test; error bars indicate mean ± s.e.m.). d, Mean trace lick rates across all animals (n = 12 mice: 8 vCA1, 4 dCA1; two-sided Mann–Whitney -test with Bonferroni correction; error bars indicate mean ± s.e.m.). e, With the shock outcome behaviorally relevant, CS+sh trials can now be decoded from baseline activity with high accuracy during the trace period (n = 10 decoding iterations using -matched 340 cells; two-sided Mann–Whitney -test; error bars indicate mean ± s.e.m.). Subthreshold running trials were excluded from analysis. *P < 0.05, **P < 0.01, ***P < 0.001. See Supplementary Table 1 for all statistical analysis details. NS, not significant.
Mice learned to escape shock and enable reward delivery over the course of ~5 days (Fig. 7b–d and Extended Data Fig. 10a,b), at which time we imaged neural activity. To minimize variability across trials and trial types, we only analyzed trials where animals displayed suprathreshold running (for example, avoided shock or earned sucrose reward). As opposed to the original three-odor task with inescapable shocks, we now were able to decode trace period activity from baseline with very high accuracy for shock trials (Extended Data Fig. 9e). Moreover, suprathreshold shock and reward trials could also be discriminated with high accuracy (Extended Data Fig. 10c,d), indicating that the shared operant response (running) was not driving these results. Interestingly, CS− trace period activity could be well discriminated from reward trials but less so shock trials. Because mice routinely ran above threshold during CS− trials (Fig. 7b and Extended Data Fig. 10b), it is possible that animals had not fully learned the task structure and/or interpreted the CS− odor as a potential cue for shock.
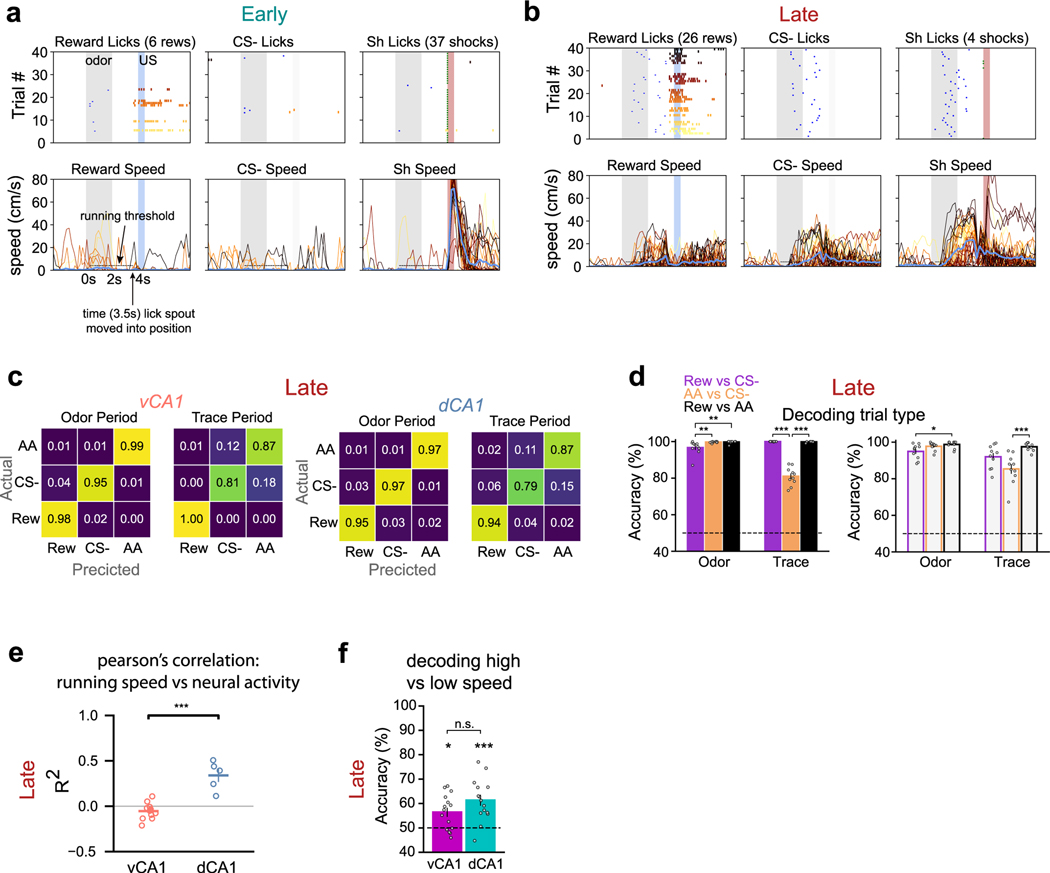
Finally, given recent reports describing the widespread influence of movement on neural activity16,17, we further probed whether running behavior may have contributed to our results. Our analyses suggest that running can influence hippocampal activity, specifically in dCA1 (Extended Data Fig. 10e). However, even in dCA1, high-speed versus low-speed running epochs during the ITI could be only weakly discriminated from one another (Extended Data Fig. 10f), suggesting that our main findings are driven by task properties and not running, per se, and that making an outcome behaviorally relevant may boost engagement of the HPC.
Discussion
Before cue–outcome associative learning, we found that dCA1 strongly encodes the identity of individual odors, in line with previous findings showing that environmental stimuli need not be paired with reward or other salient outcomes to be represented in dCA1 (refs. 7,18). In contrast, vCA1 was less reactive to odors before training, and decoding of odor identity using population activity was inferior to that of dCA1. Instead, odor decoding was heavily influenced by salience, increasing for odors predictive of salient outcomes (for example, reward or shock) and decreasing in the absence of these outcomes (for example, extinction). Such salience processing in vCA1 may be important for conveying stimulus value information to the frontal cortex19–21; passing information to emotional centers, such as the amygdala, for further processing22–24; or alerting downstream regions mediating approach-avoidance behaviors25. Although the accuracy of odor decoding in dCA1 was not influenced by salience, at the single-cell level we found an increase in CS+ odor-responsive cells after learning. These data extend previous findings showing the dorsal and intermediate HPC intensify activity for stimuli and locations with learned significance26,27.
After learning, odor representations remained relatively stable across sessions, including across extinction training, across 3 days devoid of additional training, or when the valence of the paired outcome was switched, indicating that CA1 is a storage site for stimuli with learned relevance. Of note, however, across-session decoding was appreciably lower than within-session decoding. This would suggest that the level of representational drift between sessions is greater than that observed within a session28, similar to what has been reported for CA1 spatial codes29–33. However, we also found that, once the task is learned, the representation is stabilized, providing support for a stable hippocampal code after learning and in familiar environments34.
Specifically, what information is being encoded during odor presentation? Our results point to odor identity as a prominent representation in both dCA1 and vCA1 during this time. This is well supported by two main findings: (1) two odors with the same outcome can be discriminated from one another with high accuracy, and (2) the odor period representation remains stable when the odor’s associated outcome is altered (that is, after reversal learning). In addition to odor identity representations, our ‘outcome decoding’ analysis revealed that neuronal populations in vCA1 also multiplex information about the outcome associated with an odor. Consequently, a downstream recipient of these signals could decode not only whether reward is forthcoming but, at the same time, the identity of the cue that precedes it, which may be important for updating cue value. Alternatively, it is possible that outcome and cue identity signals are each routed to distinct downstream targets35, consistent with vCA1 circuitry, where specialized functions may be parsed across vCA1 projection pathways13,14,24,36–38.
In vCA1, we also found that a representation of outcome was present not only during odor delivery but throughout the entire trial duration (Fig. 5i and Extended Data Fig. 8f), analogous to spatial representations in vCA1 that generalize across large swaths of space39. Thus, the broad firing observed in vCA1 during spatial exploration may reflect a more general property of this region that extends beyond representations of physical space. Representations stretching across cue, trace and US periods may serve to link discontinuous cue–reward events, providing a neural substrate through which credit can be assigned to the stimuli or actions that preceded reward delivery40,41. Alternatively, this signal may serve to ‘locate’ the animal within the task space10, such as the task context currently being occupied (that is, reward trial) and broadcast this information to downstream regions, such as the frontal cortex, to retrieve context-relevant memories and guide behavior11,19,42.
In contrast to learning-related changes to cue representations that differed across hippocampal regions, neural transformations during the trace period were remarkably similar across dorsal and ventral CA1. Here, both regions displayed robust increases in hippocampal recruitment and encoding of anticipated behaviorally relevant outcomes with learning. Changes in reward-related activation with learning have been well documented in HPC. In dCA1, neuronal activity has been shown to be modulated in rewarded tasks through various means, including accumulation of place fields at rewarded locations43–47 and, in tasks where goal location is dissociated from reward, an increase in out-of-field firing at the goal48,49. Furthermore, dedicated populations of goal-approach cells have been identified across the DV axis12,13,26,50,51. Our results extend these findings beyond the spatial domain and show that ventral CA1 also contains a dedicated signal during outcome anticipation that generalizes across predictive cues, is stable across days, and may be contingent on the behavioral relevance of the outcome.
In light of the strong pre-reward signal observed with our appetitive conditioning tasks, we were surprised that anticipation of inescapable shock was only weakly encoded by both dCA1 and vCA1, despite robust activation of both regions in response to cue and shock deliveries. Notably, shock anticipation signals were further diminished with subsequent training (from Late to Late Reversal sessions), eventually becoming indistinguishable from ITI activity. Although previous reports examining anticipation of aversive stimuli are mixed for dCA1 (refs. 1,52,53), this finding is particularly surprising for vCA1, which is known to mediate anxiety and trace fear conditioning36,54,55. As the HPC is hypothesized to form a cognitive map of behaviorally relevant relationships 56,57, we reasoned that a potential cause may be the lack of behavioral relevance of the inescapable shock. Indeed, when mice were able to avoid shock via instrumental response, ‘shock anticipation’ was strongly encoded in both dCA1 and vCA1. Whether the threat of shock (aversive) or anticipation of escape (potentially rewarding) best reflects animals’ internal state during the trace period is uncertain, but it should be noted that the neural activity of sucrose and shock trials could be well discriminated from one another during this time.
Our results show vast reorganization of hippocampal activity networks during associative learning. Unknown, however, are the mechanisms responsible for implementing this change. Dopaminergic, cholinergic, serotonergic and adrenergic signals are all present to varying degrees across the DV axis of the hippocampus58, and each is integral for hippocampal plasticity and learning45,58–61. Locus coeruleus signaling, for one, mediates reward-dependent reorganization of place fields45 and may analogously promote changes in CS+ representations by integrating stimulus identity signals with reward-induced release of neuromodulators.
In addition to modulatory inputs, the HPC receives information from a multitude of extra-hippocampal areas that may further shape CA1 network activity. The orbitofrontal cortex is postulated to provide the HPC with information about expected outcomes19 and may contribute to the reward-anticipation signals seen here. Input from the medial thalamus and/or amygdala to vCA1 (ref. 62) could provide additional information regarding the learned salience or valence of stimuli22. Additionally, we recently showed that odor representations in the lateral entorhinal cortex become more separable with learning63 and may, thus, influence changing odor representations in CA1 across training.
Intra-hippocampal signaling may also contribute to changes seen here. Although recurrent connectivity in CA1 is sparse64, learning is known to augment recurrent interactions in the brain65, which can amplify inputs and induce attractor networks66, developments that could mediate the separation of odor representations that we observed in vCA1. Additionally, inhibitory and astrocytic signaling may contribute to these changes67,68.
Recent work has highlighted functional differences that correlate with neurons’ anatomical location within the CA1 network. For example, neural populations residing in superficial versus deep locations of CA1 display unique physiological properties and may also be preferentially tuned to distinct aspects of learning and environmental encoding43,69. Future studies examining layer-specific differences in the representations reported here will be of considerable interest.
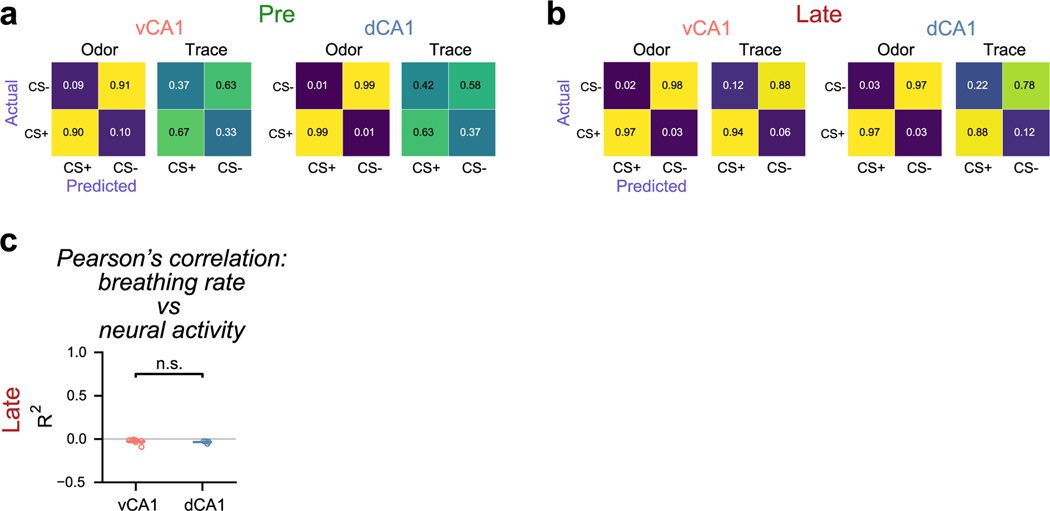
Finally, although previous reports have shown a positive relationship between movement and neural activity for a variety of ‘non-motor’ brain regions16,17, we found mostly weak correlations between neural activity and licking, breathing (Extended Data Fig. 7c) or running behaviors in dCA1 and vCA1. Future studies can further elucidate how ongoing or task-evoked behaviors, such as postural adjustments, paw movement beyond running or orofacial movements beyond licking or breathing, impact hippocampal activity.
Here we have shown that dCA1 and vCA1 are largely attuned to different aspects of the world. In simplest terms, the HPC might, thus, be thought of as undergoing a shift from externally biased to internally biased encoding of environmental variables along the DV axis. Such a division of labor could facilitate learning9,40 and support the creation of a rich internal model that not only charts relationships in the world (dHPC) but also imbues certain relationships with meaning and emphasizes relevant stimuli (vHPC)9,70. Moreover, this simplified model is consistent with hippocampal lesion studies, where dHPC damage disproportionally affects declarative memory, and vHPC dysfunction is more closely associated with a failure to properly assign/update value, such as in post-traumatic stress disorder, addiction and depression3,4.
On the other hand, we also saw a clear overlap in how some task variables are represented in dCA1 and vCA1. Why might these functionally distinct regions encode information that is seemingly redundant? As efferent connectivity patterns of dCA1 and vCA1 differ considerably4,62, it is likely that each region is broadcasting this information to distinct downstream targets. When dCA1 and vCA1 outputs do converge onto the same region, these inputs may be handled differently, as appears to be the case with the nucleus accumbens in reward learning71. Therefore, redundancy of representations across dorsal and ventral CA1 may be processed distinctly and uniquely influence ongoing operations. An interesting question for future inquiry is whether dCA1 and vCA1 inherit these overlapping representations from common or separate input source(s) or perhaps inform one another.
Online content
Any methods, additional references, Nature Portfolio reporting summaries, source data, extended data, supplementary information, acknowledgements, peer review information; details of author contributions and competing interests; and statements of data and code availability are available at https://doi.org/10.1038/s41593-023-01296-6.
Methods
Mice
All procedures were conducted in accordance with the National Institutes of Health Guide for the Care and Use of Laboratory Animals and approved by the Institutional Animal Care and Use Committee at the University of California, San Francisco. Adult male and female C57BL/6J mice were supplied by Jackson Laboratory. Mice were co-housed with littermates (2–5 per cage) in a temperature-controlled (22–24 °C) and humidity-controlled (40–60%) environment on a 12-hour light/dark cycle, with experiments performed during the light phase. All mice were randomly assigned to experimental conditions. Data collection and analysis were not performed blinded to the conditions of the experiments.
Surgery
Animals were 11–15 weeks old at the time of surgery. Mice were anesthetized with 1 5% isoflurane with an O2 flow rate of 1 L min−1 and head-fixed in a stereotactic frame (David Kopf). Eyes were lubricated with an ophthalmic ointment, and body temperature was maintained at 37 °C with a warm water recirculator (Stryker). The fur was shaved and incision site sterilized before beginning surgical procedures. Lidocaine, meloxicam and slow-release buprenorphine were provided for analgesia.
GCaMP6f (two-odor and three-odor experiments) or GCaMP8m (four-odor and approach-avoidance experiments) virus injection and GRIN lens implantation were conducted using methods previously described14. Mice were randomly assigned to dCA1 or vCA1 implant location groups. In brief, a craniotomy was made over the lens implantation site, and dura was removed from the brain surface and cleaned with sterile saline and absorptive spears (Fine Science Tools). A nanoject syringe (Drummond Scientific) was used to deliver GCaMP6f to vCA1 or dCA1 (left hemisphere for both). vCA1 coordinates were −3.16 A/P and −3.25 M/L. Then, 150 nl of virus was injected at each depth of −3.85, −3.55 and −3.3 (450 nl total volume) with respect to bottom of skull at the medial edge of the craniotomy. dCA1 coordinates were −2 A/P, −1.65 M/L and −2.1 A/P, −1.45 M/L at depths −1.5, −1.25 D/V with respect to bregma. The needle was held in place for >5 minutes before moving to the next D/V coordinate and remained in place for 10 minutes after the final injection before slowly removing from the brain. AAV1-SYN-GCaMP6f-WPRE-Sv40 (titer: 1.97 × 10¹³) was supplied from the University of Pennsylvania viral vector core and diluted 1:3 in 1× sterile PBS before injections. AAV1-SYN-jGCaMP8m-WPRE (titer: 2.4 × 10¹³) was supplied from Addgene and diluted 1:3 in 1× sterile PBS before injections. For dCA1, before virus injection the overlying cortex was slowly aspirated until axonal fibers of the external capsule/alveus were visualized. After virus injection, a 0.6-mm (vCA1) or 1.0-mm (dCA1) diameter GRIN lens (Inscopix) was slowly lowered in 0 1-mm D/V steps and then fixed to the skull with Metabond adhesive cement (Parkell). vCA1 lens coordinates were −3.16 A/P, −3.5 M/L and −3.5 D/V (from bottom of skull at craniotomy; Extended Data Fig. 1a). dCA1 lens coordinates were −2.05 A/P, −1.5 M/L, −0.95 D/V (from bregma; Extended Data Fig. 1b). A custom-made titanium headbar was then attached to the skull using dental cement (Dentsply Sinora). A baseplate and cover (Inscopix) were also cemented on to protect the lens.
Verification of imaging sites and histological analysis
Dorsal and ventral CA1 imaging sites were verified in each animal included in final analysis (Extended Data Fig. 1). After all imaging sessions were completed, mice were injected with a lethal dose 2:1 ketamine–xylazine solution intraperitoneally. While the heart was still beating, mice were perfused transcardially using 4% paraformaldehyde (PFA) solution. Brains were extracted and placed in 4% PFA solution for 2–3 days to allow further fixation. After saturating with a 30% sucrose solution, coronal slices of 50-μm width were collected using a Leica SM2000 microtome. Slices were collected in 1× PBS solution and mounted onto glass slides and coverslipped with Fluoromount-G with DAPI (Southern Biotech). Two mice were removed from the study owing to incorrect implant location.
Behavioral training
Four-to-six weeks after surgery, animals were handled and habituated to the experimenter, training environment and head fixation for 1 week. After habituation, animals were water restricted to ~85–90% ad libitum weight and underwent a 2–3-day pre-training period designed to introduce the liquid delivery apparatus, with free water rewards (~2 μl each) intermittently delivered upon licking (up to 80 rewards in a 20-minute session). Sucrose rewards (10% sucrose, 0.03% NaCl in water) were delivered via a solenoid-gated gravity feed. Contact with a lick spout positioned in front of the mouth was measured using a capacitive touch MPR121 sensor (SparkFun). Stimulus delivery and sensor reading was controlled by an Arduino Mega with custom circuit boards (adapted from http://openmaze.org/) and recorded via CoolTerm software. Once animals displayed consistent and motivated licking (80 rewards collected in a single session), lick training was complete, and the pre-training odor exposure session was initiated the next day. Throughout training, animals were water restricted to ~85–90% ad libitum weight. All training paradigms consisted of one training session per day, occurring at roughly the same time each day. Learning of the discrimination tasks was assessed using lick discriminability () for each session, which compares the rate of anticipatory licks during the trace period of CS+ trials with CS− trials:
Learning was determined as a score > 1.5 for a session, with all Late session mice meeting this criterion.
Pre-training odor exposure.
One day before conditioning, animals underwent a single session where they were passively exposed to neutral odors that would subsequently serve as CS+ and CS− odors during training. Each session consisted of 15 trials of each odor, consisting of 2-second odor presentations. There was no lick spout present during these sessions. The ITI between subsequent odor deliveries was chosen as a random sample from a uniform distribution between 17.5 seconds and 27 seconds. Odors were delivered via a custom-made olfactometer equipped with a mass flow controller (Alicat Scientific) that maintained air flow at 2 L min−1 and prevented momentary pressure changes from solenoid valve switches (Clippard) upstream of the controller. Odors were delivered to mice via a customized nose cone, which contained an outlet where a gentle vacuum was applied to evacuate residual odor. Additionally, an ongoing charcoal filter vacuum system (Hydrobuilder) was used to evacuate any residual odors.
Two-odor paradigm.
Each associative learning session consisted of 120 trials (60 CS+ and 60 CS−, pseudo-randomly presented). Two neutral odors served as CS+ and CS− cues (benzaldehyde or eugenol, 2 seconds) with cue contingencies counterbalanced across mice. Presentation of the CS+ cue was followed by a 2-second trace period and subsequent reward delivery (~2 μl). No reward was available after the presentation of the CS− cue. Animals were not punished for off-target licking. The ITI between subsequent cues was chosen as a random sample from a uniform distribution between 17.5 seconds and 27 seconds.
This task structure was administered over a period of ~7 days, in which day 1 and day 4 were termed ‘Early’ and ‘Late’ learning, respectively. If an animal did not meet the learning criterion () on day 4 (n = 3 animals), training continued until this criterion was met. Following the Late session, two days of extinction sessions, labeled as ‘Ext1’ and ‘Ext2’, were given where the odor–reward association was extinguished by removing the sucrose reward for CS+ trials (the lick spout remained in place). Ext2 was followed by a 1-day reacquisition session, labeled as ‘Reacquisition’, in which the sucrose reward was reintroduced for CS+ trials. A total of 11 vCA1 and five dCA1 animals were included in the dataset.
Three-odor paradigm.
After completion of two-odor training, mice underwent three-odor conditioning. Each session consisted of 120 trials (40 CS+rew, 40 CS+shock and 40 CS−, pseudo-randomly presented). Three new neutral odors served as cues (ortho-toluidine, 2-heptanone or +carvone, 2 seconds). Presentation of the CS+cue was followed by a 2-second trace period and subsequent delivery of US (reward US = ~2 μl 10% sucrose solution; shock US = 0 125 mA amplitude, 250-ms duration). No US was presented after the presentation of the CS− cue. Animals were not punished for off-target licking. For reversal learning, CS+ reward and CS+ shock odor cues were switched, whereas the CS− odor remained the same. Shocks were delivered via a custom-made tail cuff driven by a precision animal shocker (Coulbourn Instruments). The ITI between subsequent cues was chosen as a random sample from a uniform distribution between 17.5 seconds and 27 seconds. A total of 11 vCA1 and three dCA1 animals were included in the dataset.
Three-odor approach-avoidance paradigm. After four-odor training, mice were habituated to head-fixed running on a 13-cm-diameter wheel for ~20 minutes per day. Rotational speed was tracked using a rotary encoder (Yumo Electric, E6A2) and assessed every 200 ms. After 5–7 days of running wheel habituation, training began. Three new neutral odors (ortho-toluidine, 2-heptanone and +carvone) were used for this experiment. Each trial type (CS+ reward, CS+ shock and CS−) was presented 40 times per session and were pseudo-randomly interleaved. After ITI time elapse, animals were required to cease running for ≥0 6 seconds before a trial could begin. Throughout training, a 4-cm s−1 running speed threshold was used. Animals that displayed running speeds above this value at any point 0–3 4 seconds after the onset of odor delivery would trigger reward delivery for CS+ reward trials or cancel tail shock for CS+ shock trials. For this experiment, a lick spout remained out of reach of the animal and was rotated into place at 3.4 seconds after odor onset only on trials where animals exhibited suprathreshold speed at any point 0–3 4 seconds after the onset of odor delivery. Rotation of spout into place took ~150 ms. The lick spout was rotated into place if suprathreshold running was exhibited regardless of the trial type during which running occurred (for example, spout was still rotated into place for suprathreshold shock and CS− trials, but no reward was delivered). This was in an effort to keep all trial types as similar as possible. The lick spout was subsequently rotated back to home position at 8 seconds after odor onset. Animals were not punished for off-target licking or running, nor was subthreshold running punished for reward or CS− trials. The ITI between subsequent cues was chosen as a random sample from a uniform distribution between 17 seconds and 23 seconds. A total of eight vCA1 and four dCA1 animals were included in the dataset.
Four-odor paradigm.
A new cohort of animals without any previous discrimination training underwent four-odor conditioning. Each session consisted of 120 trials (30 of each trial type, pseudo-randomly presented). Four neutral odors served as cues (methylbutyrate, isoamyl acetate, eugenol and eucalyptol). Presentation of the CS+ cue was followed by a 2-second trace period and subsequent delivery of 10% sucrose solution (~2 μl). No US was presented after the presentation of the CS− cue. Animals were not punished for off-target licking. The ITI between subsequent cues was chosen as a random sample from a uniform distribution between 17 seconds and 23 seconds. A total of eight vCA1 and five dCA1 animals were included in the dataset.
Two-photon imaging
Genetically encoded calcium imaging of GCaMP6f or GCaMP6f8m was used to assess the functional activity of individual neurons. Images were captured using an Ultima IV laser scanning microscope (Bruker Nano, acquired with Prairie View 5.4) equipped with resonant scanning mirrors and high-speed scan electronic controller, dual GaAsP PMTs (Hamamatsu, 7422PA-40) and motorized focus (100-nm step size). GCaMP signal was filtered through an ET-GFP (FITC/CY2) filter set. Laser signal was provided by a MaiTai DeepSee mode-locked Ti:Sapphire laser source (Spectra-Physics) providing >150-kW maximum output at 920 nm. Acquisition speed was 30 Hz for 512 × 512-pixel images. Images were averaged both online and offline, yielding a final frame rate of 3.75 Hz.
Before each conditioning session, the imaging field of view (FOV) was determined, and imaging was conducted at that FOV for the entire session. For animals with multiple FOVs across sessions, each FOV was separated by >60 μm in the dimension (DV) to ensure no overlap of cells across different FOVs. To facilitate re-identification of a specific FOV across sessions, the top of the GRIN lens served as a reference plane. Optimal laser power was determined for each FOV based on GCaMP expression level and was kept constant across sessions for a specific FOV. For each trial, imaging began 8 seconds before cue onset and was terminated 11 seconds afterward (19 seconds total).
Signal extraction and cross-session registration
Videos were motion corrected offline using non-rigid motion correction based on template matching (NoRMCorre72 or Suite2p73). Cell segmentation and calcium transient time series data were extracted using constrained non-negative matrix factorization for microendoscopic data (CNMFe), a semi-automated algorithm optimized for GRIN lens Ca2+ imaging to denoise, deconvolve and demix calcium imaging data74. Putative neurons were manually inspected for appropriate spatial properties and Ca2+ dynamics and were visually checked against the corresponding motion-corrected video in ImageJ. Ca2+ transient events were extracted using the OASIS algorithm75 embedded within CNMFe. We used these inferred calcium events for all analyses, unless otherwise noted. Denoising (CNMFe) and deconvolution (OASIS) steps were applied identically to vCA1 and dCA1.
Registration of cells across sessions imaged at the same FOV used probabilistic modeling of similarities between cell pairs across sessions (CellReg76). In brief, spatial footprint maps were generated for each session by projecting the spatial filter of each cell onto a single image. Spatial footprint images from sessions imaged at the same FOV were then aligned. The distribution of similarities between pairs of neighboring cells were subsequently modeled via centroid distance to obtain an estimation for their probability of being the same cell (). Cells were then registered across sessions via a clustering procedure that uses the previously obtained probabilities, with a probability threshold of 0 8. The average value for registered cells was 0 95. All putative matches were visually inspected. There was no difference across regions for the proportion of cells registered (mean ± s d : dCA1: 0 46 ± 0 13; vCA1: 0 49 ± 0 14; -test, P = 0 4).
Data analysis
For statistical analyses and figures, calcium event activity was separated into 1-second bins, and average activity during each bin was used. When reporting specific epochs of task results, ‘odor period’ constituted the final 1-second bin of odor delivery (1 second to 2 seconds after odor onset), whereas ‘trace period’ constituted the final 1-second bin of the trace period before reward delivery (1 second to 2 seconds after odor offset), unless otherwise noted. These time bins were chosen to ensure that odor was being experienced throughout the entire odor bin and to minimize any residual odor effects during trace period analysis. All statistical analyses were two-sided. Data normality was confirmed by applying a fitted normal to each dataset and assessing goodness of fit, unless otherwise noted. No statistical methods were used to pre-determine sample sizes, but our sample sizes are similar to those reported in previous publications2,63. For all figures: *P < 0.05, **P < 0.01, ***P < 0.001. See Supplementary Table 1 for all statistical analysis details.
Population decoding.
A linear decoder was used to discriminate activity patterns into two discrete categories77:
where is the predicted label of the population activity pattern recorded at time and takes two values corresponding to two classes of patterns to decode (for example, two odor identities); is the vector of weights assigned to each cell; and is a bias term constant. Decoding parameters were attained via a supervised learning protocol with labeled data and used a support vector machine (SVM) with a linear kernel (python/scikit/linearSVC). Results are reported as the generalized performance of the decoder using cross-validation—a standard machine learning procedure to avoid data overfitting. When multiple categories were involved (for example, more than two trial types), multiple linear decoders were trained on pairs of discrete categories combined using majority-based error-correction codes.
We defined the patterns of calcium activity by computing the mean event rates for each individual cell during 1-second time bins. Pseudo-population recordings were generated by combining cell data across multiple animals/FOVs. For decoding, one-half of trials were randomly selected from each class, and pseudo-population activity from these trials was used to train the decoder, whereas the remaining held-out half was used to evaluate the decoder’s generalization performance. When comparing decoding accuracy between neural populations of different size, we trained our decoder on a random subsample of cells from the more numerous population equal to that of the smaller population. We repeated the operation 100 times and then combined the cross-validated decoding accuracies of all random choices together to get a single sample of decoding accuracies (that is, single data point reflecting the mean of all 100 iterations). We repeated the procedure ten times to perform statistical comparisons across groups and against chance performance. A two-sided Mann–Whitney -test was used to compare decoding accuracies between groups, and Bonferroni correction was used for multiple comparisons.
For decoding against baseline, we used population activity during the 1-second time bin that began 3 seconds before CS onset as baseline data. Cross-time-bin and cross-session decoding followed the same procedure as within-session decoding. In the case of cross-session decoding, only cells registered across the compared sessions were included.
In all decoding line plots (for example, Fig. 1g), each data point represents the decoding accuracy for the 1-second time bin ending at that point. For example, a data point at 2 seconds after odor onset represents decoding accuracy using activity extracted from 1–2 seconds after odor onset.
For decoder weights analysis, we used the weight assigned to individual cells by the decoder after fitting the model to the data. Similarly to previous findings2, we found a strong correlation between decoder weight and cell activity. To minimize the effect of activity, we regressed out the components explained by activity. For this, for each time bin we linearly regressed the mean total activity for each cell versus the decoder weight assigned for that cell. We used the residuals from this analysis for comparisons of decoder weights across sessions.
MDS.
We performed two-dimendional MDS scaling of event data using python/scikit/MDS. We used all cells recorded from a particular region (for example, vCA1) across all mice to produce one pseudo-population. For each trial type, 100 trials were randomly selected for analysis, and MDS was performed. The Euclidean distance was taken between each trial type, and this process was repeated 10 times. Bar charts of Euclidean distance show the mean ± s.d. of all runs.
Pattern similarity.
To compute pattern similarities56, we computed mean event rates during each time bin. We then computed the mean cosine similarities (Pearson correlation) between every pair of patterns as:
where and are the patterns of population activities for trial/time bin and , and N is the total number of pairs of patterns counted once.
Single-cell responsivity.
Data used for heat maps of calcium traces or inferred events were not binned. For each cell, -scores were computed over the entire dataset for a specific condition (for example, CS+ trials). To identify cells whose activity was modulated during specific epochs (for example, CS+ period and trace period), for each trial containing the specified epoch the average event magnitude during the 1-second epoch was compared to the average event magnitude during a 1-second baseline period immediately before cue onset for that trial. values were determined using a two-tailed Mann–Whitney -test, and the false discovery rate was applied to correct for multiple comparisons. Cells with an adjusted P < 0.05 were classified as responsive. Fisher’s exact test was used to compare whether the proportion of selective cells for a specific epoch (for example, CS+ Early versus CS+ Late) significantly differed (P < 0.05).
Across-session overlaps in single-cell responsivity.
To compute overlapping responses, we determined the number of cells that showed statistically significant responses for a specific task epoch (cue, trace). To assess statistical significance, we pooled cells from all mice to generate pseudo-simultaneous recordings. Chance distributions were generated by randomly assigning responses to all cells for each of the two sessions being compared, with probabilities that matched the proportion of responsive cells for each session as in the real data. We obtained chance distributions by computing the overlap for each random assignment and repeating the procedure 10,000 times. Statistical significance was assessed for the actual overlap between the two sessions by computing the probability of obtaining that value from the chance distribution assuming a normal distribution of estimated mean and variance.
Calcium event rate.
To determine the calcium event rate outside of task engagement, we used data from the pre-training odor exposure session, before two-odor discrimination training. Here, for each cell, we binarized the events deconvolved from calcium traces during 3 seconds before the onset of each odor (total of 90 seconds of data per cell: 3 seconds per trial × 30 trials). Event rates: vCA1 (0.072 Hz); dCA1 (0.086 Hz).
Behavior-neural activity correlation.
We determined whether activity of dCA1 or vCA1 neurons was correlated with licking, breathing and running. We regressed the lick and breath rates across the session against calcium events. We also regressed the velocity against calcium events but only during 4–7.5 seconds after odor exposure as to remove arduino-related artifacts in velocity recording when lick spout was rotated in or out of position (rotated in at 3.4 seconds; rotated out at 8 seconds). We fit a linear regression model to predict lick (Extended Data Fig. 3c), breathing (Extended Data Fig. 7c) or running (Extended Data Fig. 10e) rates and used the explained variance (R2) as a measure of goodness of fit to compare the results across animals and days. We divided each analyzed session in ten time-contiguous blocks and computed the generalization performance of the model with ten-fold cross-validation over these blocks to avoid overfitting. Regression was performed with regular linear regression with Lasso and verified that there are low correlations across behavior and calcium activity and that lick and breathing results are not qualitatively different.
Decoding high-speed versus low-speed running.
Neural activity and running speed during the ITI (1–6 seconds after the end of a trial) were averaged in 1-second time bins. For each of the five bins, the median running speed was assessed for each individual animal, and trials with speeds above or below this value were separated (trials with no running were excluded). The number of trials included for each condition (that is, low or high speed) was matched by subsampling from the condition with larger trial number. Linear decoding followed the same procedures as above. Statistical comparisons of accuracy versus theoretical chance or across HPC regions used the average decoding accuracies obtained for individual time bins for each trial type (reward, shock or CS− trial). Thus, in total, 15 data points were included for statistical comparisons per region (5 time bins × 3 trial types = 15 data points per region).
A-ha analysis.
We identified the first moment of distinguished licking behavior between CS+ and CS− trials by locating in all mice in the two-odor paradigm an ‘a-ha’ moment. This was calculated by averaging across every four trials the cumulative CS+ and CS− lick rates, taking the slope of the difference in cumulative licking between these bins and checking if (1) the difference exceeded the previous bin’s slope ≥1 s.d. of the difference line up to that bin and (2) the slope increase exceeded one-third of the difference between the previous set of trials. The averaging and thresholding with an increased slope relative to previous trials limited detection of instances where a short sequence of successfully discriminated trials was followed by a return to incorrect lickings, which would not represent a true a-ha moment. For potential a-ha moments detected on the first day of learning, we set a threshold of a minimum of 80 licks so that only mice who demonstrated lick rates similar to or above the baseline that we required during lick training could be considered to have learned. All a-ha moments detected by this method were cross-checked with examining the raw licking data to ensure accuracy. A-ha moments across mice spanned the first 2 days of learning, with 62% of mice reaching an a-ha moment on the first day of learning and all mice reaching an a-ha moment by the end of the second day.
For a-ha population decoding analysis, we used 30 trials before or after the a-ha moment. For mice where the a-ha moment was fewer than 30 trials from the end of the first or beginning of the second day of learning, trials from both days were included to reach the full 30 trials, and only cells registered across both sessions were included.
Effect size estimation.
For Mann–Whitney -tests and Wilcoxon tests versus chance (when non-normality was assumed), effect size was determined using:
where is the total sample size and
where is the sample size of sample 1; is the sample size of sample 2; and is the -test statistic obtained from the statistical test output. For -test analysis, Cohen’s was used, defined as the difference between group means divided by their pooled variance. For Fisherʼs analysis, the odds ratio was obtained directly from the test output. For one-way ANOVA, was obtained directly from the test output.
Reporting summary
Further information on research design is available in the Nature Portfolio Reporting Summary linked to this article.
Extended Data
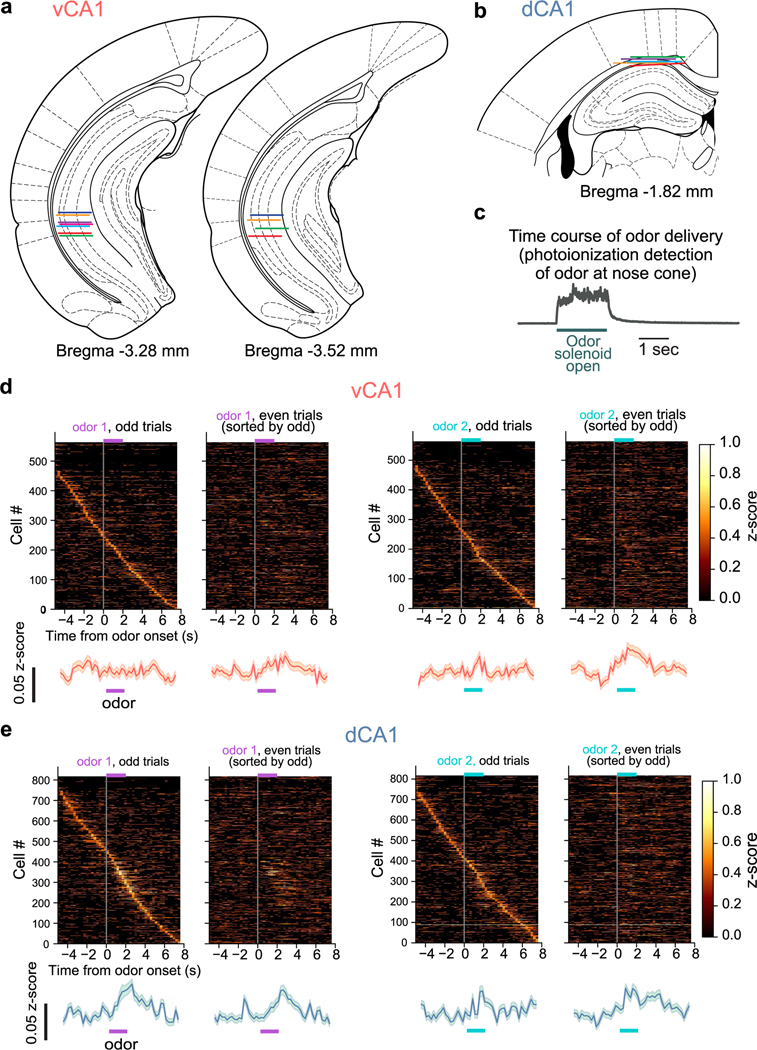
Extended Data Fig. 1 |. Implant localization and pre-training neural activity.
a, b. Reconstructed GRIN lens implant locations for all vCA1 (A) and dCA1 (B) animals used in odor-based studies. Colored lines indicate the estimated location of the lens impression left on the tissue. Atlas images adapted from78. c. Time course of odor presence at the nose cone. d. Cross-validated neural activity during the Pre session. Each trial type (odor1 or odor2) was separated into odd and even trials, and vCA1 neural activity was z-scored. For each time bin, z-scores were averaged across all trial subsets, and sorted by peak firing rate latency during odd trials. Line is population mean, shading is ±SEM. e. same as d, but for dCA1.
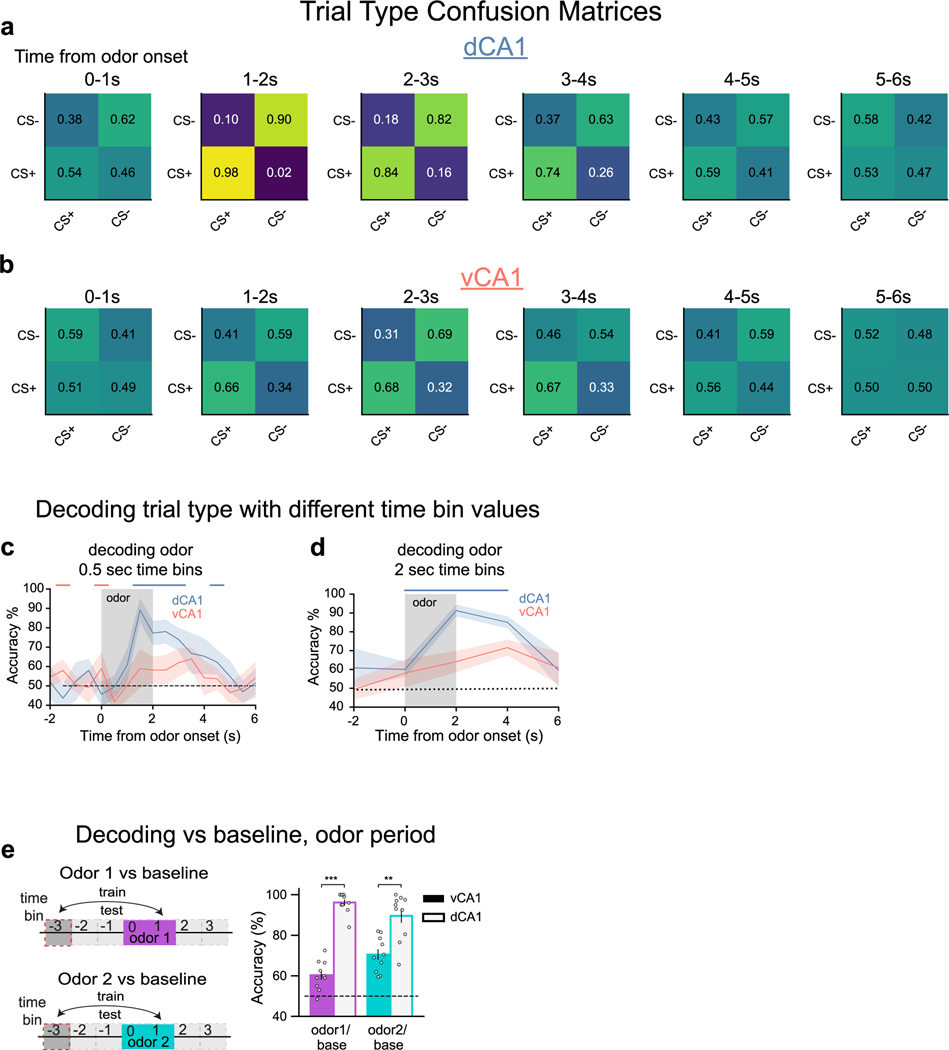
Extended Data Fig. 2 |. Population decoding of odor presentations prior to training.
a, b. Decoding confusion matrices. Actual trial type is on y-axis, trial type predicted by classifier is denoted by x-axis. Odor delivery period = 0–2 s; trace period = 2–4 s; sucrose delivery = 4 s (CS+trials only). c, d. Decoding trial type when using different time bin durations over which cell activity is averaged. Regardless of time bin duration used, dCA1 shows significantly higher decoding accuracy than vCA1 both during and soon after odor presentation. (n = 10 decoding iterations, n-matched 454 cells from 11 vCA1 and 5 dCA1 mice, two-sided Mann-Whitney U, color coded bars indicate p < 0.01). e. Odor-period decoding. Population activity during the last second of odor delivery was used to decode odor 1 or odor 2 from baseline. (n = 10 decoding iterations, n-matched 454 cells from 11 vCA1 and 5 dCA1 mice, two-sided Mann-Whitney U, error bars mean ± SEM, ** p < 0.01, *** p < 0.001). See Supplementary Table 1 for all statistical analysis details.
Extended Data Fig. 3 |. Learning-related changes in neural activity.
a. (left) Mean z-scored fluorescent signals for all recorded cells during the Early session, ordered by peak time bin. See Fig. 2e, f for Late session. (right) Line is mean, shading is ±SEM). b. Cross-validated neural activity. Each trial type (CS+ or CS-) was separated into odd and even trials, and neural activity was z-scored. For each time bin, z-scores were averaged across all trial subsets, and sorted by peak firing rate latency during odd trials. Population mean is shown directly below heatmap (line is mean, shading is ±SEM). c. Linear regression of lick rates and Ca2+ in vCA1 and dCA1 during Early and Late associative learning sessions (see Methods). We found that neural activity is not significantly correlated to lick rates (n = 11 vCA1 and 5 dCA1 mice, unpaired two-sided t-test, p > 0.05, error bars are mean ± SEM). d. Proportion of responsive cells of the total population whose activity was significantly modulated during odor- or trace-period compared to pre-odor baseline. Fisher’s exact test. Statistical power for the pre-training session (Pre) was too low for meaningful analysis (only 15 trials/trial-type in Pre vs 60 trials/trail-type in Early and Late). (n’s denoted on graph, two sided Fisher’s exact test, ** p < 0.01, *** p < 0.001,) See Supplementary Table 1 for all statistical analysis details.
Extended Data Fig. 4 |. Learning-related changes in population decoding.
a. Relationship between trial-type decoding accuracy and total number of cells (line is mean, shading is ±SD). b. Trial-type decoding accuracy for individual animals during the Late session. (n = 11 vCA1 mice, 5 dCA1, two-sided Mann-Whitney U test vs chance, error bars mean ± SEM). c. Population-activity decoding accuracy for CS+ or CS- trials from baseline (n = 10 decoding iterations from n-matched of 454 cells from 11 vCA1 and 5 dCA1 mice, two sided Mann-Whitney U test, color coded bar is p < 0.01, line is mean, shading is ±SD). d. Visualization of population activity pattern similarity for CS + and CS- trials via MDS dimensionality reduction. Dot plots show a sample MDS run, bar charts plot the average of 10 runs (n = 10 MDS iterations, two sided Mann-Whitney U test, error bars mean ± SEM). e. Sample cumulative licking during the trace period for CS+ and CS- trials from the Early and second day of learning. The Aha point, in this example at trial 20, represents the first moment the difference between the cumulative licking in CS+ and CS- trials exceeded the learning threshold (see Methods). f. Trial-type decoding accuracy during odor or trace periods using 30 CS+ and CS- trials before and after the Aha point. In vCA1, decoding accuracy significantly increases after the aha point for the odor and trace periods (n = 11 vCA1 5 dCA1 mice, two sided Mann-Whitney U test). Before the aha point, decoding during trace is not significantly different from chance (n = 11 vCA1 5 dCA1 mice, two-sided Wilcoxon test, p > 0.05). In dCA1, aha decoding does not significantly increase during the odor period and increases by a small but significant amount during trace period (n = 11 vCA1 5 dCA1 mice,two sided Mann-Whitney U test). dCA1 trace period decoding before the aha point is already significantly above chance (n = 11 vCA1 5 dCA1 mice, two-sided Wilcoxon test, p < 0.05). Error bars mean ± SEM. * p < 0.05, ** p < 0.01, *** p < 0.001. See Supplementary Table 1 for statistical analysis details.
Extended Data Fig. 5 |. Confusion matrices for extinction and reacquisition sessions.
Decoding confusion matrices for Extinction day 2 (a) and Reacquisition sessions (b).
Extended Data Fig. 6. |. Tracking Single-cell and population dynamics across training reveals stability of task encoding accompanies learning.
a, c. Activity during CS+ trials for neurons registered across specific session pairs. For each time bin, activity z-scores for each neuron were averaged across all trials within a session, and neurons were sorted by peak firing rate latency during the indicated session. b, d. Quantification of cells with increased responsiveness to different task epochs. Individual cells show high remapping of responsiveness to CS+ task epochs across Early and Late sessions, but increased stability from Late to Reacquisition. Proportion of cells responsive across two sessions was compared to the expected distribution of overlap based on the proportion of responsive cells in each individual session (n = 241 cells from 11 vCA1 mice and 337 cells from 4 dCA1 mice for Early vs Late and n = 253 cells from 10 vCA1 mice and 377 cells from 5 dCA1 mice for Late vs Reacquisition. Level of significance for 10,000 shufflings). e-h. Same as in a-d, but for CS- trials (n = 241 cells from 11 vCA1 mice and 337 cells from 4 dCA1 mice for Early vs Late and n = 253 cells from 10 vCA1 mice and 377 cells from 5 dCA1 mice for Late vs Reacquisition. i, j. Comparison of weights assigned to individual cells during decoding analysis; higher weight indicates greater importance for encoding2. As activity is correlated with assigned weight, we plotted weights values after regressing out the components explained by the activity. We find an increased correlation of weight values after learning (Late and Reacquisition) compared to initial training (Early/Late), supporting a stabilization of task representations accompanies learning. (n = 241 cells from 11 vCA1 mice and 337 cells from 4 dCA1 mice for Early vs Late and n = 253 cells from 10 vCA1 mice and 377 cells from 5 dCA1 mice for Late vs Reacquisition, linear least- squares regression ). k, l. Confusion matrices for across-session decoding. * p < 0.05, ** p < 0.01, *** p < 0.001. See Supplementary Table 1 for all statistical analysis details.
Extended Data Fig. 7 |. Confusion matrices for CS+ vs CS- trial type classification and breathing correlations.
a, b. Confusion matrices for CS+ vs CS- trial type classification. c. Breathing rate was not correlated with calcium event activity in either hippocampal region. Data points represent individual animals (n = 11 vCA1, 5 dCA1 imaging sessions, unpaired two-sided t-test, p > 0.05, error bars are mean ± SEM). Data taken from Late session. See Supplementary Table 1 for all statistical analysis details.
Extended Data Fig. 8 |. Task representations show increased stability with learning following a break in training.
a. In the 2-odor task, Late and Reacquisition sessions were separated by multiple extinction sessions. To assess how task representations may change across a similar time period, but with no additional task experience, following learning of the 4-odor task, mice were kept in their homecage and rerun on the learned task 4 days later (Post). b. Mean lick rate during the trace period for all animals (n = 8 vCA1, 5 dCA1 mice,, two sided Mann-Whitney U test, * p < 0.05, *** p < 0.001, error bars mean ± SEM). c, d. Trial-type and CS+ vs CS- decoding accuracies were similar for the Post session (shown here) compared to Late (Fig. 5c and Extended Data Fig. 7a, b; Analyses used 150 cells for each region). e As in Late session, odor and outcome information were multiplexed in vCA1 during the odor delivery period, while outcome information was present in both vCA1 and dCA1 during trace (n = 10 decoding iterations from n-matched 150 cells from 8 vCA1 and 5 dCA1 mice, two sided Mann-Whitney U test, *** p < 0.001, error bars are mean ± SEM). f. Pearson’s correlation of activity patterns across time bins. g. Task representations showed greater stability once learned. Analyses used cells registered across all 3 sessions. (n = 10 decoding iterations from n-matched 100 cells from 8 vCA1 and 5 dCA1 mice, two sided Mann-Whitney U test, * p < 0.05, ** p < 0.01, *** p < 0.001, error bars are mean ± SEM). h. Same as in g, but decoding CS+ vs CS- across sessions. See Supplementary Table 1 for all statistical analysis details.
Extended Data Fig. 9 |. Odor ID and reward expectation representations remain stable across reversal learning, while shock anticipation signals fade.
a. Trial-type decoding accuracy. Rew = reward trial. Sh = shock trial. (n-matched pseudopopulation of 444 cells from 10 vCA1 and 3 dCA1 mice, line is mean and shading is ±SD). b. Change in odor-period (left) or trace-period (right) decoding accuracies for CS+ shock vs CS- trials from Early to Late sessions (±SEM). Statistics compare Early and Late sessions for a specific hippocampal region (Mann-Whitney U test). n = 10 decoding iterations from n-matched pseudopopulation of 444 cells from 10 vCA1 and 3 dCA1 mice, two sided Mann-Whitney U test, * p < 0.05, ** p < 0.01, *** p < 0.001, error bars are mean ± SEM). c. Same as in b but decoding CS+ reward from CS- trials. d, e. Confusion matrices for trial-type decoding accuracy during Early (upper) or Late (lower) sessions. f. Schematic illustrating trial-type decoding across reversal learning. g. Hypothetical results for decoding CS+ reward from CS+ shock trials across reversal learning (for this set of results, stable encoding of US identity across reversal is assumed). Because data classes were labeled with respect to the outcome of a trial, and not the odor identity, stable neural representations of odor identity will manifest as cross-session decoding accuracies that are below chance (middle graph). h. Actual results for decoding trial type across reversal learning. The below chance decoding accuracy for CS+ reward vs CS+ shock during the odor period indicates representations of odor identity dominate the population activity during this time. (n-matched pseudopopulation of 281 cells from 10 vCA1 and 3 dCA1 mice, line is mean and error bars are ±SD). i-j. Across-reversal odor ID decoding accuracy during the odor period (i) and trial type during trace period ( j) (n-matched pseudopopulation of 281 cells from 10 vCA1 and 3 dCA1 mice, two sided Mann-Whitney U test, *** p < 0.001, error bars are mean ± SEM). See Supplementary Table 1 for all statistical analysis details.
Extended Data Fig. 10 |. Headfixed active avoidance task results.
a. Lick (top) and running (bottom) behavior from an example mouse during the first day of training. Trial number is color-coded, yellow to black. During the first day of training, the mouse had very few trials with suprathreshold running, leading to few rewards and numerous shock deliveries. Shock delivery resulted in rapid, transient running. Vertical grey bar = odor delivery period; vertical blue/red bar = time of sucrose/shock delivery onset (on applicable trials). Blue ticks = time point when running exceeded threshold. Green ticks denote trials where shock was delivered. Light blue trace = average running speed. Sh = shock odor trial. b. Same as in a, but Late session for the same mouse. c. Confusion matrices for Late session, suprathreshold trials, n = 340 cells from vCA1 and dCA1. d. Pairwise decoding for trial type. While active avoidance trials are well discriminated from rewarded trials, decoding accuracy was lower for AA vs CS- trials during the trace period (n-matched pseudopopulation of 340 cells from 8 vCA1 and 4 dCA1 mice, two sided Mann-Whitney U test, * p < 0.05, ** p < 0.01, *** p < 0.001, error bars are mean ± SEM). e. Running was not correlated with vCA1 neural activity, but was moderately correlated with dCA1 activity (±SEM, Mann-Whitney U test). Data are from Late session. (n = 11 vCA1, 5 dCA1 imaging sessions, unpaired two-sided t-test, *** p < 0.001, error bars are mean ± SEM). f. To further assess how running may have contributed to our results, we trained a linear classifier to decode high vs low speed running trials during time bins outside of the task (5–10 seconds post odor delivery). While running speed could be decoded above chance in both regions, decoding was relatively weak. Significance stars above individual bars report significance level versus 50% chance decoding accuracy (n = 5 time bins,, two sided Wilcoxon signed-rank test, * p < 0.05, *** p < 0.001 error bars are mean ± SEM). See Supplementary Table 1 for all statistical analysis details.
Supplementary Material
Acknowledgements
We thank V. Namboodiri and L. Frank for discussions and comments and K. Litke, S. Chien, A. Vittala, A. Garg and C. Lacefield for technical assistance. J.S.B. was supported by the Brain and Behavioral Research Foundation (NARSAD) and the Sandler PBBR Independent Postdoctoral Fellow Research Award. M.A.L. was supported by a National Science Foundation Graduate Research Fellowship. M.A.K. was supported by the National Institute of Mental Health (R01 MH108623, R01 MH111754 and R01 MH117961); the National Institute on Deafness and Other Communication Disorders (R01 DC019813); a One Mind Rising Star Award; a research grant from the Human Frontier Science Program (RGY0072/2019); the Esther A. and Joseph Klingenstein Fund; the Pew Charitable Trusts; the McKnight Memory and Cognitive Disorders Award; and the Ray and Dagmar Dolby Family Fund.
Footnotes
Code availability
The analysis code supporting this study is available from the Kheirbek laboratory GitHub site (https://github.com/mkheirbek).
Additional information
Extended data is available for this paper at https://doi.org/10.1038/s41593-023-01296-6.
Supplementary information The online version contains supplementary material available at https://doi.org/10.1038/s41593-023-01296-6.
Peer review information Nature Neuroscience thanks Edward Nieh and the other, anonymous, reviewer(s) for their contribution to the peer review of this work.
Reprints and permissions information is available at www nature com/reprints.
Contact for reagents and resource sharing Further information and requests for resources and reagents should be directed to M.A.K.
Competing interests
The authors declare no competing interests.
Data availability
All source data can be downloaded from the Kheirbek laboratory GitHub site (https://github.com/mkheirbek).
References
- 1.Ahmed MS et al. Hippocampal network reorganization underlies the formation of a temporal association memory. Neuron 107, 283–291 (2020). [DOI] [PMC free article] [PubMed] [Google Scholar]
- 2.Stefanini F et al. A distributed neural code in the dentate gyrus and in CA1. Neuron 107, 703–716 (2020). [DOI] [PMC free article] [PubMed] [Google Scholar]
- 3.Fanselow MS & Dong H-W Are the dorsal and ventral hippocampus functionally distinct structures? Neuron 65, 7–19 (2010). [DOI] [PMC free article] [PubMed] [Google Scholar]
- 4.Strange BA, Witter MP, Lein ES & Moser EI Functional organization of the hippocampal longitudinal axis. Nat. Rev. Neurosci 15, 655–669 (2014). [DOI] [PubMed] [Google Scholar]
- 5.Komorowski RW, Manns JR & Eichenbaum H. Robust conjunctive item–place coding by hippocampal neurons parallels learning what happens where. J. Neurosci 29, 9918–9929 (2009). [DOI] [PMC free article] [PubMed] [Google Scholar]
- 6.Pastalkova E, Itskov V, Amarasingham A & Buzsáki G. Internally generated cell assembly sequences in the rat hippocampus. Science 321, 1322–1327 (2008). [DOI] [PMC free article] [PubMed] [Google Scholar]
- 7.Taxidis J et al. Differential emergence and stability of sensory and temporal representations in context-specific hippocampal sequences. Neuron 108, 984–998 (2020). [DOI] [PMC free article] [PubMed] [Google Scholar]
- 8.Wood ER, Dudchenko PA, Robitsek RJ & Eichenbaum H. Hippocampal neurons encode information about different types of memory episodes occurring in the same location. Neuron 27, 623–633 (2000). [DOI] [PubMed] [Google Scholar]
- 9.Harland B, Contreras M & Fellous J-M A role for the longitudinal axis of the hippocampus in multiscale representations of large and complex spatial environments and mnemonic hierarchies. in The Hippocampus: Plasticity and Functions (ed Stuchlik A)(IntechOpen, 2017). [Google Scholar]
- 10.Knudsen EB & Wallis JD Hippocampal neurons construct a map of an abstract value space. Cell 184, 4640–4650 (2021). [DOI] [PMC free article] [PubMed] [Google Scholar]
- 11.Komorowski RW et al. Ventral hippocampal neurons are shaped by experience to represent behaviorally relevant contexts J. Neurosci 33, 8079–8087 (2013). [DOI] [PMC free article] [PubMed] [Google Scholar]
- 12.Royer S, Sirota A, Patel J & Buzsáki G. Distinct representations and theta dynamics in dorsal and ventral hippocampus. J. Neurosci 30, 1777–1787 (2010). [DOI] [PMC free article] [PubMed] [Google Scholar]
- 13.Ciocchi S, Passecker J,, Malagon-Vina H, Mikus N & Klausberger T. Selective information routing by ventral hippocampal CA1 projection neurons. Science 348, 560–563 (2015). [DOI] [PubMed] [Google Scholar]
- 14.Jimenez JC et al. Anxiety cells in a hippocampal-hypothalamic circuit. Neuron 97, 670–683 (2018). [DOI] [PMC free article] [PubMed] [Google Scholar]
- 15.Tannenholz L, Jimenez JC & Kheirbek MA Local and regional heterogeneity underlying hippocampal modulation of cognition and mood. Front. Behav. Neurosci 8, 147 (2014). [DOI] [PMC free article] [PubMed] [Google Scholar]
- 16.Musall S, Kaufman MT, Juavinett AL, Gluf S & Churchland AK Single-trial neural dynamics are dominated by richly varied movements. Nat. Neurosci 22, 1677–1686 (2019). [DOI] [PMC free article] [PubMed] [Google Scholar]
- 17.Stringer C et al. Spontaneous behaviors drive multidimensional, brain-wide activity. Science 364, 255 (2019). [DOI] [PMC free article] [PubMed] [Google Scholar]
- 18.Li Y et al. A distinct entorhinal cortex to hippocampal CA1 direct circuit for olfactory associative learning. Nat. Neurosci 20, 559–570 (2017). [DOI] [PubMed] [Google Scholar]
- 19.Wikenheiser AM & Schoenbaum G. Over the river, through the woods: cognitive maps in the hippocampus and orbitofrontal cortex. Nat. Rev. Neurosci 17, 513–523 (2016). [DOI] [PMC free article] [PubMed] [Google Scholar]
- 20.Burton BG, Hok V, Save E & Poucet B. Lesion of the ventral and intermediate hippocampus abolishes anticipatory activity in the medial prefrontal cortex of the rat. Behav. Brain Res 199, 222–234 (2009). [DOI] [PubMed] [Google Scholar]
- 21.Turner VS, O’Sullivan RO & Kheirbek MA Linking external stimuli with internal drives: a role for the ventral hippocampus. Curr. Opin. Neurobiol 76, 102590 (2022). [DOI] [PMC free article] [PubMed] [Google Scholar]
- 22.Felix-Ortiz AC et al. BLA to vHPC inputs modulate anxiety-related behaviors. Neuron 79, 658–664 (2013). [DOI] [PMC free article] [PubMed] [Google Scholar]
- 23.Graham J et al. High-frequency stimulation of ventral CA1 neurons reduces amygdala activity and inhibits fear. Front. Behav. Neurosci 15, 31 (2021). [DOI] [PMC free article] [PubMed] [Google Scholar]
- 24.Xu C et al. Distinct hippocampal pathways mediate dissociable roles of context in memory retrieval. Cell 167, 961–972 (2016). [DOI] [PMC free article] [PubMed] [Google Scholar]
- 25.Trouche S et al. A hippocampus-accumbens tripartite neuronal motif guides appetitive memory in space. Cell 176, 1393–1406 (2019). [DOI] [PMC free article] [PubMed] [Google Scholar]
- 26.Eichenbaum H, Kuperstein M, Fagan A & Nagode J. Cue-sampling and goal-approach correlates of hippocampal unit activity in rats performing an odor-discrimination task. J. Neurosci 7, 716–732 (1987). [DOI] [PMC free article] [PubMed] [Google Scholar]
- 27.Jin S-W & Lee I. Differential encoding of place value between the dorsal and intermediate hippocampus. Curr. Biol 31, 3053–3072 (2021). [DOI] [PubMed] [Google Scholar]
- 28.Cai DJ et al. A shared neural ensemble links distinct contextual memories encoded close in time. Nature 534, 115–118 (2016). [DOI] [PMC free article] [PubMed] [Google Scholar]
- 29.Gonzalez WG, Zhang H, Harutyunyan A & Lois C. Persistence of neuronal representations through time and damage in the hippocampus. Science 365, 821–825 (2019). [DOI] [PubMed] [Google Scholar]
- 30.Hainmueller T & Bartos M. Dentate gyrus circuits for encoding, retrieval and discrimination of episodic memories. Nat. Rev. Neurosci 21, 153–168 (2020). [DOI] [PMC free article] [PubMed] [Google Scholar]
- 31.Mankin EA et al. Neuronal code for extended time in the hippocampus. Proc. Natl Acad. Sci. USA 109, 19462–19467 (2012). [DOI] [PMC free article] [PubMed] [Google Scholar]
- 32.Radvansky BA, Oh JY, Climer JR & Dombeck DA Behavior determines the hippocampal spatial mapping of a multisensory environment. Cell Rep. 36, 109444 (2021). [DOI] [PMC free article] [PubMed] [Google Scholar]
- 33.Ziv Y et al. Long-term dynamics of CA1 hippocampal place codes. Nat. Neurosci 16, 264–266 (2013). [DOI] [PMC free article] [PubMed] [Google Scholar]
- 34.Liberti WA, Schmid TA, Forli A, Snyder M & Yartsev MM Publisher correction: a stable hippocampal code in freely flying bats. Nature 606, E6 (2022). [DOI] [PubMed] [Google Scholar]
- 35.Namboodiri VMK et al. Single-cell activity tracking reveals that orbitofrontal neurons acquire and maintain a long-term memory to guide behavioral adaptation. Nat. Neurosci 22, 1110–1121 (2019). [DOI] [PMC free article] [PubMed] [Google Scholar]
- 36.Jimenez JC et al. Contextual fear memory retrieval by correlated ensembles of ventral CA1 neurons. Nat. Commun 11, 3492 (2020). [DOI] [PMC free article] [PubMed] [Google Scholar]
- 37.Xia F & Kheirbek MA Circuit-based biomarkers for mood and anxiety disorders. Trends Neurosci. 43, 902–915 (2020). [DOI] [PMC free article] [PubMed] [Google Scholar]
- 38.Shpokayte M et al. Hippocampal cells segregate positive and negative engrams. Commun. Biol 5, 1009 (2022). [DOI] [PMC free article] [PubMed] [Google Scholar]
- 39.Kjelstrup KB et al. Finite scale of spatial representation in the hippocampus. Science 321, 140–143 (2008). [DOI] [PubMed] [Google Scholar]
- 40.Petter EA, Gershman SJ & Meck WH Integrating models of interval timing and reinforcement learning. Trends Cogn. Sci 22, 911–922 (2018). [DOI] [PubMed] [Google Scholar]
- 41.Sosa M & Giocomo LM Navigating for reward. Nat. Rev. Neurosci 22, 472–487 (2021). [DOI] [PMC free article] [PubMed] [Google Scholar]
- 42.Wikenheiser AM, Marrero-Garcia Y & Schoenbaum G. Suppression of ventral hippocampal output impairs integrated orbitofrontal encoding of task structure. Neuron 95, 1197–1207 (2017). [DOI] [PMC free article] [PubMed] [Google Scholar]
- 43.Danielson NB et al. Sublayer-specific coding dynamics during spatial navigation and learning in hippocampal area CA1. Neuron 91, 652–665 (2016). [DOI] [PMC free article] [PubMed] [Google Scholar]
- 44.Dupret D, O’Neill J, Pleydell-Bouverie B & Csicsvari J. The reorganization and reactivation of hippocampal maps predict spatial memory performance. Nat. Neurosci 13, 995–1002 (2010). [DOI] [PMC free article] [PubMed] [Google Scholar]
- 45.Kaufman AM, Geiller T & Losonczy A. A role for the locus coeruleus in hippocampal CA1 place cell reorganization during spatial reward learning. Neuron 105, 1018–1026 (2020). [DOI] [PMC free article] [PubMed] [Google Scholar]
- 46.Sato M et al. Distinct mechanisms of over-representation of landmarks and rewards in the hippocampus. Cell Rep. 32,107864 (2020). [DOI] [PMC free article] [PubMed] [Google Scholar]
- 47.Xu H, Baracskay P, O’Neill J & Csicsvari J. Assembly responses of hippocampal CA1 place cells predict learned behavior in goal-directed spatial tasks on the radial eight-arm maze. Neuron 101, 119–132 (2019). [DOI] [PubMed] [Google Scholar]
- 48.Duvelle É et al. Insensitivity of place cells to the value of spatial goals in a two-choice flexible navigation task. J. Neurosci 39, 2522–2541 (2019). [DOI] [PMC free article] [PubMed] [Google Scholar]
- 49.Hok V et al. Goal-related activity in hippocampal place cells. J. Neurosci 27, 472–482 (2007). [DOI] [PMC free article] [PubMed] [Google Scholar]
- 50.Gauthier JL & Tank DW A dedicated population for reward coding in the hippocampus. Neuron 99, 179–193 (2018). [DOI] [PMC free article] [PubMed] [Google Scholar]
- 51.Markus EJ et al. Interactions between location and task affect the spatial and directional firing of hippocampal neurons J. Neurosci 15, 7079–7094 (1995). [DOI] [PMC free article] [PubMed] [Google Scholar]
- 52.MacDonald CJ, Carrow S, Place R & Eichenbaum H. Distinct hippocampal time cell sequences represent odor memories in immobilized rats. J. Neurosci 33, 14607–14616 (2013). [DOI] [PMC free article] [PubMed] [Google Scholar]
- 53.Mount RA et al. Distinct neuronal populations contribute to trace conditioning and extinction learning in the hippocampal CA1. eLife 10, e56491 (2021). [DOI] [PMC free article] [PubMed] [Google Scholar]
- 54.Kjelstrup KG et al. Reduced fear expression after lesions of the ventral hippocampus. Proc. Natl Acad. Sci. USA 99, 10825–10830 (2002). [DOI] [PMC free article] [PubMed] [Google Scholar]
- 55.McEchron MD, Bouwmeester H, Tseng W, Weiss C & Disterhoft JF Hippocampectomy disrupts auditory trace fear conditioning and contextual fear conditioning in the rat. Hippocampus 8, 638–646 (1998). [DOI] [PubMed] [Google Scholar]
- 56.McKenzie S et al. Hippocampal representation of related and opposing memories develop within distinct, hierarchically organized neural schemas. Neuron 83, 202–215 (2014). [DOI] [PMC free article] [PubMed] [Google Scholar]
- 57.Nieh EH et al. Geometry of abstract learned knowledge in the hippocampus. Nature 595, 80–84 (2021). [DOI] [PMC free article] [PubMed] [Google Scholar]
- 58.Palacios-Filardo J & Mellor JR Neuromodulation of hippocampal long-term synaptic plasticity. Curr. Opin. Neurobiol 54, 37–43 (2019). [DOI] [PMC free article] [PubMed] [Google Scholar]
- 59.Bethus I, Tse D & Morris RGM Dopamine and memory: modulation of the persistence of memory for novel hippocampal NMDA receptor-dependent paired associates. J. Neurosci 30, 1610–1618 (2010). [DOI] [PMC free article] [PubMed] [Google Scholar]
- 60.McNamara CG, Tejero-Cantero Á, Trouche S, Campo-Urriza N & Dupret D. Dopaminergic neurons promote hippocampal reactivation and spatial memory persistence. Nat. Neurosci 17, 1658–1660 (2014). [DOI] [PMC free article] [PubMed] [Google Scholar]
- 61.Teixeira CM et al. Hippocampal 5-HT input regulates memory formation and Schaffer collateral excitation. Neuron 98, 992–1004 (2018). [DOI] [PMC free article] [PubMed] [Google Scholar]
- 62.Gergues MM et al. Circuit and molecular architecture of a ventral hippocampal network. Nat. Neurosci 23, 1444–1452 (2020). [DOI] [PMC free article] [PubMed] [Google Scholar]
- 63.Woods NI et al. The dentate gyrus classifies cortical representations of learned stimuli. Neuron 107, 173–184 (2020). [DOI] [PMC free article] [PubMed] [Google Scholar]
- 64.Yang S et al. Interlamellar CA1 network in the hippocampus. Proc. Natl Acad. Sci. USA 111, 12919–12924 (2014). [DOI] [PMC free article] [PubMed] [Google Scholar]
- 65.Biane JS, Takashima Y, Scanziani M, Conner JM & Tuszynski MH Reorganization of recurrent layer 5 corticospinal networks following adult motor training. J. Neurosci 39, 4684–4693 (2019). [DOI] [PMC free article] [PubMed] [Google Scholar]
- 66.Douglas RJ & Martin KAC Recurrent neuronal circuits in the neocortex. Curr. Biol 17, R496–R500 (2007). [DOI] [PubMed] [Google Scholar]
- 67.Doron A et al. Hippocampal astrocytes encode reward location. Nature 609, 772–778 (2022). [DOI] [PubMed] [Google Scholar]
- 68.Turi GF et al. Vasoactive intestinal polypeptide-expressing interneurons in the hippocampus support goal-oriented spatial learning. Neuron 101, 1150–1165 (2019). [DOI] [PMC free article] [PubMed] [Google Scholar]
- 69.Grosmark AD & Buzsáki G. Diversity in neural firing dynamics supports both rigid and learned hippocampal sequences. Science 351, 1440–1443 (2016). [DOI] [PMC free article] [PubMed] [Google Scholar]
- 70.Collin SHP, Milivojevic B & Doeller CF . Memory hierarchies map onto the hippocampal long axis in humans. Nat. Neurosci 18, 1562–1564 (2015). [DOI] [PMC free article] [PubMed] [Google Scholar]
- 71.Sosa M, Joo HR & Frank LM Dorsal and ventral hippocampal sharp-wave ripples activate distinct nucleus accumbens networks. Neuron 105, 725–741 (2020). [DOI] [PMC free article] [PubMed] [Google Scholar]
- 72.Pnevmatikakis EA & Giovannucci A. NoRMCorre: an online algorithm for piecewise rigid motion correction of calcium imaging data. J. Neurosci. Methods 291, 83–94 (2017). [DOI] [PubMed] [Google Scholar]
- 73.Pachitariu M et al. Suite2p: beyond 10,000 neurons with standard two-photon microscopy. Preprint at https://www.biorxiv.org/content/10.1101/061507v2 (2017).
- 74.Zhou P et al. Efficient and accurate extraction of in vivo calcium signals from microendoscopic video data. eLife 7, e28728 (2018). [DOI] [PMC free article] [PubMed] [Google Scholar]
- 75.Friedrich J, Zhou P & Paninski L. Fast online deconvolution of calcium imaging data. PLoS Comput. Biol 13, e1005423 (2017). [DOI] [PMC free article] [PubMed] [Google Scholar]
- 76.Sheintuch L et al. Tracking the same neurons across multiple days in Ca2+ imaging data. Cell Rep. 21, 1102–1115 (2017). [DOI] [PMC free article] [PubMed] [Google Scholar]
- 77.Bishop CM Pattern Recognition and Machine Learning (Springer, 2006). [Google Scholar]
- 78.Paxinos G & Franklin K. Paxinos and Franklin’s the Mouse Brain in Stereotaxic Coordinates (Academic Press, 2019). [Google Scholar]
Associated Data
This section collects any data citations, data availability statements, or supplementary materials included in this article.
Supplementary Materials
Data Availability Statement
All source data can be downloaded from the Kheirbek laboratory GitHub site (https://github.com/mkheirbek).


