

Abstract
Breast cancer is the leading cause of cancer-associated deaths among women. Techniques for non-invasive breast cancer detection and imaging are urgently needed. Multimodality breast cancer imaging is attractive since it can integrate advantages from several modalities, enabling more accurate cancer detection. In order to accomplish this, indocyanine green (ICG)-conjugated superparamagnetic iron oxide nanoworm (NW-ICG) has been synthesized as a contrast agent. When evaluated in a spontaneous mouse breast cancer model, NW–ICG gave a large tumor to normal tissue contrasts in multiple imaging modalities including magnetic particle imaging, near-infrared fluorescence imaging, and photoacoustic imaging, providing more comprehensive detection and imaging of breast cancer. Thus, NW–ICGs are an attractive platform for non-invasive breast cancer diagnosis
Keywords: breast cancer, indocyanine green, iron oxide, magnetic particle imaging, multimodality imaging, photoacoustic imaging
Graphical Abstract

INTRODUCTION
Among women, breast cancer is the most diagnosed cancer and causes most cancer-related deaths. In 2020, it was estimated that there will be 2.3 million new cases (11.7% of all cancer cases) and 685,000 deaths due to breast cancer in the world.1 Detection of breast tumors is crucial to guide the treatment and improve survival. Non-invasive imaging and detection of breast cancer are attractive fields of research.2
Various imaging modalities have been developed to diagnose breast cancer, including positron emission tomography, single-photon emission computed tomography, X-ray computed tomography (CT), magnetic resonance imaging (MRI), ultrasound, and fluorescence imaging.3–6 However, each modality has its own limitations such as sensitivity, specificity, background signals from normal tissues, and the depth of tissues that can be imaged, leading to a challenge for accurate breast cancer diagnosis by a single modality. Multimodal imaging is an emerging strategy to provide images co-registered from multiple modalities.7–11 It can potentially overcome the limitations of individual imaging methods by supplying complementary information from multiple imaging techniques.
Herein, we report our efforts in multimodality imaging of breast cancer in a spontaneous mouse tumor model by magnetic particle imaging (MPI), photoacoustic imaging (PAI), and fluorescence imaging, which were enabled by a single platform, that is, the iron oxide nanoworm (NW) functionalized with indocyanine green (ICG). MPI is a nascent imaging modality that detects superparamagnetic iron oxide tracers.13 MPI has multiple advantages including high-imaging contrast, high sensitivity, potential linear correlation between signal strength and tracer concentration, high imaging depth, no ionizing radiation, and nearly no background.14 MPI aided by magnetic tracers has been applied to various applications including cancer imaging.12,15,16
To date, only a few MPI-related multimodality imaging studies have been published. The Krishnan group demonstrated lactoferrin-conjugated NPs that enabled tumor imaging via MPI and fluorescence imaging with a xenograft tumor mouse model.12 Rao and co-workers presented a nanoplatform that enabled MPI, MRI, PAI, and fluorescence imaging for the detection of xenografted breast tumor.9 However, multimodal imaging for diagnosis of multiple tumors in a mouse model of spontaneous tumor has not been reported.
PAI is an imaging method that detects acoustic waves generated by a contrast agent rather than the emitted fluorescence. As a result, PAI can enable detection at deeper tissue depth with a high spatial resolution as compared to typical optical imaging techniques.17 A contrast agent such as ICG can absorb the energy from the incident laser in PAI. Part of the absorbed energy is converted to heat, causing a thermoelastic expansion, which generates an acoustic wave for detection.18–21 An advantage of ICG is that it is a water-soluble near-infrared (NIR) dye approved by the Food and Drug Administration (FDA) as a clinical imaging agent with a good safety profile.22–29
For in vivo applications of nanoprobes, it is important that the probes are highly biocompatible. Iron oxide NWs30–32 are associated with a much lower inflammatory response in vitro and in vivo compared to the corresponding spherically shaped iron oxide nanoparticles (SPIONs).33 The stability of probes is crucial for in vivo diagnosis as well. Researchers developed the hybrid ICG–SPION approach through simple mixing34,35 or non-covalent encapsulation36,37 for multimodal imaging. However, ICG can leak out of those particles, complicating the interpretation of imaging results. To achieve better diagnosis of breast cancer, we covalently conjugated ICG to iron oxide NWs (NW–ICG), which could be passively targeted to breast tumors via the enhanced permeability and retention (EPR) effect.38–41 The new nanoprobes enabled noninvasive detection of breast tumors by integrating three imaging modalities into one platform.
RESULTS
Synthesis and Characterization of NW–ICG.
Synthesis of NW–ICG started from dextran-coated superparamagnetic iron oxide NWs, which were prepared through the coprecipitation method in the presence of dextran (40 kDa) (Scheme 1). The surface dextran on NWs was then cross-linked with epichlorohydrin, followed by the treatment with ammonia to introduce amine groups on the surface (NW–NH2).33 ICG-N-hydroxy succinimide (NHS) ester was conjugated with NW–NH2, leading to NW–ICG.
Scheme 1.

Synthesis of NW–ICG
The morphology of synthesized NW–ICG was characterized by transmission electron microscopy (TEM), which showed a worm-like shape of the NW–ICG (Figures 1a and S1).31,33 The average length of NW–ICG’s iron oxide core was 68 ± 18 nm, corresponding to ~15–30 spherical NPs in one NW (Figure 1a). The ζ potential of NW–ICG was +3.6 mV, and the average hydrodynamic diameter was 103 nm (Figure S2). The absorbance and emission maximum peaks of NW–ICG blue-shifted from 790 to 780 nm and from 810 to 800 nm, respectively, compared to the parent molecule ICG (Figure 1b). The blue shifts in the absorbance and fluorescence maxima could be due to the metal-enhanced fluorescence effect or the nanoaggregation of ICG when conjugated to the NWs.42–44 The fluorescence signals of NW–ICG (excitation at 790 nm) correlated linearly with nanoparticle concentration (Figure 1c). The NW–ICGs were also imaged by PAI in test tubes placed in an agar phantom. Single-wavelength (780 nm) anatomical photoacoustic (PA) images showed increasing PA signals with increasing sample concentrations (Figure 1d). The PA spectrum of NW–ICG (Figure 1e) showed a distribution profile consistent with its UV–vis absorbance spectrum. This enabled us to use the wavelength range with a higher absorbance as the excitation wavelengths in PAI, enhancing the strength of PA signals.
Figure 1.
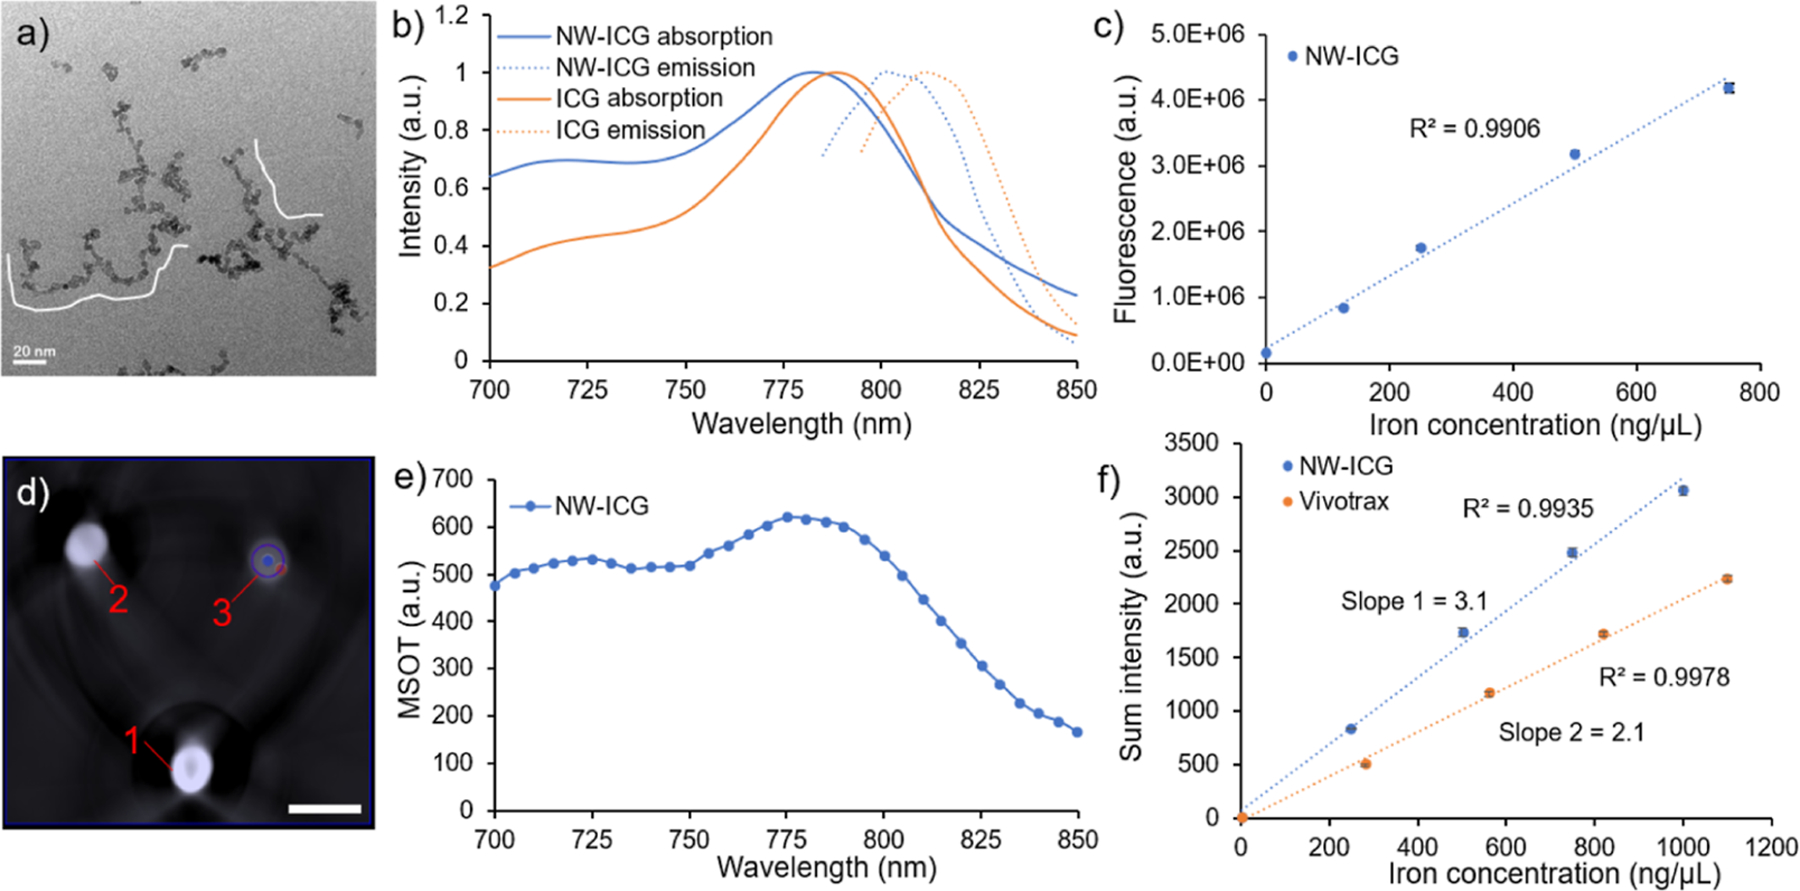
(a) TEM image showed the worm-like morphology of NW–ICG. The scale bar is 20 nm. (b) Normalized UV–vis absorption and emission spectra of NW–ICG and free ICG. (c) Linear correlation between the fluorescence signal intensity and Fe concentration of NW–ICG; (d) PA images of three concentrations of NW–ICG (diluted in water)-loaded test tubes in agar phantom. Three samples: (1) iron concentration of 1 mg/mL, (2) iron concentration of 0.5 mg/mL, and (3) iron concentration of 0.1 mg/mL. The scale bar is 10 mm. (e) PA spectrum. (f) Linear correlation between MPI signal intensities and Fe concentration for NW–ICG and VivoTrax, respectively. NW–ICG gave stronger MPI signals compared to VivoTrax, as suggested by the steeper slope, highlighting the advantage of NW–ICG as MPI contrast agents.
The ability of NW–ICG to function as an MPI contrast agent was analyzed. Increasing concentrations of NW–ICG in aqueous solutions were imaged by MPI in test tubes to determine the signal to Fe content sensitivity. The MPI signals of NW–ICG solution showed a linear correlation with the Fe concentration (Figure 1f). To benchmark the performance of NW–ICG in MPI, a commercially available iron oxide nanoparticle (IONP)-based contrast agent, VivoTrax, was used for head-to-head comparison. VivoTrax (Magnetic Insight Inc., CA, USA) is a carboxydextran-coated SPION with a core size of 4.2 nm and a mean hydrodynamic diameter of 62 nm. As shown in Figure 1f, NW–ICG exhibited more than 1.5 times higher MPI signal sensitivities compared to VivoTrax, highlighting the advantage of NW–ICG. To evaluate the biocompatibility of NW–ICG, cell viability assays were performed with Raw 264.7 cells (Figure S3). No significant changes in cell viability were observed after incubating Raw 264.7 cells with various concentrations (0.5, 0.25, and 0.13 mg Fe/mL) of NW–ICG.
NW–ICG-Enabled Multi-modality Imaging of Breast Cancer.
To examine the cancer-imaging ability of NW–ICG, we tested it in MMTV-PyMT transgenic mice. MMTV-PyMT mice express the polyoma virus middle T antigen under the direction of the mouse mammary tumor virus promoter/enhancer,45,46 which leads to the spontaneous development of multiple palpable mammary tumors in 4–6 months. Compared to xenograft models of mouse breast cancer, the MMTV-PyMT mouse can mimic more closely the human breast cancer conditions with a native tumor microenvironment.
Five month old female tumor-bearing MMTV-PyMT mice were administered NW–ICG (16 mg of iron/kg body weight) through the tail veins, which were followed by serial imaging with MPI, PAI, and fluorescence over 72 h. Mice were also imaged by computed tomography (CT) to provide anatomical background for the images. As a comparison, a control group of mice received VivoTrax at the identical level of iron. While there were no endogenous MPI signals in mice before administration of NW–ICG, 1 h post-injection, strong signals were observed, with the dominant location of signals being the liver area (Figure 2a). Several tumors gave medium levels of MPI signals, indicating NW–ICG was already delivered to the tumor at 1 h. Besides the liver and tumor, other organs with MPI signals were observed, including the spleen and bladder. Longitudinal imaging of the mouse showed increasing MPI signal strength in multiple breast cancer locales with a concomitant reduction in liver signals. The relative % of MPI signals in tumor areas over the whole mouse body was quantified (Figures 2c and S4), which increased from 5 to 23% from 1 to 72 h. In contrast, in control mice receiving VivoTrax, MPI signals were mostly observed in the liver with little signals (~3%) from the tumor areas over the 72 h span (Figure 2b,c). Since neither NW–ICG nor VivoTrax has tumor-targeting molecules on the surface, they were presumably passively targeted to tumors via the EPR effect. Mice receiving NW–ICG showed higher levels of MPI signals in tumors compared to those administered with VivoTrax, highlighting the advantage of NW–ICG over VivoTrax for breast cancer imaging in this mouse model.
Figure 2.
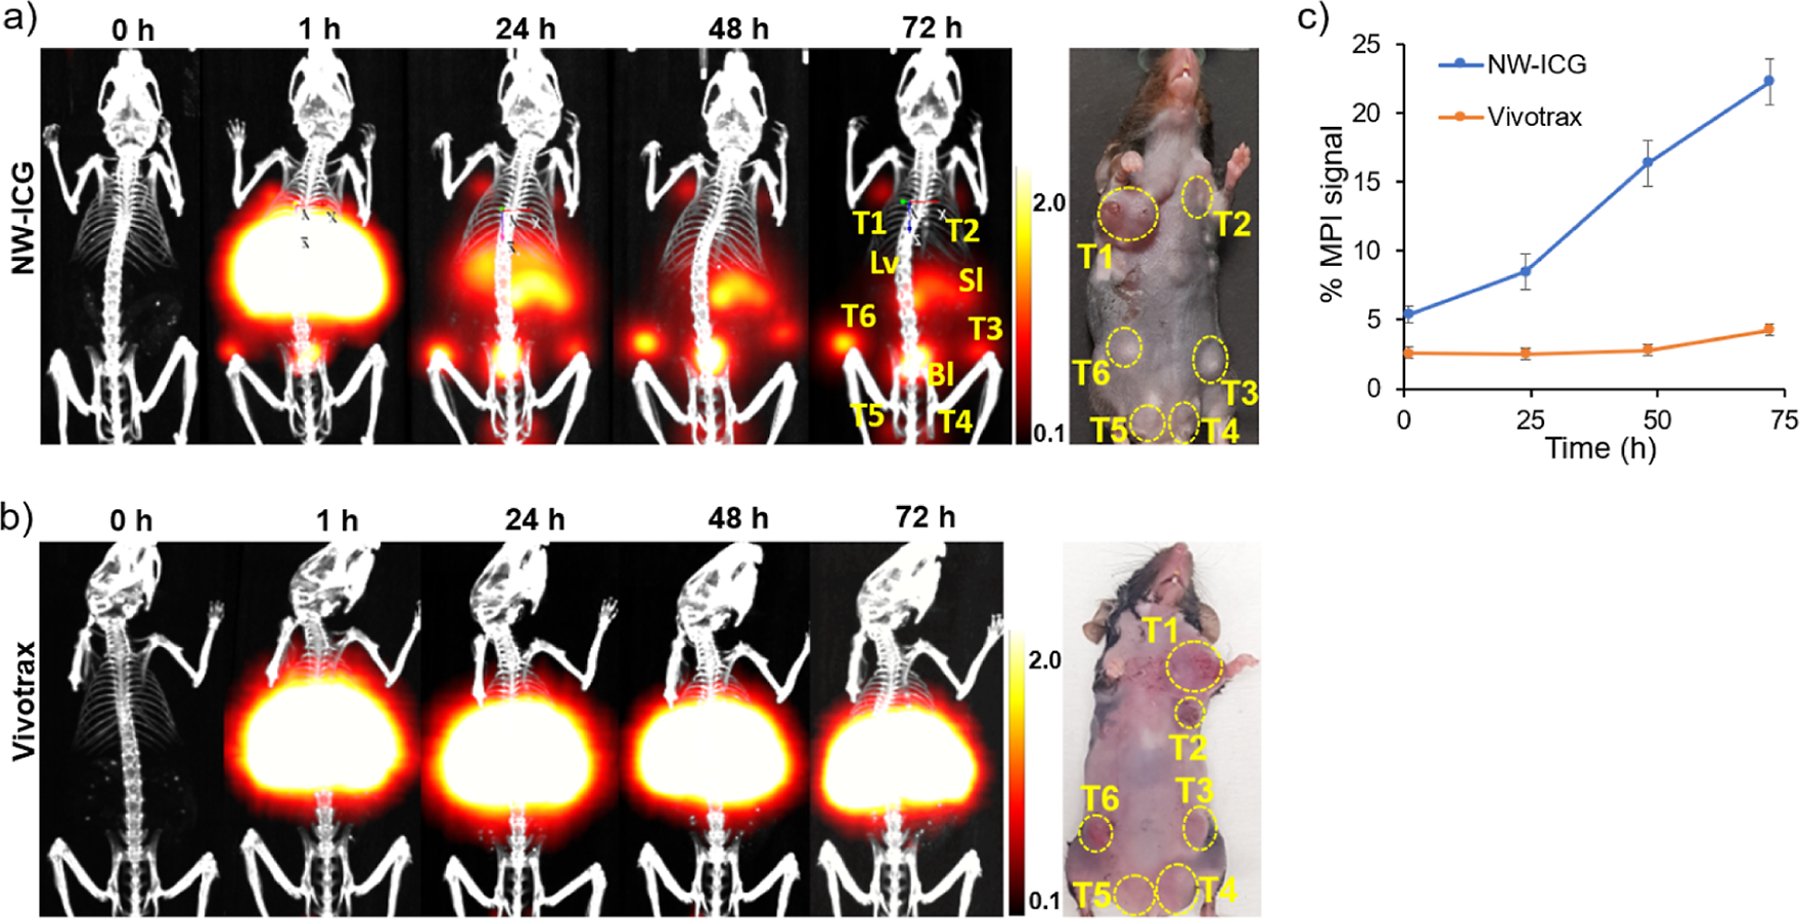
Imaging of MMTV-PyMT mice bearing multiple mammary tumors. (a) Projection of 3D MPI volumes at indicated time points co-registered with a CT skeletal scan of mice injected with NW–ICG. T: tumor, Lv: liver, Bl: bladder, and Sl: spleen (b) projection of 3D MPI volumes at indicated time points co-registered with a CT skeletal scan of mice injected with VivoTrax. To compare the relative signal levels of in vivo MPI images at different time points, the color bars of MPI images in NW–ICG and the control group were all set as 0.1 to 2.0. Thus, some images appeared over-saturated. (c) Relative percentage of MPI signals quantified from tumors in mice over time. For accurate quantification, raw images without signal adjustment (Figure S4) were used.
With ICG covalently attached, NW–ICG enabled fluorescence imaging and detection of breast cancer in addition to MPI. The fluorescence images (Figures 3a) showed increasing fluorescence signals of tumor areas over time from 1 to 72 h post-injection of NW–ICG (Figure 3b), confirming the MPI results.
Figure 3.

(a) Fluorescence images of mice injected with NW–ICG at different time points. (b) Relative percentage of the fluorescence signal from tumors in mice over time.
We next compared the tumor images obtained using MPI, PAI, and fluorescence imaging (Figures 4 and S5) taken pre-injection and 24 h post-injection. The axial 2D MPI/CT frames extracted from 3D MPI/CT images showed well-located positions of tumors, including tumors deep in the body (Figure 4a, axial view). In comparison, for PAI, strong signals were observed on the surface of tumors (Figure 4b). There were few PAI signals from the interior of the tumor, most likely due to the limited penetration depth of excitation light. The fluorescence images mostly showed signals from a part of the superficial tumors (Figure 4c), presumably due to the similar limitation of the penetration depth of light. Fluorescence imaging also detected small amounts of NW–ICG signals in the blood vessels, which were absent in MPI, suggesting a better sensitivity of fluorescence imaging compared to MPI toward targets that were not deep inside the body. Next, quantitative analysis was performed on the images. Following NW–ICG administration, the MPI signals showed the highest tumor to normal tissue ratio (TNR) of 50.4. In comparison, the PAI signals exhibited a TNR of 18.0. The fluorescence imaging signal showed a lower TNR of 2.9, which could be due to the higher background fluorescence signal intensities in normal tissues.
Figure 4.

(a) MPI/CT images and the corresponding axial images at 24 h post-injection. Integration of MPI signals of normal tissue (white oval) and tumor (yellow oval) allowed for quantification of signal ratios of the tumor over normal tissue; (b) in vivo PAI scan. Biodistribution of the NW–ICG multispectral unmixing signal (hot) co-registered with an ultrasound signal (gray). Integration of the NW–ICG PA signal of normal tissue (white oval) and tumor (yellow oval) enabled the calculation of signal ratios of the tumor over normal tissue. (c) Fluorescence images of mice at 24 h post-injection and integration of fluorescence signals in the normal tissue (white oval), tumor (yellow oval), and blood vessel (white arrows) enabled calculation of signal ratios of the tumor over normal tissues. Statistical analysis was performed through one-way ANOVA analysis using GraphPad Prism. ns, non-significant; *, p < 0.05; **, p < 0.01; ***, p < 0.001; ****, p < 0.0001.
Confirmation of Mouse Imaging via Ex Vivo Analysis of the Tissues.
To confirm the in vivo imaging results, mice were euthanized 72 h post-injection, and their organs were extracted and imaged by MPI, PAI, and fluorescence (Figure 5). The biodistribution of NW–ICG was analyzed ex vivo by quantification of MPI (Figure 5a), with the percentage of the MPI signal in excised tumors determined at 37% among the total signals in the organs extracted. Strong PA signals were observed distributed throughout the excised tumor (Figures 5b and S6). This contrasts with the surface localization of signals observed from in vivo PAI images, supporting the idea that the observation of PAI signals in mice only on the tumor surface (Figure 4c) was due to the limited depth of tissue penetration by light for PAI. Fluorescence signals were also present in the liver, kidney, spleen, and all tumors in fluorescence imaging (Figure 5c). Moreover, the excised tumors were imaged by confocal microscopy with a large field of view (FOV) (Figures 5d and S7), which showed strong fluorescence from the majority of cells in the tumor tissues, indicating that NW–ICG nanoparticles were able to access most cells in the tumor.47 To further confirm the presence of NW–ICG in the tumor, excised tumors were stained with Prussian blue stain to detect iron ions. The immediate adjacent slides were subjected to histological analysis via hematoxylin and eosin (H&E) staining (Figure 5e). As shown in Figure 5f, extensive blue color was observed in tumor tissues by the Prussian blue stain, confirming the presence of iron in the tumor.
Figure 5.

(a) Percentage of MPI signals measured ex vivo in main organs extracted from mice receiving NW–ICG. (b) Ex vivo MSOT scan of the tumor. NW–ICG PA signal (hot) co-registered with an ultrasound signal (gray). The scale bar is 5 mm. (c) Ex vivo fluorescence images of mice at 72 h post-injection. T: tumor, Lv: liver, K: kidney, Sl: spleen, H: heart, and L: lung. The scale bar is 10 mm. (d) Confocal image of breast tumor acquired using a custom-made confocal microscope. The scale bar is 40 μm. (e,f) Histological analysis of tumor tissues from mice receiving NW–ICG. (e) H&E stain of the tumor slide and (f) the immediate adjacent tissue stained by Prussian blue (iron showed blue), followed by nuclear fast red counterstain. The scale bars in panels (e,f) are 10 μm.
DISCUSSION
Multimodality imaging is an emerging strategy for cancer imaging because every imaging modality has its own advantages and disadvantages, and complementary imaging can validate the location of tumors and enhance the accuracy of detection. In the synthesis of NW–ICG, ICG was covalently conjugated to the surface of NW, bestowing NIR fluorescence and PA properties to NW–ICG.23 Moreover, NWs have been shown to be biocompatible30–33 and ICG has been approved by the FDA for clinical imaging.22,23,25 The NW–ICG did not exhibit toxicity to cells (Figure S3), indicating the high translational potential of NW–ICG.
For the MPI study of mice, the observation of signals from the bladder indicated that NW–ICG could be excreted through the urinary system, which is consistent with the previous in vivo study of IONPs.48,49 Liver uptake of the NW–ICG was also observed, which is common for nanoprobes in vivo.9,11,15,16,50 NW–ICG was accumulated in the tumor for a longer time than in other organs including liver and spleen. Compared to the commercially available IONP VivoTrax, we found that NW–ICGs are 1.5 times brighter, and their tumor uptake is higher than VivoTrax, as observed in MPI. These observations suggest that NW–ICGs are excellent MPI contrast agents for breast tumor imaging. We observed the inconsistency between intensities of MPI and fluorescence and PAI imaging in ex vivo results. This may be due to different depths of particles in various tissues. Particles that are present closer to the organ surface would appear brighter than those residing deeper in the tissue for PAI and fluorescence imaging.
MPI is an imaging modality with several advantages, including nearly zero background, quantitative nature, no ionizing radiation, and not being limited by tissue penetration depth. With these advantages, MPI showed a 2.8 times higher TNR compared with PAI and a 17.4 times higher TNR over fluorescence imaging in this study. On the other hand, fluorescence imaging and PAI can lead to better sensitivity for superficial tumors.
There are several limitations to our studies. The NW–ICGs utilized in this study do not bear any ligands to selectively target tumors. As a result, the selective accumulation of particles in tumors is most likely due to the EPR effect.38–41 There can be significant variations in the homogeneity and vascularity of tumor tissues, which can impact the EPR effect. To increase the sensitivity and specificity of detection, NW–ICG could be modified with a targeting agent, including peptides, polysaccharides, and antibodies.51–53 Nanoprobes bearing targeting ligands may selectively bind to the tumor and increase tumor uptake. Although we only demonstrated diagnostic cancer imaging in this work, this nanoprobe may also be developed for theranostic application, including image-guided drug delivery, photothermal therapy, and magnetic hyperthermia.11,54–58
CONCLUSIONS
New ICG-conjugated superparamagnetic iron oxide NW was synthesized for breast cancer imaging. The NW–ICGs integrated magnetic, optical, as well as PA properties into one nanoprobe, providing a multimodal imaging system. These nanoprobes generated excellent contrasts in MPI, NIR fluorescence imaging, and PAI, indicating their capacity as a multimodal imaging contrast agent. When evaluated in a clinically relevant spontaneous breast cancer mouse model, the NW–ICGs led to a high tumor-to-normal tissue contrast, especially in MPI. These results demonstrate that NW–ICGs are promising nanoprobes for breast tumor imaging and diagnosis.
MATERIALS AND METHODS
Materials.
Iron(III) chloride hexahydrate (FeCl3·6H2O), iron(II) chloride tetrahydrate (FeCl2·4H2O), dimethyl sulfoxide (DMSO), dextran (MW: 40 kDa), epichlorohydrin, ammonium hydroxide (30% NH4OH), sodium hydroxide (NaOH), and Dulbecco’s modified Eagle medium (DMEM) were purchased from Sigma-Aldrich. CellTiter 96 Aqueous One solution containing 3-(4,5-dimethylthiazol-2-yl)-5-(3-arboxymethoxyphenyl)-2-(4-sulfophenyl)-2H-tetrazolium (MTS) was purchased from Promega. An ultrafiltration disk (100 kDa) and a centrifugal filter MWCO (100 kDa) were purchased from EMD Millipore. ICG NHS ester was ordered from RuixiBiotech.
Synthesis of Aminated NW.
FeCl3·6H2O (1.2 mmol), FeCl2· 4H2O (0.65 mmol), and 2.35 g of dextran (∼40 kDa) were mixed in water (20 mL) and vigorously stirred under nitrogen. A stream of nitrogen was flown over the reaction flask for 1 h to remove oxygen from the reaction flask and improve the magnetic properties of the IONPs. 30% NH4OH solution (0.5 mL) was added dropwise to the above solution with rapid stirring. The resulting greenish suspension was heated to 70 °C for 90 min under a constant stream of nitrogen. The mixture was then cooled, forming black NWs. Ammonium chloride and excess dextran were removed by ultrafiltration through membrane filters with a 100 kDa cutoff. After several washes, the colloidal product was concentrated by ultrafiltration to a total volume of 30 mL.
The resulting colloidal solution of NW in distilled water (30 mL) was mixed with 5 M NaOH (10 mL) and epichlorohydrin (5 mL). The mixture was stirred at room temperature for 24 h to form cross-linked NW. Excess epichlorohydrin was removed by dialysis (14 kDa cutoff) against three changes of distilled water, followed by ultrafiltration five times. The cross-linked NW was then aminated by the addition of 30% NH4OH solution (10 mL), followed by incubation at 37 °C for 36 h. The resulting mixture was dialyzed (14 kDa cutoff) against three changes of distilled water, leading to amine-functionalized NW–NH2.
Synthesis of NW–ICG.
To prepare NW–ICG, ICG NHS ester (0.06 mg) in DMSO (1 mL) was mixed with NW–NH2 (4 mg/mL, 3 mL), and the mixture was stirred in the dark at room temperature for 48 h. The reaction mixture was diluted by water and purified by dialysis (14 kDa cutoff) and ultrafiltration (100 kDa cutoff).
Characterization of NW–ICG.
For each step of NW synthesis, the size and charge of the NWs were monitored by dynamic light scattering using a Zetasizer Nano ZS apparatus (Malvern, U.K.). The absorption and emission of ICG and NW–ICG were measured using the SpectraMax M3 plate reader. The prepared NWs were imaged under a transmission electron microscope (JEM-2200FM) operating at 200 kV using a Gatan multiscan CCD camera with DigitalMicrograph imaging software.
Biocompatibility of NW–ICG.
To evaluate the biocompatibility of NW–ICG, Raw 264.7 cells were cultured in a 96-well plate with DMEM cell culture media containing of 10% of FBS at 37 °C and 5% CO2. The cells were incubated with different concentrations of NW–ICG in cell culture media (0.50, 0.25, and 0.13 mg Fe/mL) for 24 h at 37 °C and 5% CO2. The cells were then incubated with the MTS reagent (16.7% in media) for another 1 h at 37 °C until the brown color developed. The absorption values of the wells were measured at 490 nm with a SpectraMax M3 plate reader.
Mouse Model.
MMTV-PyMT transgenic mice were purchased from The Jackson Laboratory. The female mice spontaneously developed palpable breast cancer in 4 months. All mice were kept in the University Laboratory Animal Resources Facility of Michigan State University. All the experimental procedures and guidelines for the animal study were performed under the approval of the Institutional Animal Care and Use Committee (IACUC) of Michigan State University.
Multimodality Imaging.
MPI was performed on a MOMEN-TUM MPI scanner (Magnetic Insight Inc.). MPI scanning was performed with the following imaging parameters: the scan type: 3D scan; scan mode: standard; Z FOV: 10.0 cm; number of projections: 21; 5.7 T/m gradient. CT imaging was performed on a micro CT system (PerkinElmer) with a speed scan mode (voltage: 90 kV). 3D MPI/CT data reconstruction was processed using VivoQuant software (Magnetic Insight Inc.). The MPI signal from the tumor was integrated through the ROI feature in VivoQuant. The percentage of the MPI signal from the tumor was calculated with the formula: (tumor signal/total signal) × 100%. Fluorescence imaging was performed on a Trilogy Pearl system (LI-COR Biosciences, exposure time: 500 ms; excitation: 785 nm; signal detection: 820 nm). The fluorescence signal from the tumor was integrated using ImageJ. The percentages of relative fluorescence signals from tumor were calculated with the formula: (tumor signal/total signal) × 100%. PAI was performed on a MSOT inVision 256-TF small animal scanner (iThera Medical GmbH). PA images were reconstructed by a standard backprojection algorithm. Then, the reconstruction PA images were fit to a known NW–ICG absorption spectrum, producing NW–ICG unmixed PA images. All PA data were processed using the ViewMSOT software. Excised tissues were placed in an agar (1%, w/w) phantom for ex vivo MSOT. Confocal imaging was performed using a custom-made confocal microscope with a 3 mW 785 nm excitation laser. Fluorescent signals were filtered with a 785 long-pass filter (Semrock, LP02–785RU-25) and obtained using a CMOS camera (Hamamatsu, C11440–42U) with the exposure time of 50 μs.
Histological Analysis.
Dissected tumors were fixed in 10% neutral buffered formalin, processed, and vacuum infiltrated with paraffin on the Sakura VIP 2000 tissue processor, which was followed by embedding. Paraffin blocks were finely sectioned at 5 μm. Slides were manually stained with Prussian blue to detect ferric form of iron. H&E slides were stained on a Leica Autostainer XL. Slides were analyzed using a Nikon Eclipse Ci microscope with a Nikon DS-Fi3 camera (Nikon Instruments Inc.).
Supplementary Material
ACKNOWLEDGMENTS
We are grateful for financial supports from the National Cancer Institute, NIH (R01CA225105 to X.H.), National Science Foundation (NSF) (grant numbers 1808436 and 1918074, to Z.Q.), the Department of Energy (DOE) (grant number 234402, to Z.Q.), and Michigan State University.
Footnotes
The authors declare no competing financial interest.
Contributor Information
Chia-Wei Yang, Department of Chemistry and Institute for Quantitative Health Science and Engineering, Michigan State University, East Lansing, Michigan 48824, United States.
Kunli Liu, Department of Chemistry and Institute for Quantitative Health Science and Engineering, Michigan State University, East Lansing, Michigan 48824, United States.
Cheng-You Yao, Institute for Quantitative Health Science and Engineering and Department of Electrical and Computer Engineering, Michigan State University, East Lansing, Michigan 48824, United States.
Bo Li, Institute for Quantitative Health Science and Engineering and Department of Electrical and Computer Engineering, Michigan State University, East Lansing, Michigan 48824, United States.
Aniwat Juhong, Institute for Quantitative Health Science and Engineering and Department of Electrical and Computer Engineering, Michigan State University, East Lansing, Michigan 48824, United States.
Zhen Qiu, Institute for Quantitative Health Science and Engineering, Department of Electrical and Computer Engineering, and Department of Biomedical Engineering, Michigan State University, East Lansing, Michigan 48824, United States.
Xuefei Huang, Department of Chemistry, Institute for Quantitative Health Science and Engineering, and Department of Biomedical Engineering, Michigan State University, East Lansing, Michigan 48824, United States.
REFERENCES
- (1).Sung H; Ferlay J; Siegel RL; Laversanne M; Soerjomataram I; Jemal A; Bray F Global Cancer Statistics 2020: GLOBOCAN Estimates of Incidence and Mortality Worldwide for 36 Cancers in 185 Countries. Ca-Cancer J. Clin 2021, 71, 209–249. [DOI] [PubMed] [Google Scholar]
- (2).Oeffinger KC; Fontham ET; Etzioni R; Herzig A; Michaelson JS; Shih YC; Walter LC; Church TR; Flowers CR; LaMonte SJ; Wolf AM; DeSantis C; Lortet-Tieulent J; Andrews K; Manassaram-Baptiste D; Saslow D; Smith RA; Brawley OW; Wender R; American Cancer S Breast Cancer Screening for Women at Average Risk: 2015 Guideline Update From the American Cancer Society. J. Am. Med. Assoc 2015, 314, 1599–1614. [DOI] [PMC free article] [PubMed] [Google Scholar]
- (3).Herranz M; Ruibal A Optical imaging in breast cancer diagnosis: the next evolution. J. Oncol 2012, 2012, 863747. [DOI] [PMC free article] [PubMed] [Google Scholar]
- (4).Kunjachan S; Ehling J; Storm G; Kiessling F; Lammers T Noninvasive Imaging of Nanomedicines and Nanotheranostics: Principles, Progress, and Prospects. Chem. Rev 2015, 115, 10907–10937. [DOI] [PMC free article] [PubMed] [Google Scholar]
- (5).Wang P; Kim T; Harada M; Contag C; Huang X; Smith BR Nano-immunoimaging. Nanoscale Horiz 2020, 5, 628–653. [DOI] [PubMed] [Google Scholar]
- (6).Wang L Early Diagnosis of Breast Cancer. Sensors 2017, 17, 1572. [DOI] [PMC free article] [PubMed] [Google Scholar]
- (7).Tomitaka A; Arami H; Huang Z; Raymond A; Rodriguez E; Cai Y; Febo M; Takemura Y; Nair M Hybrid magnetoplasmonic liposomes for multimodal image-guided and brain-targeted HIV treatment. Nanoscale 2017, 10, 184–194. [DOI] [PMC free article] [PubMed] [Google Scholar]
- (8).Tomitaka A; Ota S; Nishimoto K; Arami H; Takemura Y; Nair M Dynamic magnetic characterization and magnetic particle imaging enhancement of magnetic-gold core-shell nanoparticles. Nanoscale 2019, 11, 6489–6496. [DOI] [PMC free article] [PubMed] [Google Scholar]
- (9).Song G; Zheng X; Wang Y; Xia X; Chu S; Rao J A Magneto-Optical Nanoplatform for Multimodality Imaging of Tumors in Mice. ACS Nano 2019, 13, 7750–7758. [DOI] [PubMed] [Google Scholar]
- (10).Tomitaka A; Arami H; Ahmadivand A; Pala N; McGoron AJ; Takemura Y; Febo M; Nair M Magneto-plasmonic nanostars for image-guided and NIR-triggered drug delivery. Sci. Rep 2020, 10, 10115. [DOI] [PMC free article] [PubMed] [Google Scholar]
- (11).Song G; Kenney M; Chen YS; Zheng X; Deng Y; Chen Z; Wang SX; Gambhir SS; Dai H; Rao J Carbon-coated FeCo nanoparticles as sensitive magnetic-particle-imaging tracers with photothermal and magnetothermal properties. Nat. Biomed. Eng 2020, 4, 325–334. [DOI] [PMC free article] [PubMed] [Google Scholar]
- (12).Arami H; Teeman E; Troksa A; Bradshaw H; Saatchi K; Tomitaka A; Gambhir SS; Hafeli UO; Liggitt D; Krishnan KM Tomographic magnetic particle imaging of cancer targeted nanoparticles. Nanoscale 2017, 9, 18723–18730. [DOI] [PMC free article] [PubMed] [Google Scholar]
- (13).Gleich B; Weizenecker J Tomographic imaging using the nonlinear response of magnetic particles. Nature 2005, 435, 1214–1217. [DOI] [PubMed] [Google Scholar]
- (14).Saritas EU; Goodwill PW; Croft LR; Konkle JJ; Lu K; Zheng B; Conolly SM Magnetic particle imaging (MPI) for NMR and MRI researchers. J. Magn. Reson 2013, 229, 116–126. [DOI] [PMC free article] [PubMed] [Google Scholar]
- (15).Yu EY; Bishop M; Zheng B; Ferguson RM; Khandhar AP; Kemp SJ; Krishnan KM; Goodwill PW; Conolly SM Magnetic Particle Imaging: A Novel in Vivo Imaging Platform for Cancer Detection. Nano Lett 2017, 17, 1648–1654. [DOI] [PMC free article] [PubMed] [Google Scholar]
- (16).Makela AV; Gaudet JM; Schott MA; Sehl OC; Contag CH; Foster PJ Magnetic Particle Imaging of Macrophages Associated with Cancer: Filling the Voids Left by Iron-Based Magnetic Resonance Imaging. Mol. Imaging Biol 2020, 22, 958–968. [DOI] [PubMed] [Google Scholar]
- (17).Ntziachristos V; Razansky D Molecular Imaging by Means of Multispectral Optoacoustic Tomography (MSOT). Chem. Rev 2010, 110, 2783–2794. [DOI] [PubMed] [Google Scholar]
- (18).Hudson SV; Huang JS; Yin W; Albeituni S; Rush J; Khanal A; Yan J; Ceresa BP; Frieboes HB; McNally LR Targeted noninvasive imaging of EGFR-expressing orthotopic pancreatic cancer using multispectral optoacoustic tomography. Cancer Res 2014, 74, 6271–6279. [DOI] [PMC free article] [PubMed] [Google Scholar]
- (19).Morscher S; Driessen WH; Claussen J; Burton NC Semi-quantitative Multispectral Optoacoustic Tomography (MSOT) for volumetric PK imaging of gastric emptying. Photoacoustics 2014, 2, 103–110. [DOI] [PMC free article] [PubMed] [Google Scholar]
- (20).Jang Y; Kim H; Yoon S; Lee H; Hwang J; Jung J; Chang JH; Choi J; Kim H Exosome-based photoacoustic imaging guided photodynamic and immunotherapy for the treatment of pancreatic cancer. J. Controlled Release 2021, 330, 293–304. [DOI] [PubMed] [Google Scholar]
- (21).Roberts S; Khera E; Choi C; Navaratna T; Grimm J; Thurber GM; Reiner T Optoacoustic Imaging of Glucagon-like Peptide-1 Receptor with a Near-Infrared Exendin-4 Analog. J. Nucl. Med 2021, 62, 839–848. [DOI] [PMC free article] [PubMed] [Google Scholar]
- (22).Carr JA; Franke D; Caram JR; Perkinson CF; Saif M; Askoxylakis V; Datta M; Fukumura D; Jain RK; Bawendi MG; Bruns OT Shortwave infrared fluorescence imaging with the clinically approved near-infrared dye indocyanine green. Proc. Natl. Acad. Sci. U.S.A 2018, 115, 4465–4470. [DOI] [PMC free article] [PubMed] [Google Scholar]
- (23).Starosolski Z; Bhavane R; Ghaghada KB; Vasudevan SA; Kaay A; Annapragada A Indocyanine green fluorescence in second near-infrared (NIR-II) window. PLoS One 2017, 12, No. e0187563. [DOI] [PMC free article] [PubMed] [Google Scholar]
- (24).Beziere N; Lozano N; Nunes A; Salichs J; Queiros D; Kostarelos K; Ntziachristos V Dynamic imaging of PEGylated indocyanine green (ICG) liposomes within the tumor microenvironment using multi-spectral optoacoustic tomography (MSOT). Biomaterials 2015, 37, 415–424. [DOI] [PubMed] [Google Scholar]
- (25).Qu B; Zhang X; Han Y; Peng X; Sun J; Zhang R IR820 functionalized melanin nanoplates for dual-modal imaging and photothermal tumor eradication. Nanoscale Adv 2020, 2, 2587–2594. [DOI] [PMC free article] [PubMed] [Google Scholar]
- (26).Razansky D; Buehler A; Ntziachristos V Volumetric realtime multispectral optoacoustic tomography of biomarkers. Nat. Protoc 2011, 6, 1121–1129. [DOI] [PubMed] [Google Scholar]
- (27).Desmettre T; Devoisselle JM; Mordon S Fluorescence Properties and Metabolic Features of Indocyanine Green (ICG) as Related to Angiography. Surv. Ophthalmol 2000, 45, 15–27. [DOI] [PubMed] [Google Scholar]
- (28).Ogawa M; Kosaka N; Choyke PL; Kobayashi H In vivo molecular imaging of cancer with a quenching near-infrared fluorescent probe using conjugates of monoclonal antibodies and indocyanine green. Cancer Res 2009, 69, 1268–1272. [DOI] [PMC free article] [PubMed] [Google Scholar]
- (29).Alander JT; Kaartinen I; Laakso A; Pätilä T; Spillmann T; Tuchin VV; Venermo M; Valisuo P A review of indocyanine green fluorescent imaging in surgery. Int. J. Biomed. Imaging 2012, 2012, 940585. [DOI] [PMC free article] [PubMed] [Google Scholar]
- (30).Walsh D; Arcelli L; Ikoma T; Tanaka J; Mann S Dextran templating for the synthesis of metallic and metal oxide sponges. Nat. Mater 2003, 2, 386–390. [DOI] [PubMed] [Google Scholar]
- (31).Park JH; von Maltzahn G; Zhang L; Schwartz MP; Ruoslahti E; Bhatia SN; Sailor MJ Magnetic Iron Oxide Nanoworms for Tumor Targeting and Imaging. Adv. Mater 2008, 20, 1630–1635. [DOI] [PMC free article] [PubMed] [Google Scholar]
- (32).Gu N; Zhang Z; Li Y Adaptive iron-based magnetic nanomaterials of high performance for biomedical applications. Nano Res 2022, 15, 1–17. [Google Scholar]
- (33).Hossaini Nasr S; Tonson A; El-Dakdouki MH; Zhu DC; Agnew D; Wiseman R; Qian C; Huang X Effects of Nanoprobe Morphology on Cellular Binding and Inflammatory Responses: Hyaluronan-Conjugated Magnetic Nanoworms for Magnetic Resonance Imaging of Atherosclerotic Plaques. ACS Appl. Mater. Interfaces 2018, 10, 11495–11507. [DOI] [PMC free article] [PubMed] [Google Scholar]
- (34).Tay ZW; Chandrasekharan P; Zhou XY; Yu E; Zheng B; Conolly S In vivo tracking and quantification of inhaled aerosol using magnetic particle imaging towards inhaled therapeutic monitoring. Theranostics 2018, 8, 3676–3687. [DOI] [PMC free article] [PubMed] [Google Scholar]
- (35).Azargoshasb S; Molenaar L; Rosiello G; Buckle T; van Willigen DM; van de Loosdrecht MM; Welling MM; Alic L; van Leeuwen FWB; Winter A; van Oosterom MN Advancing intraoperative magnetic tracing using 3D freehand magnetic particle imaging. Int. J. Comput. Assist. Radiol. Surg 2022, 17, 211–218. [DOI] [PMC free article] [PubMed] [Google Scholar]
- (36).Park HS; Kim J; Cho MY; Lee H; Nam SH; Suh YD; Hong KS Convenient and effective ICGylation of magnetic nanoparticles for biomedical applications. Sci. Rep 2017, 7, 8831. [DOI] [PMC free article] [PubMed] [Google Scholar]
- (37).Gareev KG; Babikova KY; Postnov VN; Naumisheva EB; Korolev DV Fluorescence imaging of the nanoparticles modified with indocyanine green. J. Phys.: Conf. Ser 2017, 917, 042008. [Google Scholar]
- (38).Maeda H; Wu J; Sawa T; Matsumura Y; Hori K Tumor vascular permeability and the EPR effect in macromolecular therapeutics: a review. J. Controlled Release 2000, 65, 271–284. [DOI] [PubMed] [Google Scholar]
- (39).Maeda H The enhanced permeability and retention (EPR) effect in tumor vasculature: the key role of tumor-selective macromolecular drug targeting. Adv. Enzyme Regul 2001, 41, 189–207. [DOI] [PubMed] [Google Scholar]
- (40).Maeda H Macromolecular therapeutics in cancer treatment: the EPR effect and beyond. J. Controlled Release 2012, 164, 138–144. [DOI] [PubMed] [Google Scholar]
- (41).Kobayashi H; Watanabe R; Choyke PL Improving conventional enhanced permeability and retention (EPR) effects; what is the appropriate target? Theranostics 2013, 4, 81–89. [DOI] [PMC free article] [PubMed] [Google Scholar]
- (42).Sarkar S; Kanchibotla B; Nelson JD; Edwards JD; Anderson J; Tepper GC; Bandyopadhyay S Giant increase in the metal-enhanced fluorescence of organic molecules in nanoporous alumina templates and large molecule-specific red/blue-shift of the fluorescence peak. Nano Lett 2014, 14, 5973–5978. [DOI] [PubMed] [Google Scholar]
- (43).Skardžiu̅tė L; Kazlauskas K; Dodonova J; Bucevičius J; Tumkevičius S; Juršėnas S Optical study of the formation of pyrrolo[2,3-d]pyrimidine-based fluorescent nanoaggregates. Tetrahedron 2013, 69, 9566–9572. [Google Scholar]
- (44).Zhao Z; He B; Nie H; Chen B; Lu P; Qin A; Tang BZ Stereoselective synthesis of folded luminogens with arene-arene stacking interactions and aggregation-enhanced emission. Chem. Commun 2014, 50, 1131–1133. [DOI] [PubMed] [Google Scholar]
- (45).Lin EY; Jones JG; Li P; Zhu L; Whitney KD; Muller WJ; Pollard JW Progression to Malignancy in the Polyoma Middle T Oncoprotein Mouse Breast Cancer Model Provides a Reliable Model for Human Diseases. Am. J. Pathol 2003, 163, 2113–2126. [DOI] [PMC free article] [PubMed] [Google Scholar]
- (46).Maglione JE; Moghanaki D; Young LJT; Manner CK; Ellies LG; Joseph SO; Nicholson B; Cardiff RD; MacLeod CL Transgenic Polyoma Middle-T Mice Model Premalignant Mammary Disease. Cancer Res 2001, 61, 8298–8305. [PubMed] [Google Scholar]
- (47).Yao C-Y; Li B; Qiu Z 2D Au-Coated Resonant MEMS Scanner for NIR Fluorescence Intraoperative Confocal Microscope. Micromachines 2019, 10, 295. [DOI] [PMC free article] [PubMed] [Google Scholar]
- (48).Uchiyama MK; Toma SH; Rodrigues SF; Shimada AL; Loiola RA; Cervantes Rodriguez HJ; Oliveira PV; Luz MS; Rabbani SR; Toma HE; Poliselli Farsky SH; Araki K Ultrasmall cationic superparamagnetic iron oxide nanoparticles as nontoxic and efficient MRI contrast agent and magnetic-targeting tool. Int. J. Nanomed 2015, 10, 4731–4746. [DOI] [PMC free article] [PubMed] [Google Scholar]
- (49).Wei H; Bruns OT; Kaul MG; Hansen EC; Barch M; Wiśniowska A; Chen O; Chen Y; Li N; Okada S; Cordero JM; Heine M; Farrar CT; Montana DM; Adam G; Ittrich H; Jasanoff A; Nielsen P; Bawendi MG Exceedingly small iron oxide nanoparticles as positive MRI contrast agents. Proc. Natl. Acad. Sci. U.S.A 2017, 114, 2325–2330. [DOI] [PMC free article] [PubMed] [Google Scholar]
- (50).Yu EY; Chandrasekharan P; Berzon R; Tay ZW; Zhou XY; Khandhar AP; Ferguson RM; Kemp SJ; Zheng B; Goodwill PW; Wendland MF; Krishnan KM; Behr S; Carter J; Conolly SM Magnetic Particle Imaging for Highly Sensitive, Quantitative, and Safe in Vivo Gut Bleed Detection in a Murine Model. ACS Nano 2017, 11, 12067–12076. [DOI] [PMC free article] [PubMed] [Google Scholar]
- (51).Toy R; Bauer L; Hoimes C; Ghaghada KB; Karathanasis E Targeted nanotechnology for cancer imaging. Adv. Drug Delivery Rev 2014, 76, 79–97. [DOI] [PMC free article] [PubMed] [Google Scholar]
- (52).Vaughan HJ; Green JJ; Tzeng SY Cancer-Targeting Nanoparticles for Combinatorial Nucleic Acid Delivery. Adv. Mater 2020, 32, 1901081. [DOI] [PMC free article] [PubMed] [Google Scholar]
- (53).Marques AC; Costa PJ; Velho S; Amaral MH Functionalizing nanoparticles with cancer-targeting antibodies: A comparison of strategies. J. Controlled Release 2020, 320, 180–200. [DOI] [PubMed] [Google Scholar]
- (54).Kumar CSSR; Mohammad F Magnetic nanomaterials for hyperthermia-based therapy and controlled drug delivery. Adv. Drug Delivery Rev 2011, 63, 789–808. [DOI] [PMC free article] [PubMed] [Google Scholar]
- (55).Hensley D; Tay ZW; Dhavalikar R; Zheng B; Goodwill P; Rinaldi C; Conolly S Combining magnetic particle imaging and magnetic fluid hyperthermia in a theranostic platform. Phys. Med. Biol 2017, 62, 3483–3500. [DOI] [PMC free article] [PubMed] [Google Scholar]
- (56).Du Y; Liu X; Liang Q; Liang X-J; Tian J Optimization and Design of Magnetic Ferrite Nanoparticles with Uniform Tumor Distribution for Highly Sensitive MRI/MPI Performance and Improved Magnetic Hyperthermia Therapy. Nano Lett 2019, 19, 3618–3626. [DOI] [PubMed] [Google Scholar]
- (57).Tay ZW; Chandrasekharan P; Chiu-Lam A; Hensley DW; Dhavalikar R; Zhou XY; Yu EY; Goodwill PW; Zheng B; Rinaldi C; Conolly SM Magnetic Particle Imaging-Guided Heating in Vivo Using Gradient Fields for Arbitrary Localization of Magnetic Hyperthermia Therapy. ACS Nano 2018, 12, 3699–3713. [DOI] [PMC free article] [PubMed] [Google Scholar]
- (58).Périgo EA; Hemery G; Sandre O; Ortega D; Garaio E; Plazaola F; Teran FJ Fundamentals and advances in magnetic hyperthermia. Appl. Phys. Rev 2015, 2, 041302. [Google Scholar]
Associated Data
This section collects any data citations, data availability statements, or supplementary materials included in this article.