

Abstract
Background:
Concentrated animal feeding operations (CAFOs) emit pollutants that can cause negative impacts on human health. The concentration of hog production in North Carolina raises concerns regarding the disproportionate exposure of vulnerable communities to air pollution from CAFOs.
Objectives:
We investigated whether exposure to gaseous ammonia () and hydrogen sulfide () (in 2019) differs between subpopulations by examining demographics, including race/ethnicity, age, educational attainment, language proficiency, and socioeconomic status.
Methods:
We used an Air Monitoring Station (AMS)/Environmental Protection Agency (EPA) Regulatory Model (AERMOD)–based Human Exposure Model (version 3) to estimate ambient concentrations of and from hog farms in Duplin County and its surrounding counties in North Carolina and estimate subsequent exposures of communities within of Duplin County, North Carolina, or the Duplin County Region. We combined estimated exposures with 2016 American Community Summary Census data, at the block group level, using spatial analysis to investigate whether exposures to these pollutants differ by race and ethnicity, age, income, education, and language proficiency. Based on these estimations, we assessed associated exposure risks to the impacted communities and used multivariable regression modeling to evaluate the relationship between average ammonia exposures from Duplin regional hog farms and the presence of vulnerable populations.
Results:
The average [] annual estimated concentration of and in the Duplin County Region is and , respectively. The maximum average annual ambient concentrations are estimated at and for and , respectively. Our descriptive analysis reveals that people of low income, people of color, people with low educational attainment, and the linguistically isolated in the Duplin Region are disproportionately exposed to higher levels of pollutants than the average exposure for residents. Alternatively, our statistical results suggests that after adjusting for covariates, communities of color are associated with 1.70% (95% CI: , 0.44) lower concentrations per 1-SD increase. One-standard deviation increases in the adults with low educational attainment and children years of age is associated with 1.26% (95% CI: , 3.33) and 1.20% (95% CI: , 3.05) higher exposure per 1-SD increase, respectively.
Discussion:
Exposures to and differed by race and ethnicity, educational attainment, language proficiency, and socioeconomic status. The observed associations between exposure to CAFO-generated pollutants and sociodemographic indicators differed among demographics. The disproportionate distribution of hog facilities and resulting pollutant exposures among communities may have adverse environmental and human health impacts, raising environmental justice concerns. https://doi.org/10.1289/EHP11344
Introduction
Over the past three decades, the rapid growth and restructuring of the swine industry in North Carolina has invigorated growing research within the movement to highlight environmental and socioeconomic injustice more effectively. Environmental justice research addresses questions of who receives the most economic benefits from current policies, industrial development and establishment, environmental protection, and the disproportionality of resulting health consequences.1,2 Today, threats of socioeconomic and environmental injustice due to the industrialization of agriculture (both crop and animal) aggravate these issues. We focus this environmental justice analysis on the transformation of the swine industry in North Carolina, once predominantly smaller independent hog farms but now dominated by large, vertically integrated management of hog farms. We examine the resulting disproportionate exposure of toxic air pollutants on neighboring communities composed of predominantly vulnerable populations.
In the mid-1980s to mid-1990s, North Carolina jumped from being the 15th to the 2nd leading state in swine production in the United States with an estimated hog count, greatly outweighing the state’s human population of , according to the United States Department of Agriculture.3–5 The expansion of swine production results in a high volume of waste that is processed using waste management practices.6,7 This waste is channeled from hog houses to lagoons, artificial outdoor storage pits,8 where it is stored for anaerobic decomposition and then sprayed on land.5,9 Airborne emissions are released from confinement houses (i.e., hog houses) through the ventilation system, as well as from lagoons, spray operations, and spray fields through volatilization. These pollutants emitted into the atmosphere include ammonia (), , methanol, acetaldehyde, other volatile organic compounds (VOCs), and particulate matter (PM).6,9–14 Continuing, reacts with hydrochloric acid (HCl), sulfuric acid (), and nitric acid () in the atmosphere to form secondary fine particulate matter [PM in aerodynamic diameter ()] as a mix of ammonium chloride and sulfate and nitrate salts. The process of gas-to-particle conversion of relatively short-lived gaseous to more persistent fine particles can affect local and regional air quality far away from the agricultural sources and impact human health.15,16 Other exposures of concern include odors that can also impact health and quality of life for those who live near these farms.17–19 Water pollution can occur directly from these farms owing to flooding and even without spills from these lagoons through seepage.20,21 The runoff produced by hog concentrated animal feeding operations (CAFOs) waste may contain antibiotic-resistant bacteria, metals, and also pathogens.22
These pollutants can impact health, leading to individual problems for those who are exposed. The contaminants have been associated with respiratory and cardiovascular ailments and premature mortality.23,24 Community members who are located near these industrial hog operations also report lower quality of life. A study in North Carolina provides evidence of adverse effects of exposure on mood. These experiences include unpleasant odors, headaches, and psychological effects, such as tension, depression, anger, and fatigue.25–27 There are also economic concerns because these agricultural operations often remove a higher percentage of funds from rural communities, which was not the case when this industry was dominated by privately owned operations.28
History of Duplin County
The concentration of the pollution-intensive swine industry in the eastern section of North Carolina has become a prominent environmental justice issue.4,28,30 North Carolina retains a high population of impoverished, rural communities of color. The eastern half of North Carolina is located in the region originally named for the dark soils of the southeastern United States but now also named for its racial composition, the Black Belt, alluding to the high population of African Americans residing in rural and poorer environments after the legacies of slavery.31–36 The growth of the Hispanic population in North Carolina had its origins in the 1980s. The state experienced Hispanic population growth rates between 2010 and 2017 wherein the Hispanic population increased by in of North Carolina’s 100 counties.37 Duplin County is composed of White-alone (not Hispanic or Latino) and 50% people of color, with above-average populations of African Americans and Hispanic/Latinos.38 A notable 95% of hog farms are located in the eastern counties of the coastal plain of North Carolina.29 A study in North Carolina has found that people of color, including Blacks, Hispanics, and American Indians, have higher chances of residing near CAFOs.39 Principally, we observe people of color and the impoverished residing in rural communities having to bear the potential burden of dealing with socioeconomic, environmental, or health-related effects of swine waste externalities.
Environmental justice is defined by the U.S. Environmental Protection Agency (EPA) as “the fair treatment and meaningful involvement of all people regardless of race, color, national origin, or income with respect to the development, implementation, and enforcement of environmental laws, regulations, and policies.”40 We identify environmental injustice as the disproportionate exposure and burden of pollution on vulnerable communities, including people of color and the poor. Several studies describe the racial and socioeconomic disparities relating to air pollution.41–43 These studies document the need for further research on quantifying the effects and extent to which these disproportionate exposures exist. More specifically, there is a need for further research on disparities of air pollution exposure based on intensive agricultural sources.
Previous Research
A few studies analyzed racial and socioeconomic disparities in the distribution of polluting industrial facilities by using surveys.44,45 Other studies have used proximity analysis to link distance from CAFOs to adverse health outcomes and disproportionate exposure of pollutants.46–48 One limitation with proximity analysis is that it is an indirect measurement of exposure to air pollution from industries on nearby community members. Ambient pollutant concentrations, which are directly inhaled, result from other factors aside from proximity, including meteorology, surrounding topography and land use, facility inventory, facility housing and processing guidelines, facility waste management practices, and others. It is important to try to quantify the emissions released onto nearby communities to directly estimate the exposures and possible health risks. Wilson and Serre49 found evidence that distance to one or more CAFOs, live animal weight per operation, temperature, wind speed, and wind direction are all important predictors of atmospheric at these locations.
Our study expands upon research conducted by Ogneva-Himmelberger et al.,50 who used an air pollution dispersion model (CALPUFF) and CAFO data within the region to estimate concentrations. Bunton et al.51 assessed the use of monitoring and modeling of emissions from CAFOs and noted that accurate models are required to identify the spatial variability of concentrations over regions affected by CAFOs. From this, an in-depth comprehension of the spatial and temporal variability of pollutant levels can then be used to determine the effect these concentrations have on the health of the residents living near the CAFOs. Models can be applied for research using dispersion on either a local or a regional scale. Other studies have used dispersion modeling to apply to CAFOs and agricultural sources.52,53 Becka et al.54 ran the Air Monitoring Station (AMS)/EPA Regulatory Model (AERMOD) dispersion model55 to assess the model’s abilities to estimate sulfur dioxide concentrations caused by industrial emissions in Muscatine, Iowa.
Motivation
In this study, we employed the Human Exposure Model (version 3; HEM-3), which couples census data with the AERMOD air pollution dispersion model to estimate ambient concentrations of and from CAFOs located within the Duplin County, North Carolina, region. The Duplin County Region is defined as the area that falls within from the Duplin County borders and includes impacts from hog CAFOs in Duplin and its surrounding counties. Our objective is to use an environmental justice framework to investigate exposures to residents located in and near Duplin County. Based on our assumption that exposures would differ by race and ethnicity, age, language, and socioeconomic indicators, we assembled block group-level census data and Duplin regional hog inventory data and conducted a geospatial analysis of the estimated pollutant levels. Using the capabilities of the HEM-3, which includes thresholds for hazardous air pollutants (HAPs), we estimated the exposure risks associated with these pollutant concentrations.
Methods
CAFO Definition and the Animal Feeding Operations Program
We acquired a 2019 list of the North Carolina and National Pollution Discharge Elimination System (NPDES)–permitted swine operations in North Carolina from the North Carolina Department of Environmental Quality (NCDEQ).56,57 Under the Clean Water Act, The U.S. EPA characterizes CAFOs as point sources that are required to be regulated per the NPDES permitting program.58 Furthermore, the U.S. EPA identifies CAFOs as animal farming operations that meet one of three categories: a) animal farming operations that produce manure and have animal units (large facilities), b) facilities that discharge animal waste to waters or have a direct discharge to waters that pass through the facility and come into direct contact with animals or, c) facilities that contribute significantly to the impairment of the quality of a water body.59 The Animal Feeding Operations Program is responsible for the permitting and compliance operations of animal feeding operations across North Carolina. Information detailing the farms that obtained permits was included in the 2019 list from the NCDEQ. This information includes the permit name, facility name, facility location, registered owner, animal regulated and activity, allowable count, number of lagoons, and location, including the latitude/longitude coordinates.
HEM-3 and Environmental Justice Census Data
We used the HEM-3, which is an air pollution exposure model that was implemented by the U.S. EPA for performing risk assessments for sources emitting air toxics to ambient air.60 This model estimates exposure via inhalation only and is intended to assess health risks with respect to pollutants released into the ambient air. The HEM provides ambient air concentrations, as proxies for lifetime exposure, and uses unit risk estimates and inhalation reference concentrations to construct estimates of cancer risk and noncancer hazards, respectively, for the toxic chemicals modeled.
The HEM-3 couples the air pollution dispersion model AERMOD with preprocessed meteorological data and U.S. Census Bureau data at the census block level. The HEM-3 provides results at the block level and at the block group level. In this study, for our purposes, we used 2010 U.S. Census population data, based on census block group internal point locations, as the basis for the human exposure calculations.60
We obtained a demographic breakdown of the census data from the U.S. EPA’s Environmental Justice Screening Tool, EJSCREEN (version 2018).61 This tool combines demographic and environmental data in the form of environmental justice indices. The EJSCREEN data set employs the 2016 American Community Summary (ACS) Data, a 5-y (2012–2016) summary census data set from the U.S. Census Bureau. With this, we used the most recent data available in our analysis to represent the current populations in the United States. This demographic data from the census is reported at the spatial scale of block groups and linked to the HEM-3 to assess the risks by various demographic and socioeconomic groups.
We defined population characteristics as follows:
Low income: population in households where the household income is less than or equal to twice the federal poverty level62
Language: linguistic isolation—defined by the U.S. Census as living in a household in which all members years of age speak a non-English language and speak English less than “very well”63
Race: population self-identified as person of color, or those individuals who do not identify as non-Hispanic White-alone
Education attainment: adults without a high school diploma
Age: years of age considered children, years of age considered older population.
Emissions Factors
In modeling, a common approach to calculating pollutant emissions due to livestock is to multiply the emission factor (with units such as kilograms pollutant per year per animal) by the number of animals within the specified set of agricultural facilities being modeled. emission factors used in our study were developed from a model implemented by Carnegie Mellon University and continued to be used by the U.S. EPA64 within the National Emissions Inventory (version 2; NEI 2014v2). We used an emission factor of calculated directly from the NEI 2014v2.65 factors used in our study were based on research by Rumsey and Aneja.66 From that study, we calculated an emission factor of .
Input Data Processing
We modeled 1,292 CAFO facilities in our primary simulation for Duplin County and six surrounding counties, including Wayne, Lenoir, Jones, Sampson, Onslow, and Pender County, and 483 CAFO facilities in our secondary simulation for Duplin County only. Our model included all of the hog CAFOs currently within Duplin County and the six surrounding counties. In the absence of more precise dimensional information, we approximated each CAFO facility as a diffuse source with dimensions of , centered on the latitude and longitude locations specified in the data set provided by the NCDEQ. The dimensions are appropriate dimensions to model several animal houses and a lagoon, based on Google Earth photos of hog farms. Theobald et al.67 documented an AERMOD analysis of a hog farm. Within their model simulation of emissions from hog farms, there were several sources.67 We supplied these source data as inputs to the HEM-3 in spreadsheets formatted as the model required for its data inputs.
In estimating air pollution impacts, we considered the attenuation air pollutants due to wet and dry deposition. Gas parameters used to estimate deposition are shown in Table 1. Theobald et al.67 used these parameters to compare dispersion models to simulate agricultural emissions. The HEM-3/AERMOD is configured to perform a model simulation for each identified CAFO facility. For each facility, the HEM-3/AERMOD estimates the ambient concentration and deposition impacts for all census blocks within of the center of the hog facility. The ambient impacts from every individual facility simulation are then summed to produce the total cumulative impact of all CAFOs in Duplin and surrounding counties.
Table 1.
Summary of gas parameters used for dispersion modeling by AERMOD (within the HEM-3 framework).
| Gas parameters | Value |
|---|---|
| Diffusion coefficient in air () | |
| Diffusion coefficient in water () | |
| Cuticular resistance () | |
| Henry’s Law coefficient () |
Note: The gas parameters were taken from Theobald et al.67 and were used for both ammonia and hydrogen sulfide CAFOs emissions in Duplin County, North Carolina. AERMOD, Air Monitoring Station (AMS)/Environmental Protection Agency (EPA) Regulatory Model; CAFO, concentrated animal feeding operation; HEM-3, Human Exposure Model (version 3).
AERMOD requires surface and upper air meteorological data that meet specific format requirements. The meteorological surface and upper station used by AERMOD when modeling each facility was specified as the stations closest to each facility and to represent local/regional meteorological patterns. The location of the selected surface station is in Fayetteville, North Carolina (34.99, 78.88 decimal degrees), and in Greensboro, North Carolina (36.08, 79.95 decimal degrees) for the selected upper air station. These are both designated by the code, NC93740.SFC in AERMOD. These represent one National Weather Service observation surface and upper air station in our model used for Duplin County. With this, we note the uncertainty introduced by using only one meteorological station in our model to represent all of Duplin and surrounding counties. If a greater number of meteorological stations were available, the data would have allowed for finer spatial resolution of meteorological patterns and less uncertainty in this regard.
For the facilities with multiple permits, we combined the total hogs allowed under each permit for that facility. For modeling purposes, we defined each facility as a volume source, with a vertical dimension of and an initial release height of (over a per-facility area of ). We modeled seasonal and diurnal variations in emissions using temporal variations for available in the U.S. EPA National Emissions Inventory.65
Application of the Geographic Information System
We used ArcGIS, ArcMap (version 10.8.2; ESRI), to complete the analysis of our data and create our maps. In total, the main data set included 498 census block groups from the 2016 ACS and 1,292 permitted CAFOs. Figure 1 shows the spatial distribution of the permitted CAFOs in Duplin County and its six surrounding counties and the environmental justice study area extending from Duplin County (i.e., the Duplin County Region). Using EJSCREEN, we summarized the demographic population and compared Duplin County, Duplin regional, and U.S. population demographics using data available in the U.S. Census Bureau’s 2010 Decennial Census. Results are displayed in Table 2. In our proximity analysis, we examined the distribution of linguistically isolated people, people of color, persons of low income, and adults without a high school diploma in relation to the location of hog CAFOs in Duplin County and its adjacent block groups. We used choropleth maps to represent this variability of CAFO inventory and our environmental justice factors of interest across and adjacent to Duplin County. Choropleth maps use shaping patterns or symbols to represent statistical data on predetermined geographical areas.
Figure 1.

Spatial distribution of all hog CAFOs within Duplin County () and the six surrounding counties, including Wayne (), Lenoir (), Jones (), Sampson (), Onslow (), and Pender County () in North Carolina for 2019. Our environmental justice analysis extends to from Duplin County, representing the Duplin County Region (). Map represents all CAFOs permitted by the North Carolina Department of Environmental Quality. Note: CAFO, concentrated animal feeding operation.
Table 2.
2010 demographic populations of interest (percentage of total) within Duplin County, North Carolina, and adjacent block groups from the Duplin County boundary (considered the Duplin County Region), with comparison to the United States.
| Duplin County demographic characteristics | Population of Duplin County, NC | Population of Duplin County Region, NC | Population of the United States |
|---|---|---|---|
| Persons of color | 46,196 (45.5) | 322,381 (39.2) | 111,927,986 (36.3) |
| Linguistically isolated | 2,147 (2.1) | 8,612 (1.1) | 14,819,786 (4.8) |
| Low income | 51,794 (51.1) | 353,418 (43.0) | 98,798,572 (32) |
| Less than high school education | 18,255 (18.0) | 92,509 (11.3) | 46,311,830 (15.0) |
| Age (y) | |||
| 15,055 (14.8) | 117,975 (14.4) | 39,210,683 (12.7) | |
| 6,191 (6.1) | 57,223 (7.0) | 20,377,205 (6.6) | |
| Total population | 101,419 (100) | 822,071 (100) | 308,745,538 (100) |
Note: The populations included six demographic subgroups within the total population of Duplin County, representing populations vulnerable owing to their age, income, education level, race/ethnicity, or language capacities. Low income refers to the population in households where the household income is less than or equal to twice the federal poverty level.61,62 Linguistic isolation is defined by the U.S. Census as living in a household in which all members years of age speak a non-English language and speak English less than “very well.”63 Person of color indicates individuals who do not identify as non-Hispanic White-alone.
We used the inverse distance weighted interpolation method (IDW) to estimate the spatial coverage of each pollutant within the county, based on the modeled concentration at each receptor output by the HEM-3. Similarly, Li et al.68 used IDW as a method on a data set of data to estimate population exposure in the United States. Wong et al.69 found that different methods of interpolation do not produce considerably different estimations regarding the air pollutants estimated.
Analytical Methods
For each population demographic, we approximated the average exposure to each pollutant in the Duplin County Region by weighting each block group (within of Duplin County) by its population using a method described by Bell and Ebisu,70 as follows:
| (1) |
where is the county average estimated exposure to each pollutant for persons in a specific demographic (e.g., linguistically isolated individuals); j is the number of block groups in the region with pollutant data (); is the number of persons under demographic i in block group j; and w is the concentration of the pollutant of interest for census block group j. This gives an estimation of average exposure to each pollutant for each demographic group examined in the county, weighted according to population size and pollutant levels in each block group.
We investigated the relationship between each environmental justice demographic and the exposure to pollutants from hog CAFOs by distributing block groups into quintiles for each environmental demographic. We then evaluated our descriptive data of the Duplin Region, by calculating the average concentration level of each pollutant in the different quintile tiers of the demographic variables.
We used multivariable regression analysis to investigate whether some subgroups had higher exposures than others for all block groups within the Duplin County Region. We employed an emission factor for each pollutant, resulting in estimates of and concentrations that were approximately proportional in scale. Thus, we focused on exposure in our regression analysis given that results for would be comparable in scale. Studies have noted how ACS 5-y average estimates can have margins of error of as much as twice the estimate at fine geographic scales such as block groups.71,72 To account for this, we conducted a sensitivity analysis where we included criteria that helped mitigate against measurement error in using the 2016 ACS 5-y estimates. Specifically, we included only block groups whose margin of error was lower than half of the estimate, or where the coefficient of variation (COV) was , as suggested by Folch et al.71 Our final sample set after filtering included 248 block groups.
We fit generalized additive models to examine associations between sociodemographic variables and concentrations in the Duplin County Region. After addressing data quality issues and compiling important sociodemographic factors relevant to our study area in eastern North Carolina, the sociodemographic factors we included are as follows:
Low income: population in households where the household income is less than or equal to twice the federal poverty level62
Race: population self-identified as person of color or those individuals who do not identify as non-Hispanic White-alone
Low education attainment: adults without a high school diploma
Age: years of age considered children, years of age considered older population
Sex: male population.
Furthermore, we tested for spatial autocorrelation using Moran’s I test, and found significant spatial dependence within our estimated concentrations. We adjusted for spatial autocorrelation by using a smoothing function through a single tensor product (spline) on both latitude and longitude for block groups. We conducted a sensitivity analysis for several smoothing functions to assess how an estimate of the association between social factors and hog could change by this function. To validate our functions, we plotted residuals to make sure there was no pattern by which spatial autocorrelation remained. We used our chosen smoothing function on latitude and longitude based on our test for Moran’s I value, residual plots, and, finally, making sure to avoid overfitting our model. The degrees of freedom are selected automatically within the smoothing function. All statistical analyses were performed using RStudio (version 1.4.1717) and the mgcv and mgcViz statistical packages.
We used our models to estimate the percentage change in the concentration exposure with a 1-SD increase in each sociodemographic factor. This analysis investigated the explanatory role of these sociodemographic factors in the context of concentrations contributed by hog farms in the Duplin County Region. We used as our threshold for statistical significance.
In our secondary analysis, we estimated the fringe effects of hog CAFOs outside of Duplin County impacting Duplin residents owing to the dispersion nature of pollutants crossing county boundaries. Given the proximity, we expected Duplin County hogs to have the greatest impact on Duplin County residents, but those who live on the edge of Duplin County may, in fact, be impacted more by CAFOs in neighboring counties. No human subjects approvals were necessary because this research did not include any interaction or intervention with human subjects or include any access to identifiable private information.
Results
Modeling for Duplin CAFOs
The spatial pattern of modeled and concentrations is shown in Figures 2 and 3, respectively. We estimated the average concentration within Duplin County Region to be . The maximum concentration at the modeled HEM-3 receptors was . We estimated average concentration within Duplin County Region to be . The maximum concentrations at the modeled HEM-3 receptors within Duplin County Region was . We highlight hog counts for each county for comparison (Table S1). For example, Sampson County has, comparatively, about the same number of hogs as Duplin County, and the other surrounding counties have a lot fewer hogs.
Figure 2.

Duplin estimated ambient concentrations (annual averages) due to 2019 hog CAFO emissions within Duplin County and surrounding counties. The maximum concentration is estimated to be . We selected the high and low categories, based on the range of minimum and maximum estimated concentration values after interpolation using the kriging method. Note: CAFO, concentrated animal feeding operation; , ammonia.
Figure 3.

Duplin estimated ambient concentrations (annual averages) due to 2019 hog CAFO emissions from Duplin County and surrounding counties. The maximum concentration is estimated at . We selected the high and low categories, based on the range of minimum and maximum estimated concentration values after interpolation using the kriging method. Note: CAFO, concentrated animal feeding operation; , hydrogen sulfide.
Choropleth Maps
Choropleth maps, shown in Figures 4–7 (Table S2), were used to display the spatial distribution of the predicted ambient concentration of and in relation to quintiles of percentage for each of our demographics of interest, linguistically isolated people, people of color, persons of low income, adults without a high school diploma, people years of age, and people years of age for the entire county of Duplin, respectively.
Figure 4.

Hog CAFOs distributed in relation to percentages of linguistically isolated individuals for each block group (from 2016), within and adjacent to Duplin County. The cutoff points (given as percentages) were determined by aggregating the data into quintiles. Each quintile tier is colored to indicate the presence of linguistically isolated people within the block group. The Duplin County border is highlighted. (See Table S2 for block group-specific characteristics.) Note: CAFO, concentrated animal feeding operation; max, maximum.
Figure 7.

Hog CAFOs distributed in relation to percentages of adults without a high school diploma for each block group (from 2016), within and adjacent to Duplin County. The cutoff points (given as percentages) were determined by aggregating the data into quintiles. Each quintile tier is colored to indicate the presence of adults without a high school diploma within the block group. The Duplin County border is highlighted. (See Table S2 for block group-specific characteristics.) Note: CAFO, concentrated animal feeding operation; edu, education; max, maximum.
Figure 5.

Hog CAFOs distributed in relation to percentages of people of color for each block group (from 2016), within and adjacent to Duplin County. The cutoff points (given as percentages) were determined by aggregating the data into quintiles. Each quintile tier is colored to indicate the presence of people of color within the block group. The Duplin County border is highlighted. (See Table S2 for block group-specific characteristics.) Note: CAFO, concentrated animal feeding operation; max, maximum.
Figure 6.

Hog CAFOs distributed in relation to percentages of people with low income for each block group (from 2016), within and adjacent to Duplin County. The cutoff points (given as percentages) were determined by aggregating the data into quintiles. Each quintile tier is colored to indicate the presence of people with low income within the block group. The Duplin County border is highlighted. (See Table S2 for block group-specific characteristics.) Note: CAFO, concentrated animal feeding operation; max, maximum.
These figures show the location of 710 hog farms throughout Duplin County and in neighboring block groups whereby each red dot represents a swine farm with an active permit. The size of the pentagon represents the permitted inventory of each individual CAFO, as shown in the legend. The color shading highlights the proportion of each vulnerable group specified within each block group. The map indicates that pork production occurs all over the county with many of the hog operations stationed in the northern portion of Duplin County. We noted high numbers of adults without a high school diploma, poor people, and people of color scattered throughout the county, but especially in the western and northern sections of Duplin County. However, in the southeastern portion of Duplin County, we found block groups with relatively low numbers of people of color, people of low income, the linguistically isolated, and adults without a high school diploma. We also noted low numbers of children and elderly throughout the county in general.
Figures 4–7 also show that higher numbers of linguistically isolated people were located in the northern and southwestern portion of the county. There were high numbers of people of color along the western portion of the county. Located in these areas of high linguistically isolated people and communities of color were also more CAFO facilities and larger inventories, as indicated by the larger points in the figures.
Similarly, we note the distribution of low income in the county. About 26% of the population in Duplin County makes an income below the family poverty threshold (15,400 of 58,600) as determined using the Consumer Price Index to account for inflation,38 which is higher than the national average of 13.1%. Most of the areas with higher proportions of low-income households are located near the CAFOs with larger inventory of hogs relative to the rest of the county. The majority of areas with higher proportions of low-income households are in census block groups located near the western and northern part of the county. This is also true of the locations of the increasingly high proportions of adults without a high school diploma. Low income and low education attainment are not mutually exclusive.
The vulnerable populations characterized by age show no specific trends spatially within Duplin County (Figures S1 and S2, Table S2, and Excel File S1). The figures show that, in general, there are low populations of elderly and children within Duplin County. It is worth noting, however, that there are higher numbers of children located in the northern portion of Duplin County than in the southern parts.
Weighted Averages Exposure
Figure 8 (Table S3) summarizes the percentage differences in exposure by race, age, income, educational attainment, and language from the average population exposure to , , or concentration, , in the Duplin County Region. All demographic groups examined in this study, except the age group years of age, had exposures higher than the average exposure in the Duplin County Region for each pollutant. Exposure in this context refers merely to the ambient concentration levels to which these groups are exposed. Exposures amid the linguistically isolated were higher than exposures among other vulnerable groups for each pollutant. The linguistically isolated group had exposure levels 65% higher than the average population exposure. The subpopulation of adults without high school diploma had the second highest percentage of exposure among the vulnerable demographic groups examined, with higher exposures than the average. Children ( years of age) had lower exposure than the average exposure and had the lowest estimated exposure for each pollutant. Older persons ( years of age) had more exposure than the average. Thus, both age groups showed roughly similar exposure levels compared with the average population exposure in the Duplin County Region. Because children and elderly are underrepresented in the Duplin population and were estimated to have exposures comparable to average levels within the county, we limit our discussion of the exposure within these two demographics for the purposes of our study. Nonetheless, it should be recognized that these two populations are considered vulnerable populations in general for future studies.
Figure 8.
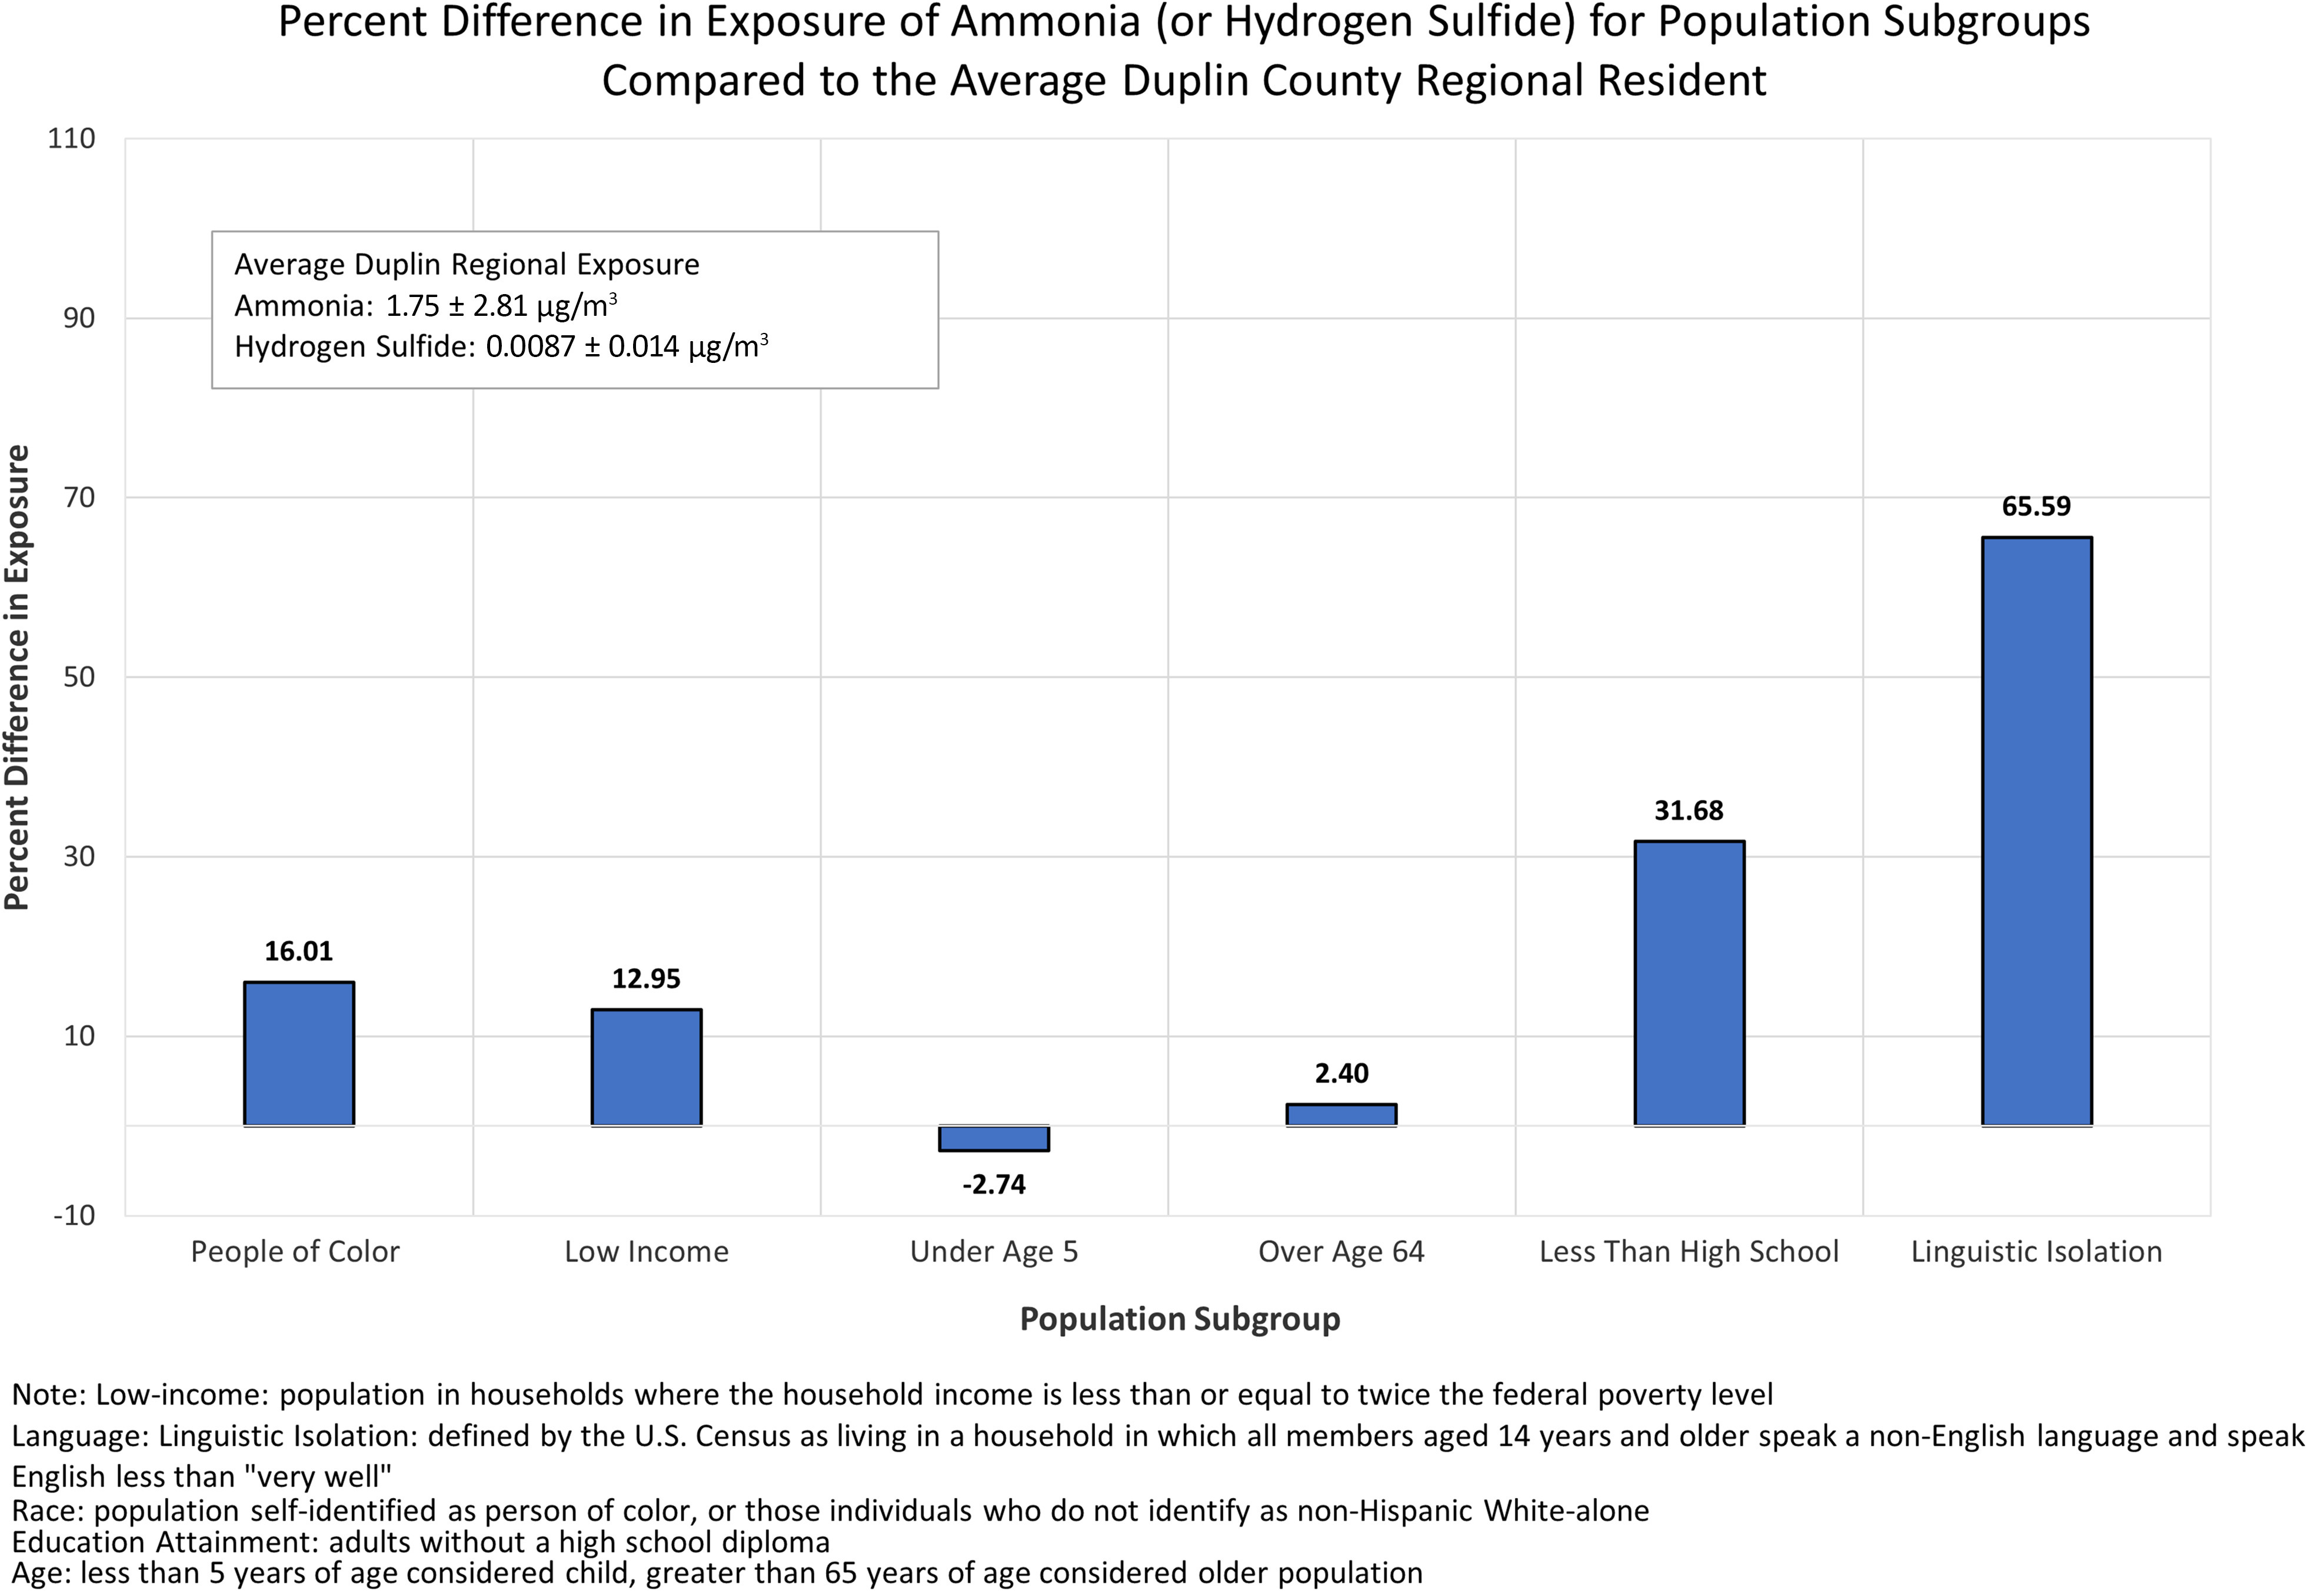
A summary of the percentage differences in exposure (to or ) by race, age, income, educational attainment, and language from the average population of the Duplin County Region solely impacted by Duplin hogs for 2019. Comparing exposures for people of color, low income, years of age, years of age, adults without a high school diploma, and linguistic isolation subgroups to the average Duplin County regional exposure. For the Duplin County Region, the average exposure for and is and , respectively. On the y-axis is percentage difference in exposure to or from the general population in Duplin County. On the x-axis is the subpopulation of interest. Note: , hydrogen sulfide; , ammonia.
Duplin Regional Descriptive Analysis
Table 3 displays the distribution of ambient concentrations of and in Duplin County and neighboring block groups in relation to proportions of linguistically isolated people. Within the lowest quintile for the proportion of the linguistically isolated, there were 22 block groups that contain no people from this subpopulation. In addition, the lowest quintile for the group contains on average the lowest concentrations of both and at and , respectively. Conversely, the highest concentrations on average were seen in the highest two quintiles for the proportion of the linguistically isolated.
Table 3.
Characteristics of 2016 American Community Survey Data block groups () with respect to the linguistically isolated, persons of color, persons of low income, and adults without a high school diploma within the Duplin County Region (including Duplin County, North Carolina, and adjacent block groups).
| Environmental justice variable (percentage) | Quintiles/percentages | Total population () | Average concentration of () | Average concentration of () | Allowable hogs () | Block groups () | CAFOs () |
|---|---|---|---|---|---|---|---|
| Linguistically isolated (%) | 0 | 34,944 | 6.80 | 0.0677 | 1,170,000 | 22 | 269 |
| 0.01–4.58 | 11,869 | 8.09 | 0.0805 | 299,000 | 9 | 67 | |
| 4.58–7.05 | 19,798 | 7.40 | 0.0737 | 613,000 | 10 | 140 | |
| 7.05–12.82 | 16,951 | 8.74 | 0.0870 | 568,000 | 10 | 110 | |
| 12.82–25.57 | 15,198 | 8.97 | 0.0893 | 534,000 | 9 | 91 | |
| Persons of color (%) | 2.75–25.35 | 19,733 | 6.42 | 0.0639 | 499,000 | 12 | 136 |
| 25.35–37.90 | 22,556 | 6.42 | 0.0639 | 611,000 | 12 | 145 | |
| 37.90–55.89 | 18,746 | 7.82 | 0.0778 | 473,000 | 12 | 105 | |
| 55.98–64.46 | 21,260 | 9.53 | 0.0949 | 808,000 | 12 | 156 | |
| 64.46–99.66 | 19,124 | 8.95 | 0.0891 | 929,000 | 13 | 168 | |
| Low income (%) | 26.46–41.45 | 20,385 | 7.18 | 0.0715 | 562,000 | 12 | 135 |
| 41.45–48.31 | 17,846 | 6.42 | 0.0639 | 288,000 | 12 | 72 | |
| 48.31–52.88 | 19,180 | 7.30 | 0.0727 | 567,000 | 12 | 151 | |
| 52.88–62.31 | 21,036 | 9.18 | 0.0914 | 918,000 | 12 | 161 | |
| 62.31–77.38 | 22,972 | 9.07 | 0.0903 | 985,000 | 13 | 191 | |
| Adults without a high school education (%) | 1.42–17.31 | 18,843 | 7.78 | 0.0774 | 581,000 | 12 | 119 |
| 17.31–22.44 | 19,791 | 6.95 | 0.0692 | 611,000 | 12 | 137 | |
| 22.44–27.93 | 17,689 | 7.47 | 0.0743 | 590,000 | 12 | 143 | |
| 27.93–36.15 | 19,345 | 8.06 | 0.0802 | 720,000 | 12 | 151 | |
| 36.15–69.19 | 25,751 | 8.90 | 0.0886 | 818,000 | 13 | 160 |
Note: Block groups are separated into quintiles and within each quintile, the approximate number of hogs, number of CAFOs, and estimated and annual average concentrations are provided. Low income refers to the population in households where the household income is less than or equal to twice the federal poverty level.61,62 Linguistic isolation is defined by the U.S. Census as living in a household in which all members years of age speak a non-English language and speak English less than “very well.”63 Person of color indicates individuals who do not identify as non-Hispanic White-alone. CAFO, concentrated animal feeding operation; , hydrogen sulfide; , ammonia.
There were 136 hog farms in the lowest quintile for the proportion of persons of color, and the average and hydrogen concentrations were and , respectively. Conversely, the highest quintile for this subpopulation contained the highest number of CAFOs, that is, 168 facilities. The highest two quintiles for the proportion of persons of color (from 55.59% to 99.66%) contained the highest average concentrations of ( and ) and ( and ).
Similar analyses are shown in Table 3 presenting the proportions of persons with low income and persons with low educational attainment. The second lowest quintile for the proportion of persons with low income contained the lowest number of CAFOs, 72, and the lowest average concentrations of and at and , respectively. The highest quintile for the proportion of persons with low income contained a higher number of CAFO, 191, and the highest average concentrations of and at and , respectively. This pattern was also seen in the subpopulation of adults without a high school diploma. We note that in the lowest quintile for the percentage of persons with low educational attainment, there were 119 hog CAFOs compared with 160 CAFOs in the highest quintile. We also note that the highest quintile for the proportion of persons with low educational attainment had the highest average concentrations of and of this subgroup, at and .
Regression Analysis
Table 4 presents the results of our adjusted model and associated sociodemographic factors. Our model included 498 census block groups. Within the Duplin County Region, a difference of 1 SD of people of color between block groups was associated with an average estimated percentage difference of [95% confidence intervals (CI): , 0.44] in concentration. Higher exposure is associated with an increase of 1 SD of adults who had less than a high school education (1.26%; 95% CI: , 3.33), households of low income (; 95% CI: , 1.59), children years of age (1.20%; 95% CI: , 3.05), adults years of age (; 95% CI: , 1.32), and males (1.89%; 95% CI: , 3.85). After conducting our sensitivity analysis (Table S4) for several smoothing functions, we chose a model that captures a substantial amount of the spatial autocorrelation and statistically important changes for the association of sociodemographic variables with the percentage change in air pollution exposure in our model (Table 4).
Table 4.
Percentage increase in associated with 1-SD increase in sociodemographic variables for block groups () in the Duplin regional area.
| Model | ||||||
|---|---|---|---|---|---|---|
| Sex | Age | Race | Income | Education | ||
| Population characteristics | Male | y | y | Persons of color | Low income | Low education |
| Percentage increase (95% CI) | 1.89 (, 3.85) | 1.20 (, 3.05) | (, 1.32) | (, 0.44) | (, 1.59) | 1.26 (, 3.33) |
| -Value () | 0.0554 | 0.199 | 0.521 | 0.120 | 0.757 | 0.226 |
Note: Associations were adjusted for the other factors within the model and spatial autocorrelation. Low income refers to the population in households where the household income is less than or equal to twice the federal poverty level.61,62 Person of color indicates individuals who do not identify as non-Hispanic White-alone. The degrees of freedom are reported from the smoothing function used to adjust for spatial autocorrelation. CI, confidence interval; df, degrees of freedom; , ammonia; SD, standard deviation. *, statistically significant at .
Fringe Effect
In our secondary analysis, we estimated emissions solely from Duplin County hogs to estimate the extent of the impact of outer county hog farms on Duplin residents. We display results of the effects of Duplin-only hog farms on Duplin County and the Duplin County Region in the Supplemental Material (Figures S3, S4, and S5, and Table S2 and S5). Owing to the transport and dispersion of pollutants, the emissions of hog farms from neighboring counties will impact the estimated concentrations of and experienced in Duplin, especially along the edges of the county. From Duplin hogs, we estimated average annual and maximum concentrations of to be and , respectively, compared with additional emissions from neighboring counties increasing the concentration to and , respectively. Compared with our primary analysis, we estimated increased differences in exposures from Duplin-only hogs for vulnerable populations, with the linguistically isolated experiencing 101% more exposure and adults without a high school diploma experiencing more than the average resident in the Duplin County Region. Additional results for this secondary analysis are provided in Tables S3 and S5 and Figures S3–S5.
Discussion
Our goal for this study was to estimate ambient concentrations of and emitted from, or secondarily formed from, 1,292 hog CAFOs in Duplin, Wayne, Lenoir, Jones, Onslow, Pender, and Sampson Counties in North Carolina. We conducted our analysis within the Duplin County Region, an area extending from the Duplin County borders, to determine whether communities of color or other disadvantaged populations are disproportionately exposed to these concentrations. To address this question, we evaluated emissions of and from these facilities and then used the HEM-3 model to estimate ambient impacts from these facilities. We used EJSCREEN demographic data from the U.S. Census, to examine the differentiation of pollutant exposure within vulnerable populations residing in Duplin Region communities. We analyzed the locations of 710 hog operations with respect to vulnerable populations within census block groups in and adjacent to Duplin County, North Carolina.
The average annual estimated concentration of the Duplin County farms for the population within Duplin County Region is , with a maximum annual concentration of (estimated at the block level). The average annual estimated concentration within Duplin County Region is , with a maximum annual concentration of estimated at the maximum receptor. There are no monitoring stations within or near Duplin County that currently measure , , or HAPs. The North Carolina Department of Environment and Natural Resources (now the NCDEQ) collected measurements in Clinton, North Carolina, within Sampson County, halting operations in 2015.73,74 The Clinton monitoring station observed an annual average ambient concentration of in 2015 and in 2004. Assessing a 10-y monthly average of the Clinton measurements, the highest concentrations during the month of June was for the 2004 to 2015 period. Our modeled concentration estimates agree with the observational values within a factor of 3. It should be noted that Sampson County is located adjacent to Duplin County and thus does not represent Duplin emissions; however, given Clinton’s proximity, we used these observations as a proxy for comparison in this study.
It is essential to recognize that concentrations from our simulation are a result of modeling emissions from only swine CAFO sources and do not represent other sources of and . The emissions released by poultry CAFOs also represent a sizable portion of total and other pollutants released by animal farming operations. Battye et al.75 estimated that 80% of emissions in North Carolina are accounted for by livestock wastes, whereas other contributing sources include forests, vehicle emissions, fertilizers, and nonagricultural vegetation.
Using geospatial analysis, we introduced an environmental justice aspect by examining how exposures of and differ compared with the average population for demographic subpopulations, including people of color, the linguistically isolated, people of low income, and people with low educational attainment. We found that the majority of Duplin CAFOs were located in areas with higher proportions of people of color and linguistically isolated populations. We also found that the majority of larger CAFOs were found more predominantly in communities of low income. Over half of all hogs were located in block groups with people of color, whereas of Duplin CAFOs were located in these same block groups. This provides evidence that industrialized hog operations are located disproportionately closer to communities of color and low-income communities, as supported by previous studies.39,44,49,76,77
Exposures
Our estimates are consistent with overall trends indicating that the highest pollutant exposures occur in communities of color and in those communities with low income.41–43,50,70 We see above-average exposures of and for linguistically isolated communities and communities of color, of low income, and with low educational attainment. The overall differences were sizable, with the largest difference estimated at 66% higher for linguistically isolated communities than for the average exposure in the Duplin County Region. We also assessed large differences in exposures to people of low educational attainment, estimated at 32% higher, as well as in exposures to people of color, at 16% higher. We observed smaller differences in magnitude for low-income communities, with exposures estimated to be 13% higher than the average exposure in Duplin County.
We computed local exposures for block groups. More precise measures would include spatial heterogeneity,78 as estimated from our model at higher spatial resolutions, as well as exposure from other animal farm types (i.e., poultry), daily activity patterns, occupational exposures at the individual level, indoor exposures (e.g., stoves, fireplaces, environmental tobacco smoke), and individual or average inhalation rates. Most of these factors can differ between populations. We note that because of these factors, our estimates may not reflect the personal exposures of individuals within Duplin County and the region.
In this study, we do not disentangle the interrelationships among the demographic characteristics of race/ethnicity, education, unemployment, poverty, and earnings, for which we see some population characteristics covary (Table S6 shows correlations). For example, race, education, and income were moderately correlated. Bell and Ebisu70 showed how race, education, earnings, and poverty were correlated in their examination of population characteristics in relation to exposure. Future work could examine patterns in population characteristics in relation to and exposures from hog farms. Another limitation is that we did not look at the full range of racial and ethnic subgroups, such as separate analysis and exposure patterns for Hispanics, non-Hispanic Blacks, and others. Categories such as “persons of color” that group all non-White non-Hispanic persons together obscures disparities among and within race and ethnicities.39,41–43 Further research should be conducted to look at the impact upon specific populations of color, other subgroups, and additional environmental justice factors.
Results from our multivariable regression analysis (Table 4) show that populations potentially at risk for higher exposures to (and inherently ) include areas with a higher percentage of adults without a high school education, children years of age, and males, when adjusted for other factors of interest. We also found that areas with a higher percentage of people of color or low-income peoples may experience lower (and inherently ) concentrations when adjusted for other factors. These results highlight associations of populations at the block group level. Our findings suggest the mechanism of how Duplin regional residents exposed to a higher level of may be more related to educational attainment (and other unmeasured factors that make spatial autocorrelation) than income status or racial identity. There may be underlying mechanisms that explains this disparity. One hypothesis could be that hog farm employment does not require higher education and workers tend to reside near their places of employment, and thus we may be seeing the impact reflected among the population of household CAFO workers. This also may be the case for males given that agriculture is a male-dominated industry.79 Further research would need to be conducted on occupational exposure and the exposure upon the household of workers to support this claim. Another possibility is that those who reside near these exposures may not understand the impacts of hog farms, and this could be associated with education status. Thus, this could lead to a disparity of less educated communities residing near these hog farms. Research should be conducted to see how well informed community members are on the externalities of living near hog farms.
Table S7 shows a comparison of results from additional models. We provided results of unadjusted associations, associations adjusted only for measures of spatial autocorrelation, and associations adjusted for spatial autocorrelation and other factors. Our unadjusted models, reveal that areas with a higher percentage of people of color, low-income peoples, and adults with low educational attainment are associated with significantly higher exposures to . These unadjusted associations provide meaningful information. Although these results are descriptive, they indicate environmental justice issues where some people are exposed to higher concentrations of . Last, our sensitivity analysis included 248 census block groups after applying our COV criterion. This analysis reveals consistency with our main findings regarding the direction of our associations although the magnitude of the results varies slightly (Table S8). Future research may consider alternative methods of addressing sociodemographic factors at finer geographic scales.
In our statistical analysis, we adjusted for spatial autocorrelation and other variables because we believed there to be a confounding issue between the variables. Furthermore, evidence from our main regression model and sensitivity analysis suggests that the adjustment for other variables in the model explains why we have contrasting results between our descriptive and statistical analysis regarding communities of color and CAFO-related exposure. It is important to distinguish that these results should be interpreted separately. Although the descriptive analysis reveals that people of color experience higher than average exposure to CAFO-related air pollution, the statistical analysis suggests that CAFO-related air pollution tends to be lower as the presence of people of color increases in the study region. We reaffirm that both findings can be accurate, which even further reveals the complexity of environmental justice issues regarding air pollution for these communities. We have articulated this complexity in our analysis and important factors that impact environmental justice analysis, such as scaling.
Communities of color are experiencing above-average exposure to CAFO-related air pollution and may be susceptible to greater burdens from these impacts on their health and property owing to other systemic concerns. It is also important to recognize the other potential exposures that are released from hog CAFOs, including water pollution, pathogens, and toxic metals. Finally, we highlight that CAFO-related exposure and environmental justice is an underdeveloped research area, and our study reveals the need for more research to be conducted to protect these communities who are most vulnerable to CAFO-related environmental impacts.
Our descriptive analysis has revealed a large disparity of hog farm air pollution exposure among those who may not be proficient in the English language (linguistic isolation). We were unable to conduct further statistical analysis because this study was limited by large uncertainty in this population’s estimate at the block group level. There are thousands of people that fall within this subpopulation within the Duplin Region (Table 1), and it is essential to understand their vulnerability to hog farm exposures. Language barriers and linguistic isolation can contribute to disparities through pathways such as lowered access to health care, employment, and education; hindered ability to navigate housing and government systems; and lesser opportunities for meaningful community engagement (cites).80–82 Future studies should explore methods that quantify the impacts of hog CAFOs among those who experience linguistic isolation, and more broadly, other environmental justice concerns, including air pollution exposure disparities.
Modeling Limitations
In our analysis, we assumed hog facilities to be at full capacity in accordance with their permits throughout the model simulation. In actuality, the farms may operate below their capacity. In addition, inventories change temporally during the year, and we note that it is difficult to model the facility-specific temporal emissions from each facility for 1,292 facilities. Further, we have simplified the spatial representation of the facilities. Modeling scenarios could be improved/modified for future analysis by including facility-specific source locations and source parameters in the model inputs. This also includes considering the type of facility (finishing vs. breeder facility) and size of the facility. Furthermore, collecting more data on management practices, such as the control of and other gases in facilities that use waste amendments and technologies, is needed. Because farm emissions models, used to estimate factors, may not fully capture practices such as manure spread in North Carolina, this is a limitation for using emission factors. Finally, more detailed meteorological data, such as location-specific data, would allow for better characterizing the local atmospheric conditions around facilities in Duplin County and more accurate results for dispersion modeling.
Our HEM-3/AERMOD methodology, which uses the National Air Toxics Assessment, modeled concentrations at the census block level and also reported at the block group level. We have not gathered detailed information on the physical layouts of CAFOs, nor on the actual proximity of neighboring residential neighborhoods, to use the actual location of residential neighborhoods as receptors in the HEM-3 modeling run. Results at the block level are more uncertain given that concentrations are assigned to somewhat arbitrary block centroids as the receptors used by the HEM-3 (which are latitude/longitude locations assigned by the U.S. Census to represent an entire block). As such, the census centroids used as the receptor locations by the HEM-3 in this analysis provide only the general/average location of populations within a block. (A census block typically represents an average location for people.) Future studies should assess similar and additional methodologies to conduct the analysis at smaller geographic scales. Assessing the impacts of biological contamination of hog waste should also be taken into consideration given that studies such as those of Pisanic et al.83 and Heaney et al.84 have looked at hog farms as microbial and pathogenic sources.
Additional studies, based on pollution dispersion modeling with more detailed source and meteorology model inputs and finer-scale population data, will allow for more rigorous environmental justice evaluations. Such evaluations could further characterize the inequitable distribution of CAFOs operations and exposure of neighboring communities to potentially toxic airborne pollutants and odors from these industrialized farming operations in heavily impacted areas such as Duplin County. There is a collective awareness and need to address concerns regarding public health and environmental impacts from the aggregation of CAFOs and increasing concern regarding environmental equity issues resulting from the disproportionate impacts of CAFOs on vulnerable communities.
County and Regional Impacts
One limitation of environmental justice studies invoking air pollution modeling to provide information on air quality impacts is that air pollution is a transboundary phenomenon, whereas decisions to mitigate, reduce, and manage sources of pollution are made within the extent of boundaries of governance whether at the county, regional, or state level. Specifically, for environmental justice communities, it is important to recognize that those who live on the edge of these boundaries may not experience air pollution (and other environmental exposures) as realized by inner boundary sources and thus may not experience the benefits of interventions made at different levels of governance. We completed this secondary analysis to explore the impact of inner and transboundary air pollution from hog CAFOs on environmental justice communities to inform for interventions at the county level and the local level.
From comparing our primary analysis with the secondary analysis, we suspect that we found lower disparities of impact because the differences in spatial distribution of pollution becomes more homogenous as populations in the Duplin County Region experiences the impact of outer Duplin hog farms. The location of these vulnerable populations with reference to hog farms still seems to be a key factor. Further work is needed to quantify pollution in other locations and counties where there tends to be an aggregation of hog farms (Table S1). Last, results from our secondary analysis suggest that vulnerable groups may experience higher exposures from Duplin-only hogs, in agreement with our primary analysis. Additional research should be conducted to compare the impact of local agricultural sources compared with regional sources on vulnerable populations to provide a wholistic understanding of these environmental justice impacts. It is important to understand the impacts of decisions made at various levels of governance—including the county, regional, and state level—how and which communities will benefit from interventions within the boundary of governance in discussing environmental justice reform, and maximize the benefit of these interventions at each level.
Conclusions
Our findings suggest differences in exposure to and among and between specific demographic populations in the Duplin County Region. The disproportionate distribution of hog CAFOs among these populations could contribute to these findings. Further research is necessary to address possible health risks associated with estimates of ambient concentrations/exposures. Furthermore, the exposure differences and the related estimated health risks may only partly determine whether health impacts are more prevalent between populations. The difference in associated health impacts also depends on how these effects are reshaped by factors that contribute to the vulnerability of these populations, such as standard of living. In this study, we suggest that some populations experience higher exposures than others and that health responses within these populations should be considered based on our predicted disproportionate exposures. Last, the disproportionate number of CAFOs among these populations may also impact the economic stability and vitality of these communities within Duplin County.
Our study contributes to a larger reservoir of literature on environmental justice and the employment of exposure assessment within this issue. In this study, we incorporated two gases, namely, and , within our exposure model of choice (i.e., the HEM-3/AERMOD) and estimated the impact on six vulnerable populations, including educational attainment and language as a barrier contributing to vulnerability. Few studies have recognized these as vulnerable groups, and they are seldom included in environmental justice research. Consequently, these populations are very prevalent owing to the demographics of the CAFO workforce and communities living near them in North Carolina. In addition, few studies have used ambient concentrations predicted by dispersion modeling as a proxy for environmental justice assessment.
This study emphasizes the need for further research to understand the role of dispersion modeling in characterizing the spatial and temporal resolution of pollutants when discussing uneven exposure among communities. Our findings also highlight the need for understanding risk assessment with respect to the multiple pollutants released by these animal operations. Throughout, we note the complexity of our research task, hindered by the deficient data on these industries, pollutant emissions, and limitations within our modeling approach. Nonetheless, this work provides insight into the disproportionate exposures of vulnerable communities to pollutants from CAFOs in Duplin County and can be used to motivate and inform future research and encourage aggressive approaches by local, state, and the federal government who have repeatedly acknowledged that hog farm pollution is dangerous and hits communities of color disproportionately.84
In addition to this future work, it is important to note the ongoing COVID-19 pandemic and possible implications that this may have on people impacted by agricultural industries. Hendryx and Luo85 have found that areas with poorer air quality may be at greater COVID-19 risk and resulting fatalities. In addition, Cole et al.86 provided evidence that poor air quality and increases in ambient concentrations are associated with more COVID cases, hospital admissions, and fatalities. Lovarelli et al.87 surmised that agricultural activities such as livestock production have not slowed, and thus the associated pollutant emissions, including , have shown no reductions even though nitrogen oxides and emissions (e.g., from mobile sources) were reduced during the quarantine period. Animal feeding operations emit , a precursor to , , and other VOCs. Essential workers, such as those working in slaughterhouses, could be more vulnerable to COVID-19 owing to underlying conditions, such as exposure to prior pollutants. This pollution will impact community members living near these farms as well. Moreover, the linguistically isolated represent a large proportion of these essential workers. There are limitations to these studies as identified by Villeneuve and Goldberg88 that are due to important sources of bias, but these studies are needed to address these topics. As we continue addressing concerns regarding disparities in health impacts from air pollution and COVID-19, there is also now a need to address the disproportionate susceptibility to COVID-19 of vulnerable populations, including essential workers and communities residing near animal operations and other agricultural activities.
Supplementary Material
Acknowledgments
We thank L. Rivers III for his continued and ongoing assistance and advice during this study. We sincerely thank members of the Air Quality Research Group, of North Carolina State University. We also thank M. Morris and I. Rumsey [U.S. Environmental Protection Agency (EPA)] for their assistance with the National Emissions Inventory data.
The North Carolina Department of Environmental Quality, U.S. Environmental Protection Agency (U.S. EPA), and the North Carolina State Climate Office provided necessary resources throughout the duration of this project. SC&A Incorporated and the U.S. EPA Fate, Exposure, Risk Analysis program aided in the running of the Human Exposure Model.
References
- 1.Edwards B, Ladd AE. 2001. Race, poverty, political capacity and the spatial distribution of swine waste in North Carolina, 1982–1997. North Carolina Geogr 9:51–70. https://www.academia.edu/1446269/Race_poverty_political_capacity_and_the_spatial_distribution_of_swine_waste_in_North_Carolina_1982-1997 [accessed 8 August 2023]. [Google Scholar]
- 2.Nicole W. 2013. CAFOs and environmental justice: the case of North Carolina. Environ Health Perspect 121(6):A182–A189, PMID: , 10.1289/ehp.121-a182. [DOI] [PMC free article] [PubMed] [Google Scholar]
- 3.USDA (U.S. Department of Agriculture). 2019. USDA/NASS QuickStats ad-hoc query tool. National Agricultural Statistics Service. https://quickstats.nass.usda.gov/results/E0B7DDAB-00F5-3AB2-903C-FED0F4A7A3F2 [accessed 19 June 2023].
- 4.Wing S, Cole D, Grant G. 2000. Environmental injustice in North Carolina’s hog industry. Environ Health Perspect 108(3):225–231, PMID: , 10.1289/ehp.00108225. [DOI] [PMC free article] [PubMed] [Google Scholar]
- 5.Aneja VP, Chauhan JP, Walker JT. 2000. Characterization of ammonia emissions from swine waste storage and treatment lagoons. J Geophys Res 105(D9):11535–11545, 10.1029/2000JD900066. [DOI] [Google Scholar]
- 6.Arogo J., Westerman PW, Heber AJ. 2003. A review of ammonia emissions from confined swine feeding operations. Trans ASAE 46(3):805–817, 10.13031/2013.13597. [DOI] [Google Scholar]
- 7.Aneja VP, Arya SP, Kim DS, Rumsey IC, Arkinson HL, Semunegus H, et al. 2008. Characterizing ammonia emissions from swine farms in eastern North Carolina: part 1—conventional lagoon and spray technology for waste treatment. J Air Waste Manag Assoc 58(9):1130–1144, PMID: , 10.3155/1047-3289.58.9.1130. [DOI] [PubMed] [Google Scholar]
- 8.U.S. EPA (U.S. Environmental Protection Agency). 2020. Animal feeding operations (AFOs). https://www.epa.gov/npdes/animal-feeding-operations-afos#regs [accessed 19 June 2023].
- 9.U.S. EPA (U.S. Environmental Protection Agency). 2021. Anaerobic digestion on swine farms. EPA. https://www.epa.gov/agstar/anaerobic-digestion-swine-farms [accessed 13 July 2022].
- 10.Rumsey IC, Aneja VP, Lonneman WA. 2012. Characterizing non-methane volatile organic compounds emissions from a swine concentrated animal feeding operation. Atmos Environ 47:348–357, 10.1016/j.atmosenv.2011.10.055. [DOI] [Google Scholar]
- 11.Cai L, Koziel JA, Lo YC, Hoff SJ. 2006. Characterization of volatile organic compounds and odorants associated with swine barn particulate matter using solid-phase microextraction and gas chromatography–mass spectrometry–olfactometry. J Chromatogr A 1102(1–2):60–72, PMID: , 10.1016/j.chroma.2005.10.040. [DOI] [PubMed] [Google Scholar]
- 12.Blunden J, Aneja VP, Overton JH. 2008. Modeling hydrogen sulfide emissions across the gas–liquid interface of an anaerobic swine waste treatment storage system. Atmos Environ 42(22):5602–5611, 10.1016/j.atmosenv.2008.03.016. [DOI] [Google Scholar]
- 13.Aneja VP, Schlesinger WH, Erisman JW. 2008. Farming pollution. Nat Geosci 1(7):409–411, 10.1038/ngeo236. [DOI] [Google Scholar]
- 14.Aneja VP, Schlesinger WH, Erisman JW. 2009. Effects of agriculture upon the air quality and climate: research, policy and regulations. Environ Sci Technol 43(12):4234–4240, PMID: , 10.1021/es8024403. [DOI] [PubMed] [Google Scholar]
- 15.Baek BH, Aneja VP, Tong Q. 2004. Chemical coupling between ammonia, acid gases, and fine particles. Environ Pollut 129(1):89–98, PMID: , 10.1016/j.envpol.2003.09.022. [DOI] [PubMed] [Google Scholar]
- 16.Zhang Y, Wu SY, Krishnan S, Wang K, Queen A, Aneja VP, et al. 2008. Modeling agricultural air quality: current status, major challenges, and outlook. Atmos Environ 42(14):3218–3237, 10.1016/j.atmosenv.2007.01.063. [DOI] [Google Scholar]
- 17.Burkholder JA, Libra B, Weyer P, Heathcote S, Kolpin D, Thorne PS, et al. 2007. Impacts of waste from concentrated animal feeding operations on water quality. Environ Health Perspect 115(2):308–312, PMID: , 10.1289/ehp.8839. [DOI] [PMC free article] [PubMed] [Google Scholar]
- 18.Burkholder JM, Mallin MA, Glasgow HB Jr, Larsen LM, McIver MR, Shank GC, et al. 1997. Impacts to a coastal river and estuary from rupture of a large swine waste holding lagoon. J Environ Qual 26(6):1451–1466, 10.2134/jeq1997.00472425002600060003x. [DOI] [Google Scholar]
- 19.Huffman RL, Westerman PW. 1995. Estimated seepage losses from established swine waste lagoons in the lower coastal plain of North Carolina. Trans ASAE 38(2):449–453, 10.13031/2013.27852. [DOI] [Google Scholar]
- 20.Tajik M, Muhammad N, Lowman A, Thu K, Wing S, Grant G. 2008. Impact of odor from industrial hog operations on daily living activities. NEW Solut 18(2):193–205, PMID: , 10.2190/NS.18.2.i. [DOI] [PubMed] [Google Scholar]
- 21.Wing S, Wolf S. 2000. Intensive livestock operations, health, and quality of life among eastern North Carolina residents. Environ Health Perspect 108(3):233–238, PMID: , 10.1289/ehp.00108233. [DOI] [PMC free article] [PubMed] [Google Scholar]
- 22.Lowman A, McDonald MA, Wing S, Muhammad N. 2013. Land application of treated sewage sludge: community health and environmental justice. Environ Health Perspect 121(5):537–542, PMID: , 10.1289/ehp.1205470. [DOI] [PMC free article] [PubMed] [Google Scholar]
- 23.Lelieveld J, Evans JS, Fnais M, Giannadaki D, Pozzer A. 2015. The contribution of outdoor air pollution sources to premature mortality on a global scale. Nature 525(7569):367–371, PMID: , 10.1038/nature15371. [DOI] [PubMed] [Google Scholar]
- 24.Lelieveld J, Klingmüller K, Pozzer A, Pöschl U, Fnais M, Daiber A, et al. 2019. Cardiovascular disease burden from ambient air pollution in Europe reassessed using novel hazard ratio functions. Eur Heart J 40(20):1590–1596, PMID: , 10.1093/eurheartj/ehz135. [DOI] [PMC free article] [PubMed] [Google Scholar]
- 25.Schiffman SS, Miller EA, Suggs MS, Graham BG. 1995. The effect of environmental odors emanating from commercial swine operations on the mood of nearby residents. Brain Res Bull 37(4):369–375, PMID: , 10.1016/0361-9230(95)00015-1. [DOI] [PubMed] [Google Scholar]
- 26.Avery RC, Wing S, Marshall SW, Schiffman SS. 2004. Odor from industrial hog farming operations and mucosal immune function in neighbors. Arch Environ Health 59(2):101–108, PMID: , 10.3200/AEOH.59.2.101-108. [DOI] [PubMed] [Google Scholar]
- 27.Horton RA, Wing S, Marshall SW, Brownley KA. 2009. Malodor as a trigger of stress and negative mood in neighbors of industrial hog operations. Am J Public Health 99(suppl 3):S610–S615, PMID: , 10.2105/AJPH.2008.148924. [DOI] [PMC free article] [PubMed] [Google Scholar]
- 28.Donham KJ, Wing S, Osterberg D, Flora JL, Hodne C, Thu KM, et al. 2007. Community health and socioeconomic issues surrounding concentrated animal feeding operations. Environ Health Perspect 115(2):317–320, PMID: , 10.1289/ehp.8836. [DOI] [PMC free article] [PubMed] [Google Scholar]
- 29.Driscoll A, Edwards B. 2015. From farms to factories: the social and environmental consequences of industrial swine production in North Carolina. In: Twenty Lessons in Environmental Sociology. New York, NY: Oxford University Press. [Google Scholar]
- 30.Furuseth OJ. 1997. Restructuring of hog farming in North Carolina: explosion and implosion. Prof Geogr 49(4):391–403, 10.1111/0033-0124.00086. [DOI] [Google Scholar]
- 31.Gibbs RM. 2003. Reconsidering the Southern Black Belt. Rev Reg Stud 33(3):254–263, 10.52324/001c.8429. [DOI] [Google Scholar]
- 32.Austin SDW, Franklin SM, Lewis AK. 2013. The effects of concentrated poverty on Black and White political participation in the Southern Black Belt. Grassroots and Coalitions. Exploring the Possibilities of Black Politics. Mitchell M, ed. New York, NY: Routledge, 57–69. [Google Scholar]
- 33.Morrison MKC. 1987. Black Political Mobilization: Leadership, Power, and Mass Behavior. Albany, NY: State University Of New York Press. [Google Scholar]
- 34.Falk WW, Rankin BH. 1992. The cost of being Black in the Black Belt. Soc Probl 39(3):299–313, 10.2307/3096964. [DOI] [Google Scholar]
- 35.Swanson LE, Harris RP, Skees JR, Williamson L. 1994. African Americans in southern rural regions: the importance of legacy. Rev Black Polit Econ 22(4):109–124, 10.1007/BF02689982. [DOI] [Google Scholar]
- 36.Wimberley RC, Morris LV. 1997. The Southern Black Belt: A National Perspective. Lexington, KY: TVA Rural Studies, University of Kentucky. [Google Scholar]
- 37.Alcalde MC. 2012. The Latino migration experience in North Carolina: new roots in the old North State by Hannah Gill. Lat Am 56(2):189–191, 10.1111/j.1557-203X.2012.01155_6.x. [DOI] [Google Scholar]
- 38.U.S. Census Bureau. 2019. QuickFacts: United States; Duplin County, North Carolina. https://www.census.gov/quickfacts/fact/table/US,duplincountynorthcarolina/PST045219 [accessed 19 June 2023].
- 39.Wing S, Johnston J. 2014. Industrial hog operations in North Carolina disproportionately impact African-Americans, Hispanics and American Indians. http://www.ncpolicywatch.com/wp-content/uploads/2014/09/UNC-Report.pdf [accessed 19 June 2023].
- 40.U.S. EPA. 2020. Environmental justice. https://www.epa.gov/environmentaljustice [accessed 19 June 2023].
- 41.Mikati I, Benson AF, Luben TJ, Sacks JD, Richmond-Bryant J. 2018. Disparities in distribution of particulate matter emission sources by race and poverty status. Am J Public Health 108(4):480–485, PMID: , 10.2105/AJPH.2017.304297. [DOI] [PMC free article] [PubMed] [Google Scholar]
- 42.Clark LP, Millet DB, Marshall JD. 2017. Changes in transportation-related air pollution exposures by race–ethnicity and socioeconomic status: outdoor nitrogen dioxide in the United States in 2000 and 2010. Environ Health Perspect 125(9):097012, PMID: , 10.1289/EHP959. [DOI] [PMC free article] [PubMed] [Google Scholar]
- 43.Tessum CW, Apte JS, Goodkind AL, Muller NZ, Mullins KA, Paolella DA, et al. 2019. Inequity in consumption of goods and services adds to racial–ethnic disparities in air pollution exposure. Proc Natl Acad Sci USA 116(13):6001–6006, PMID: , 10.1073/pnas.1818859116. [DOI] [PMC free article] [PubMed] [Google Scholar]
- 44.Mohai P, Lantz PM, Morenoff J, House JS, Mero RP. 2009. Racial and socioeconomic disparities in residential proximity to polluting industrial facilities: evidence from the Americans’ Changing Lives Study. Am J Public Health 99(suppl 3):S649–S656, PMID: , 10.2105/AJPH.2007.131383. [DOI] [PMC free article] [PubMed] [Google Scholar]
- 45.Wing S, Horton RA, Muhammad N, Grant GR, Tajik M, Thu K. 2008. Integrating epidemiology, education, and organizing for environmental justice: community health effects of industrial hog operations. Am J Public Health 98(8):1390–1397, PMID: , 10.2105/AJPH.2007.110486. [DOI] [PMC free article] [PubMed] [Google Scholar]
- 46.Rasmussen SG, Casey JA, Bandeen-Roche K, Schwartz BS. 2017. Proximity to industrial food animal production and asthma exacerbations in Pennsylvania, 2005–2012. Int J Environ Res Public Health 14(4):362, PMID: , 10.3390/ijerph14040362. [DOI] [PMC free article] [PubMed] [Google Scholar]
- 47.Hooiveld M, Smit LAM, van der Sman-de Beer F, Wouters IM, van Dijk CE, Spreeuwenberg P, et al. 2016. Doctor-diagnosed health problems in a region with a high density of concentrated animal feeding operations: a cross-sectional study. Environ Health 15:24, PMID: , 10.1186/s12940-016-0123-2. [DOI] [PMC free article] [PubMed] [Google Scholar]
- 48.Schultz AA, Peppard P, Gangnon RE, Malecki KMC. 2019. Residential proximity to concentrated animal feeding operations and allergic and respiratory disease. Environ Int 130:104911, PMID: , 10.1016/j.envint.2019.104911. [DOI] [PubMed] [Google Scholar]
- 49.Wilson SM, Serre ML. 2007. Examination of atmospheric ammonia levels near hog CAFOs, homes, and schools in Eastern North Carolina. Atmos Environ 41(23):4977–4987, 10.1016/j.atmosenv.2006.12.055. [DOI] [Google Scholar]
- 50.Ogneva-Himmelberger Y, Huang L, Xin H. 2015. CALPUFF and CAFOs: air pollution modeling and environmental justice analysis in the North Carolina hog industry. ISPRS Int J Geoinf 4(1):150–171, 10.3390/ijgi4010150. [DOI] [Google Scholar]
- 51.Bunton B, O’Shaughnessy P, Fitzsimmons S, Gering J, Hoff S, Lyngbye M, et al. 2007. Monitoring and modeling of emissions from concentrated animal feeding operations: overview of methods. Environ Health Perspect 115(2):303–307, PMID: , 10.1289/ehp.8838. [DOI] [PMC free article] [PubMed] [Google Scholar]
- 52.Cajka J, Deerhake M, Yao C. 2003. Modeling ammonia dispersion from multiple CAFOs using GIS. https://proceedings.esri.com/library/userconf/proc04/docs/pap1381.pdf [accessed 19 June 2023].
- 53.U.S. EPA. 2005. Adoption of a Preferred General Purpose (Flat and Complex Terrain) Dispersion Model and Other Revisions. https://www.epa.gov/sites/default/files/2020-09/documents/appw_05.pdf [accessed 8 August 2023].
- 54.Becka CM. 2014. A Case Study of Sulfur Dioxide Concentrations in Muscatine, Iowa and the Ability for AERMOD to Predict NAAQS Violations [Master’s thesis]. Iowa City, IA: University of Iowa. [Google Scholar]
- 55.U.S. EPA. 2005. Revision to the Guideline on Air Quality Models: adoption of a preferred general purpose (flat and complex terrain) dispersion model and other revisions. Docket # AH-FRL-7990-9, RIN: 2060-AK60. Fed Reg 70(216):68217–68261. https://www.federalregister.gov/documents/2005/11/09/05-21627/revision-to-the-guideline-on-air-quality-models-adoption-of-a-preferred-general-purpose-flat-and [accessed 19 June 2023]. [Google Scholar]
- 56.North Carolina Environmental Management Commission. 2014. Swine Waste Management System General Permit (No. AWG100000). https://files.nc.gov/ncdeq/Water%20Quality/Aquifer%20Protection/AFO/Permits/AWG100000%20Signed%203-7-2014.pdf [accessed 19 June 2023].
- 57.North Carolina Environmental Management Commission. 2017. Swine Waste Management System NPDES General Permit (No. NCA200000). https://files.nc.gov/ncdeq/Swine%20NPDES%20General%20Permit%2012-5-2016.pdf [accessed 19 June 2023].
- 58.U.S. EPA. 1987. Clean Water Act (Section 502). https://www.epa.gov/cwa-404/clean-water-act-section-502-general-definitions [accessed 8 August 2023].
- 59.USDA, U.S. EPA. 1998. Unified National AFO Strategy Executive Summary. https://www.epa.gov/sites/production/files/2015-10/documents/exexsum.pdf [accessed 19 June 2023].
- 60.U.S. EPA. 2019. Multi HEM-3 and RTR Summary Programs User’s Guide. https://www.epa.gov/sites/production/files/2017-06/documents/multi_hem-3_users_guide.pdf [accessed 19 June 2023].
- 61.U.S. EPA. 2019. EJSCREEN. Environmental Justice Mapping and Screening. EJSCREEN Technical Documentation. https://www.epa.gov/sites/production/files/2017-09/documents/2017_ejscreen_technical_document.pdf [accessed 19 June 2023].
- 62.U.S. Census Bureau. 2019. Subject Definitions. https://www.census.gov/programs-surveys/cps/technical-documentation/subject-definitions.html [accessed 19 June 2023].
- 63.Seigel P, Martin E, Bruno R. 2000. Language Use and Linguistic Isolation: Historical Data and Methodological Issues. https://www.census.gov/content/dam/Census/library/working-papers/2001/demo/li-final.pdf [accessed 8 August 2023].
- 64.McQuilling AM, Adams PJ. 2015. Semi-empirical process-based models for ammonia emissions from beef, swine, and poultry operations in the United States. Atmos Environ 120:127–136, 10.1016/j.atmosenv.2015.08.084. [DOI] [Google Scholar]
- 65.U.S. EPA. 2018. Technical Support Document (TSD). Preparation of emissions inventories for the version 7.1 2014 Emissions Modeling Platform for the National Air Toxics Assessment. https://www.epa.gov/sites/production/files/2018‐08/documents/2014v7.1_2014_ emismod_tsd.pdf [accessed 8 August 2023].
- 66.Rumsey IC, Aneja VP, Lonneman WA. 2014. Characterizing reduced sulfur compounds emissions from a swine concentrated animal feeding operation. Atmos Environ 94:458–466, 10.1016/j.atmosenv.2014.05.041. [DOI] [PubMed] [Google Scholar]
- 67.Theobald MR, Løfstrøm P, Walker J, Andersen HV, Pedersen P, Vallejo A, et al. 2012. An intercomparison of models used to simulate the short-range atmospheric dispersion of agricultural ammonia emissions. Environ Model Softw 37:90–102, 10.1016/j.envsoft.2012.03.005. [DOI] [Google Scholar]
- 68.Li L, Zhou X, Kalo M, Piltner R. 2016. Spatiotemporal interpolation methods for the application of estimating population exposure to fine particulate matter in the contiguous U.S. and a real-time web application. Int J Environ Res Public Health 13(8):749, PMID: , 10.3390/ijerph13080749. [DOI] [PMC free article] [PubMed] [Google Scholar]
- 69.Wong DW, Yuan L, Perlin SA. 2004. Comparison of spatial interpolation methods for the estimation of air quality data. J Expo Anal Environ Epidemiol 14(5):404–415, PMID: , 10.1038/sj.jea.7500338. [DOI] [PubMed] [Google Scholar]
- 70.Bell ML, Ebisu K. 2012. Environmental inequality in exposures to airborne particulate matter components in the United States. Environ Health Perspect 120(12):1699–1704, PMID: , 10.1289/ehp.1205201. [DOI] [PMC free article] [PubMed] [Google Scholar]
- 71.Folch DC, Arribas-Bel D, Koschinsky J, Spielman SE. 2016. Spatial variation in the quality of American Community Survey estimates. Demography 53(5):1535–1554, PMID: , 10.1007/s13524-016-0499-1. [DOI] [PubMed] [Google Scholar]
- 72.Bazuin JT, Fraser JC. 2013. How the ACS gets it wrong: the story of the American Community Survey and a small, inner city neighborhood. Appl Geogr 45:292–302, 10.1016/j.apgeog.2013.08.013. [DOI] [Google Scholar]
- 73.NCDEQ (North Carolina Department of Environmental Quality). 2016. Latest ambient monitoring data. Available ambient data by site. https://xapps.ncdenr.org/aq/ambient/AmbtSiteEnvista.jsp [accessed 19 June 2023].
- 74.Shendrikar AD, Steger J, Kimball H, Cornelius W, Yirka M, Bishop R, Joyner N. 2016. Atmospheric ammonia monitoring around hog farm industries in North Carolina [presentation]. https://files.nc.gov/ncdeq/Air%20Quality/monitor/specialstudies/NH3_monitoring_around_hog_farms.pdf [accessed 19 June 2023].
- 75.Battye W, Aneja VP, Rolelle PA. 2003. Evaluation and improvement of ammonia emissions inventories. Atmos Environ 37(27):3873–3883, 10.1016/S1352-2310(03)00343-1. [DOI] [Google Scholar]
- 76.Wilson SM, Howell F, Wing S, Sobsey M. 2002. Environmental injustice and the Mississippi hog industry. Environ Health Perspect 110(suppl 2):195–201, PMID: , 10.1289/ehp.02110s2195. [DOI] [PMC free article] [PubMed] [Google Scholar]
- 77.Kravchenko J, Rhew SH, Akushevich I, Agarwal P, Lyerly HK. 2018. Mortality and health outcomes in North Carolina communities located in close proximity to hog concentrated animal feeding operations. N C Med J 79(5):278–288, PMID: , 10.18043/ncm.79.5.278. [DOI] [PubMed] [Google Scholar]
- 78.Peng RD, Bell ML. 2010. Spatial misalignment in time series studies of air pollution and health data. Biostatistics 11(4):720–740, PMID: , 10.1093/biostatistics/kxq017. [DOI] [PMC free article] [PubMed] [Google Scholar]
- 79.FAO (Food and Agriculture Organization of the United Nations). 2011. Women in Agriculture: Closing the Gender Gap for Development. Nelson S, Sisto I, Crowley E, Villarreal M, eds. Rome, Italy: FAO. [Google Scholar]
- 80.Piller I. 2016. Linguistic Diversity and Social Justice: an Introduction to Applied Sociolinguistics. New York, NY: Oxford University Press. [Google Scholar]
- 81.Mowbray JF. 2017. Linguistic diversity and social justice. An introduction to applied sociolinguistics. Int J Const Law 15(3):875–878, 10.1093/icon/mox063. [DOI] [Google Scholar]
- 82.Jacobson E. 2001. Linguistic genocide in education – or worldwide diversity and human rights? Tove Skutnabb-Kangas. Mahwah, NJ: Erlbaum, 2000. Pp. 785. Appl Psycholinguist 22(3):473–477, 10.1017/S0142716401223091. [DOI] [Google Scholar]
- 83.Pisanic N, Nadimpalli M, Rinsky JL, Stewart J, Wing S, Love DC, et al. 2015. Pig-2-Bac as a biomarker of occupational exposure to pigs and livestock-associated Staphylococcus aureus among industrial hog operation workers. Environ Res 143(pt A):93–97, PMID: , 10.1016/j.envres.2015.09.026. [DOI] [PMC free article] [PubMed] [Google Scholar]
- 84.Hersher R. (2021, January 29). Hope And Skepticism As Biden Promises To Address Environmental Racism. NPR. https://www.npr.org/2021/01/29/956012329/hope-and-skepticism-as-biden-promises-to-address-environmental-racism [accessed 11 August 2023]. [Google Scholar]
- 85.Hendryx M, Luo J. 2020. COVID-19 prevalence and fatality rates in association with air pollution emission concentrations and emission sources. Environ Pollut 265(pt A):115126, PMID: , 10.1016/j.envpol.2020.115126. [DOI] [PMC free article] [PubMed] [Google Scholar]
- 86.Cole MA, Ozgen C, Strobl E. 2020. Air pollution exposure and COVID-19. IZA Discussion Paper No. 13367. https://ssrn.com/abstract=3628242 [accessed 19 June 2023]. [DOI] [PMC free article] [PubMed]
- 87.Lovarelli D, Conti C, Finzi A, Bacenetti J, Guarino M. 2020. Describing the trend of ammonia, particulate matter, and nitrogen oxides: the role of livestock activities in northern Italy during Covid-19 quarantine. Environ Res 191:110048, PMID: , 10.1016/j.envres.2020.110048. [DOI] [PMC free article] [PubMed] [Google Scholar]
- 88.Villeneuve PJ, Goldberg MS. 2020. Methodological considerations for epidemiological studies of air pollution and the SARS and COVID-19 coronavirus outbreaks. Environ Health Perspect 128(9):95001, PMID: , 10.1289/EHP7411. [DOI] [PMC free article] [PubMed] [Google Scholar]
Associated Data
This section collects any data citations, data availability statements, or supplementary materials included in this article.