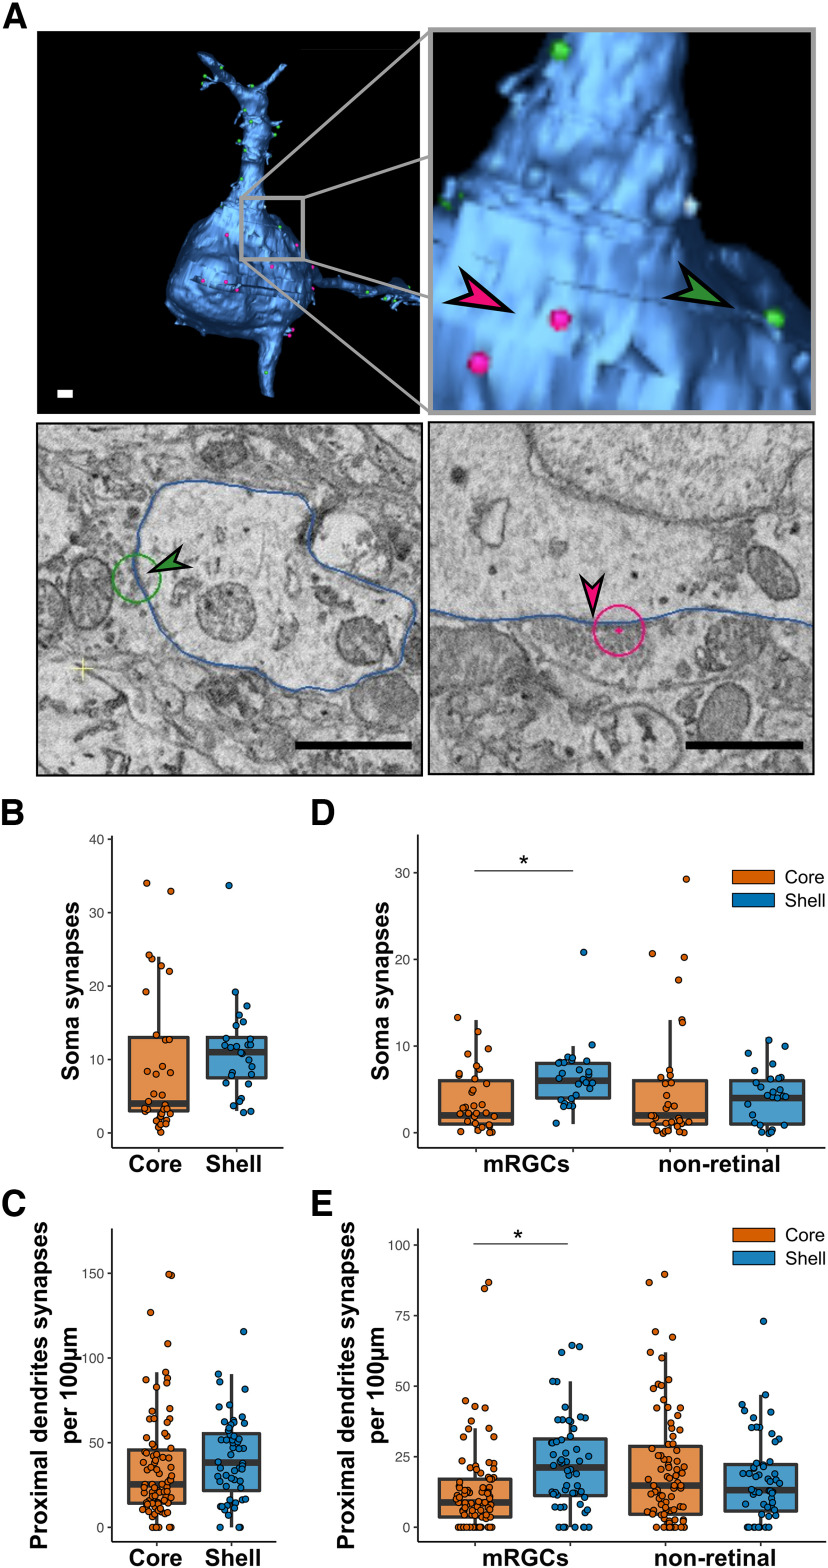
Figure 4.
Proximal connectivity of SCN neurons. A, Representative image of 3D reconstruction of a neuron (upper panel) and EM images of synapses (lower panel) on proximal dendrite (green arrow, left) and on soma (red arrow, right). Scale bar = 1 µm. B, Total number of synapses contacting the soma. N = 27–33. C, Total number of synapses contacting proximal dendrites. N = 56–83. D, Number of mRGCs and nonretinal synapses contacting the soma. N = 27–33. E, Number of mRGCs and nonretinal synapses contacting proximal dendrites. N = 56–83; *p < 0.05.

