

Abstract
Down syndrome (DS), the most common genetic cause of intellectual disability, is associated with lifelong cognitive deficits. However, the mechanisms by which triplication of chromosome 21 genes drive neuroinflammation and cognitive dysfunction are poorly understood. Here, using the Ts65Dn mouse model of DS, we performed an integrated single-nucleus ATAC and RNA-sequencing (snATAC-seq and snRNA-seq) analysis of the adult cortex. We identified cell type-specific transcriptional and chromatin-associated changes in the Ts65Dn cortex, including regulators of neuroinflammation, transcription and translation, myelination, and mitochondrial function. We discovered enrichment of a senescence-associated transcriptional signature in Ts65Dn oligodendrocyte (OL) precursor cells (OPCs) and epigenetic changes consistent with a loss of heterochromatin. We found that senescence is restricted to a subset of OPCs concentrated in deep cortical layers. Treatment of Ts65Dn mice with a senescence-reducing flavonoid rescued cortical OPC proliferation, restored microglial homeostasis, and improved contextual fear memory. Together, these findings suggest that cortical OPC senescence may be an important driver of neuropathology in DS.
Keywords: Down syndrome, oligodendrocyte precursor cells, senescence, single-cell genomics, Trisomy 21
Significance Statement
Down syndrome (DS) is the most common genetic cause of intellectual disability worldwide, is characterized by chronic neuroinflammation, and results in a ubiquitous incidence of early-onset neurodegeneration. Here, we conduct single-nucleus multiomic profiling of the mature adult cortex of an established mouse model of DS, and systematically identify key perturbations in pathways critical for neurogenesis, myelination, and neuroinflammation. We discover the enrichment of a senescence- associated gene signature in trisomic cortical oligodendrocyte (OL) precursor cells (OPCs), validate our computational findings using orthogonal approaches, and show that a senescence-reducing flavonoid significantly improves memory deficits. Our findings suggest that OPC senescence may play a role in the pathogenesis of DS and that senescence-reducing treatment may provide a novel approach for improving cognitive dysfunction in DS.
Introduction
Down syndrome (DS) is the leading genetic cause of intellectual disability worldwide, occurring in one in ∼800 live births (Alexander et al., 2016; Kazemi et al., 2016) and is caused by the complete or partial triplication of Homo sapiens chromosome 21 (Hsa21; Antonarakis et al., 2020). DS results in learning, memory, and language impairment, leading to lifelong cognitive disability, as well as a universal risk of early-onset neurodegeneration (Zigman et al., 2008). Triplication of Hsa21 results in increased expression of ∼225 protein coding genes, as well as >300 genes of unknown coding or functional potential (Sturgeon and Gardiner, 2011). Overexpression of these genes results in complex perturbations of multiple processes involved in neurologic development and function (Becker et al., 1991; Barlow et al., 2002; Chakrabarti et al., 2007, 2010; Jose Luis Olmos-Serrano et al., 2016).
DS presents a unique opportunity for studying changes in brain aging across the lifespan, as DS individuals age prematurely and atypically (Antonarakis et al., 2020). Importantly, gene dosage imbalance of this relatively small set of genes has a profound cascading effect, including secondary changes in expression of hundreds of other genes, leading to the disruption of several pathways important for neurogenesis, cell differentiation, synapse formation and plasticity, axon guidance, immune regulation, and myelination (Becker et al., 1991). By 40 years of age, there is a ubiquitous occurrence of plaques and neurofibrillary tangles of hyperphosphorylated tau suggestive of Alzheimer’s disease (AD), as well as clinical signs of dementia, including changes in sociability, language, and depressive symptoms (Teller et al., 1996; Head et al., 2016; Godfrey and Lee, 2018).
Neuroinflammation, a key driver of neurodegeneration, is a neuropathologic hallmark of DS (Wilcock, 2012; Flores-Aguilar et al., 2020) and is in part driven by triplication of several immune-related genes, including four of the six interferon (IFN) receptors (Sullivan et al., 2016; Kong et al., 2020). There is also triplication of the amyloid precursor protein (APP) and S100β, with the resultant overexpression of the pluripotent neuroinflammatory cytokine interleukin-1 (IL-1; Lu et al., 2011; Wilcock and Griffin, 2013; Head et al., 2016). Importantly, there is evidence of microglial activation in DS humans and mice with trisomy, and reducing overactivated microglia restores cognitive performance in trisomic mice (Pinto et al., 2020). While neuroinflammation is recognized as a core feature of DS, the molecular mechanisms and age-related progression of inflammation-associated aging (“inflammaging”), as well as their relationship to cognitive decline, are poorly understood.
To address these gaps, we leveraged single-nucleus sequencing to identify candidate pathways perturbed in the cortex of a well-characterized DS mouse model. Ts65Dn mice contain a partial triplication of Mus musculus chromosome 16 (Mmu16) corresponding to trisomy of ∼55% of Hsa21 protein-coding orthologs (Reeves et al., 1995; Hyde et al., 2001; Gupta et al., 2016). These trisomic mice recapitulate many of the characteristics of human DS, including learning, memory, and cognitive deficits, as well as developmental delays and oligodendrocyte (OL) maturation deficits (Granholm et al., 2000; Hyde et al., 2001; Gupta et al., 2016). Through multiomic profiling of the mature Ts65Dn cortex, we identify broad disruptions in pathways associated with neuroinflammation, transcriptional and translational regulation, mitochondrial and ribosomal dysfunction, and the integrated stress response (ISR) at both the epigenomic and transcriptomic level across neuronal and non-neuronal cell populations. We further identify a senescence-associated gene signature in Ts65Dn oligodendrocyte precursor cells (OPCs). Using orthogonal approaches, we validate our sequencing findings and discover that a subset of cortical OPCs are prematurely senescent in the trisomic mouse brain. We show that treatment of Ts65Dn mice with the anti-senescence flavonoid, fisetin, has restorative effects on cortical OPCs, including reducing senescence-associated-β-galactosidase (SA-β-gal) activity, increasing proliferation and progenitor abundance, restoring microglia homeostasis, and improving contextual fear memory. In sum, this work identifies novel cellular mechanisms that drive chronic neuroinflammation and cognitive dysfunction in the Ts65Dn mouse model of DS.
Materials and Methods
Mice
All animal experiments were performed in accordance with the Canadian Council of Animal Care policies. Ts65Dn (B6EiC3Sn.BLiA-Ts(1716)65Dn/DnJ, RRID:IMSR_JAX:005252) and euploid controls (B6EiC3Sn.BLiAF1/J, RRID:IMSR_JAX:003647) were purchased from The Jackson Laboratory. Ts65Dn mice were bred with euploid controls as recommended by The Jackson Laboratory. The animals were kept in 12/12 h light/dark cycles with free access to food and chow, and bred at The Center for Phenogenomics in Toronto (ON, Canada). For all studies, the sex of the mice is listed in the respective figure legend. The specific ages of each animal for each experiment are documented in the respective results, method details, and/or figure legends of the study. A cohort of Ts65Dn mice, designated for the Ts65Dn+fisetin condition, received a custom diet produced by Envigo, containing 500 ppm fisetin (Indofine Chemical, catalog #528-48-3) in the chow, starting at three months of age, until euthanasia at six months. Quantitative PCR (qPCR) was performed on genomic DNA extracted from tail tips of all mice to confirm individual genotype. The primers used are as follows: 11,981 mutant A, GTGGCAAGA GACTCAAAT TCAAC; 11,982 mutant A, TGGCTTATT ATTATCAGG GCATTT; OIMR7338 IC forward, CTAGGCCAC AGAATTGAA AGATCT; OIMR7338 IC reverse, GTAGGTGGA AATTCTAGC ATCATCC.
Tissue preparation for immunostaining
For immunostaining, Ts65Dn, fisetin-treated (Ts65Dn+fisetin), and euploid control (CTL) mice were perfused intra-aortically with a solution of 4% paraformaldehyde (PFA; Electron Microscopy Sciences, catalog #15710) while under isoflurane anesthesia (for untreated Ts65Dn and CTL groups at three months: n = 4 per condition; for Ts65Dn, Ts65Dn+fisetin, and CTL groups at six months: n = 3 per condition). Brains were removed and postfixed in 4% PFA at 4°C overnight, then washed 3× for 20 min in 1× PBS before cryoprotection in a 30% sucrose solution at 4°C for 3–4 d. The tissue was embedded in optimal cutting temperature (O.C.T.) compound (Fisher Scientific, catalog #23-730-571) and allowed to solidify at −80°C. Brains were then sliced coronally at 20 μm on a cryostat, mounted onto 0.5% gelatin-coated superfrost slides (Fisher Scientific, catalog #22-037-246) and stored at −80°C long term; three sequential sections were collected per slide.
Senescence-associated-β-galactosidase (SA-β-gal) staining
SA-β-gal activity was determined on coronal brain sections using a SA-β-gal kit (Cell Signaling, catalog #9860) according to the manufacturer’s instructions. Briefly, sections were incubated at 37°C for 20 min, washed 3× in 1× PBS for 10 min each, fixed for 10 min at room temperature using the kit’s fixative agent, and stained overnight for 16 h using the SA-β-gal staining solution (pH 5.9–6.1, prepared according to kit instructions) in a sealed container placed in a CO2-free incubator. The sections were then washed in 1× PBS for 10 min and double-distilled water (DDW) for 5 min before coverslip-mounting with mounting medium (ThermoFisher, catalog #TA030FM).
Immunohistochemistry (IHC)
When coupled with SA-β-gal staining, the above protocol was followed with several additional steps. After washing in 1× PBS and deionized water, slides were washed in TBS (0.1 m Tris-HCl pH 7.5, 0.15 m NaCl in DDW) for 10 min, permeabilized with TBS-Tx (0.4% Triton X-100 in TBS) 2× for 10 min each, and blocked in blocking buffer (5% BSA, 0.4% Triton X-100 in TBS) at room temperature for 1 h. The primary antibody was diluted in blocking buffer and applied to the slide, incubated in a humidified chamber overnight at 4°C. Staining was subsequently performed using HRP/DAB Detection kits (Abcam, catalog #Ab64261 or Ab64259) according to the manufacturer’s instructions, with minor adaptations. Briefly, sections were washed 4× in PBS-T (0.2% Triton X-100 in 1× PBS), incubated with biotinylated goat anti-polyvalent for 10 min, washed 4× in PBS-T, incubated with streptavidin peroxidase for 10 min, washed 4× in PBS-T, incubated with DAB mixture (2% DAB chromogen in DAB substrate) for 8–10 min, washed 4× in 1× PBS, and mounted with mounting medium (ThermoFisher, catalog #TA030FM).
Immunofluorescence (IF)
Sections were incubated at 37°C for 20 min, washed 3× in 1× PBS for 10 min each, and blocked in blocking buffer (10% BSA, 6% NDS, 0.3% Triton X-100 in 1× PBS) at room temperature for 1 h. The primary antibody was diluted in blocking buffer and applied to the slide, incubated in a humidified chamber overnight at 4°C. Sections were subsequently washed 3× in PBS-T (0.1% Triton X-100 in 1× PBS) for 10 min, and incubated with secondary antibody diluted in PBS-T for 1 h at room temperature. After incubation, the sections were washed in 1× PBS and mounted with Fluoromount mounting medium (ThermoFisher, catalog #00-4959-52).
Antigen retrieval (AR)
When necessary, AR was coupled with the above IF protocol following the first round of 3 × 10 min 1× PBS washes. Sodium citrate buffer (10 mm sodium citrate, 0.05% Tween 20, pH 6.0) was created according to Abcam’s protocol for heat-induced epitope retrieval. Slides were completely submerged in the buffer and heated for 20 min at full power in a domestic microwave once the solution reached boiling point. When 20 min elapsed, the heating vessel was removed and cooled in a bath of cold water until it reached room temperature. Slides were then washed 3× in 1× PBS for 10 min each and the aforementioned IF protocol was resumed beginning with 1 h incubation in blocking buffer.
Antibody concentrations
The primary antibodies used for immunostaining were goat anti-PDGFRA (1:250, R&D Systems, catalog #AF1062), rabbit anti-PDGFRA (1:250, Abcam, catalog #Ab203491), rabbit anti-OLIG2 (1:500, Abcam, catalog #Ab136253), mouse anti-CC1 (1:100, CalBioChem, catalog #OP80), rabbit anti-IBA1 (1:500, Wako, catalog #019-19741), rabbit anti-LMNB1 (1:1000, Abcam; used with AR, catalog #Ab16048), mouse anti-NEUN (1:500, Millipore, catalog #Ab377), mouse anti-AQP4 (1:100, Abcam, catalog #Ab9512), rabbit anti-KI67 (1:200, Abcam, catalog #Ab16667), rat anti-CD68 (1:400, Abcam, catalog #Ab53444), rabbit anti-MBP (1:250, Abcam, catalog #Ab40390). The secondary antibodies used for immunostaining were Alexa Fluor 488 goat anti-rabbit IgG (1:500, ThermoFisher, catalog #A-11034), Alexa Fluor 555 goat anti-mouse IgG (1:500, ThermoFisher, catalog #A-21422), Alexa Fluor 555 goat anti-rat IgG (1:500, ThermoFisher, catalog #A-21434), Alexa Fluor 488 donkey anti-goat (1:500, ThermoFisher, catalog #A-11055), Alexa Fluor 555 donkey anti-mouse IgG (1:500, ThermoFisher, catalog #A-31570), and Alexa Fluor 647 donkey anti-rabbit (1:500, ThermoFisher, catalog #A-31573).
Quantitative PCR (qPCR) analysis
mRNA expression levels of Mbp were measured by qPCR analysis. qPCR was performed on six-month tissue for Ts65Dn, Ts65Dn+fisetin, and CTL groups (n = 4 per condition). In brief, cortical tissue was lysed in 1 ml of TRIzol (ThermoFisher, catalog #15596026) and total RNA was isolated according to the manufacturer’s guidelines. cDNA synthesis was performed using 2 μg of total RNA and the iScript cRNA synthesis kit (Bio-Rad, catalog #1708890). qPCR was performed using the Brilliant III ultra-Fast SYBR green qPCR master mix (Agilent Technologies, catalog #600882) according to the manufacturer’s instructions. Data were normalized to Gapdh. The primers used are as follows: Mbp forward, GGC ATC ACA GAA GAG ACC CTC; Mbp reverse, GCA CCC CTG TCA CCG CTA AAG; Gapdh forward, GGG TGT GAA CCA CGA GAA ATA; Gapdh reverse, CTG TGG TCA TGA GCC CTT C. All primers were ordered via Integrated DNA Technologies (IDT).
Slide scanner imaging
Whole slide scans were acquired on a 3DHistech Pannoramic 250 Flash III Slide Scanner using a Zeiss 40 × 0.95 NA objective. The instrument was operated in extended focus mode (seven focal planes spanning a 5-μm axial distance) to capture the entire cell volume across each tissue section. Maximum intensity projections of all the z-planes are shown in the specified figures. One image was captured per slide. The microscope is housed in the Imaging Facility at The Hospital for Sick Children in Toronto (ON, Canada). Digital images obtained from the Slide Scanner were imported to the HALO Image Analysis Platform (Indica Labs, v.3.5.3577.173) for subsequent analysis.
Epifluorescence imaging
Fluorescence images were captured with a 40× water-immersion or 63× oil-immersion objective on a Zeiss Axio Imager.M2 upright microscope. The microscope is housed in the laboratory at The Hospital for Sick Children in Toronto (ON, Canada). Images were evenly captured across Layers II–VI (L2–L6) of the motor and somatosensory cortex on each tissue sample, for a total of 18 images per mouse. All imaging was captured using the Zen Blue software (Carl Zeiss Meditec, v3.3.89.0000). Digital images obtained from the Zeiss Axio Imager.M2 were then imported to the Volocity 3D Image Analysis Software (PerkinElmer, v6.3.1) for subsequent analysis.
Confocal imaging
High magnification brightfield images for OLIG2/SA-β-gal and PDGFRA/SA-β-gal analysis were acquired using a 40×/1.3 objective on Nikon Eclipse Ti2-E equipped with a Nikon DS10 color camera, running NIS Elements acquisition software. The microscope is housed in the Imaging Facility at The Hospital for Sick Children in Toronto (ON, Canada).
Quantification of SA-β-gal activity
Two regions of interest (ROIs) were drawn across L2–L6 of the motor and somatosensory cortex on each tissue sample, for a total of six ROIs of equivalent area per mouse. The Multiplex IHC (v3.1.4) algorithm on HALO was used for all cell type specific SA-β-gal activity quantification and was optimized to detect cell type specific positivity based on the respective DAB staining. An ROI of ∼3-mm2 spanning the motor and somatosensory cortical regions was drawn for quantification of cell counts in the cortex across all biological replicates. A cytoplasmic radius was then measured and the percentage of cells that exhibited SA-β-gal positivity within the nuclear or associated cytoplasmic compartments was calculated.
Quantification of PDGFRA/CC1/OLIG2 and PDGFRA/KI67 co-localization
The HighPlex FL (v4.1.3) algorithm on HALO was used for quantification of PDGFRA/OLIG2/CC1 and KI67/PDGFRA colocalization positivity. The module was optimized to detect OLIG2 or PDGFRA-positive nuclear positivity for quantification of PDGFRA/CC1/OLIG2 and KI67/PDGFRA cell counts, respectively. A cytoplasmic radius was measured and the percentage of cells that exhibited concomitant nuclear or cytoplasmic compartment positivity for other markers was calculated accordingly. Thresholds for nuclear and cytoplasmic positivity were calibrated for each marker set and slide. An ROI of ∼3-mm2 spanning L2–L6 of the motor and somatosensory cortical regions was drawn for quantification of cell counts in the cortex; an ROI of ∼1 mm2 was drawn medially along the corpus callosum (CC) for quantification of cell counts in the CC for all biological replicates.
Quantification of nuclear LMNB1 fluorescence intensity
A total of 100 PDGFRA-positive cells were imaged from Ts65Dn, Ts65Dn+fisetin, or CTL mice (n = 3 per condition) across the motor and somatosensory cortex. Each image contained at least one PDGFRA-positive cell. PDGFRA-positive cells were manually selected and individually assessed for nuclear LMNB1 colocalization within the imaged plane. The threshold for positive LMNB1 staining was set to ∼1 SD from the mean across all sampled images. Normalized LMNB1 intensity was then calculated for each PDGFRA-positive cell by dividing the obtained LMNB1 intensity value by the total surface area of the associated cell.
Quantification of MBP fluorescence intensity
Myelin intensity thresholds were established based on parameters that allowed the maximum capture of MBP stain across all images for all sampled conditions. Normalized MBP intensity was then calculated for each image by dividing the obtained MBP intensity value by the total surface area of all myelin sheaths within the imaged frame. All images were captured across L2–L6 of the motor and somatosensory cortex.
Immunostaining statistical analyses
Statistical significance was evaluated using a two-tailed Student’s t test for all experiments evaluating comparisons between three-month Ts65Dn and CTL mice, or using a one-way ANOVA followed by a post hoc Tukey’s test for all experiments evaluating comparisons between Ts65Dn, Ts65Dn+fisetin, and CTL genotypes. The statistical analyses were performed on R (The R Project for Statistical Computing, RRID:SCR_001905). Error bars displayed on graphs denote the SD from the mean.
Tissue preparation for single-nucleus sequencing
For single-nucleus sequencing, primary somatosensory cortical tissue from six-month Ts65Dn and CTL (n = 3 per condition) mice were microdissected and snap frozen in liquid nitrogen. Frozen tissue was thawed in 1 ml buffer HB (0.25 m sucrose, 25 mm KCl, 5 mm MgCl2, 20 mm Tricine-KOH pH 7.8, 0.15 mm spermine tetrahydrochloride, 0.5 mm spermidine trihydrochloride, 1 mm DTT). The tissue was transferred to a 7-ml dounce; 340 μl 5% IGEPAL CA-630 (Sigma-Aldrich) and 4 ml HB were added to the tissue and the tissue was homogenized with a tight pestle 10–15 times. The sample was transferred to a 15-ml tube and total solution brought to 10 ml with 50% iodixanol; 1 ml 30% iodixanol was layered on top of 1 ml 40% iodixanol in a separate Corex tube (ThermoFisher). The 9 ml sample was layered on top of the iodixanol cushion. The sample was spun at 10,000 × g for 18 min; 1 ml of sample at the 30–40% iodixanol interface was collected. After counting nuclei with a hemocytometer, the sample was diluted to 100,000 nuclei/ml with 30% iodixanol (with RNasin) and subjected to single nuclear droplet encapsulation with the 10× Chromium platform (10× Genomics). Libraries were sequenced using the Illumina NovaSeq 6000 S4 platform at The Center for Applied Genomics (TCAG) at The Hospital for Sick Children in Toronto (ON, Canada).
Single-nucleus RNA-sequencing (snRNA-seq) bioinformatics workflow
Raw reads were converted to FASTQs, mapped to the mm10 mouse reference genome (Ensembl 93), and demultiplexed to generate a per-cell count matrix using the CellRanger pipeline (10× Genomics). Cells from all snRNA-seq experiments were combined into a single Seurat object dataset and filtered through the Seurat pipeline (v4.3.0; Hao et al., 2021) using default parameters. Low-quality cells with unique feature counts >2500 or <200 and >5% mitochondrial counts were excluded. The data was then log-normalized and scaled by the default scale factor of 10,000. The top variable features and principal components were then calculated using default values, returning 2000 features for the dataset. A second round of scaling shifted the expression of each gene so that mean expression across cells was 0 and variance across cells was 1. Linear dimensional reduction was performed and the dimensionality of the dataset was determined. Clustering was performed by constructing a KNN graph and applying the Louvain algorithm. Dimensional reduction was performed with default values for uniform manifold approximation and projection (UMAP) and individual clusters were annotated based on expression of lineage-specific markers.
Differential gene expression (DGE) analysis
Differential gene expression (DGE) between the two conditions (Ts65Dn vs CTL) for each cell type was assessed with the Seurat FindMarkers function using default MAST parameters and a log-fold change (logFC) threshold of 0.1. Benjamini–Hochberg corrected p-values were used for significance. Genes with false discovery rate (FDR) < 0.05 met statistical criteria for significant differential expression. Major cell type annotations were assigned to clusters by manual inspection of canonical marker gene signals and confirmed through scPred’s reference-based mapping approach (v1.9.2; Alquicira-Hernandez et al., 2019) using the Allen Brain Atlas whole cortex and hippocampus 10× dataset (Yao et al., 2021).
Ligand-receptor (LR) analysis
Cell-cell communication between all cortical cell types was identified based on ligand-receptor (LR) analysis conducted using CellChat (v1.6.0; S. Jin et al., 2021). Default parameters between the two conditions (Ts65Dn vs CTL) were employed. CellChat infers biologically significant LR pairs by assigning each interaction with a probability value and peforming a permutation test, in which p < 0.05 is considered significant.
Gene set enrichment analysis (GSEA)
GSEA was conducted using clusterProfiler (v3.8; Yu et al., 2012) and the Reactome gene set (Gillespie et al., 2022) for each cell type on a ranked list of all the genes for which log2FC between conditions (Ts65Dn vs CTL) values were available. Gene sets with FDR < 0.05 were considered significantly enriched, and normalized enrichment scores (NES) were used to assess the directionality of enrichment. The previously published SenMayo gene set (Saul et al., 2022) was used to perform transcriptomic GSEA for the senescence-associated gene signature and clusterProfiler was used to compute an NES for each cell type. Statistically significant enrichment for the gene set was determined by cell types showing FDR < 0.05. All FDR values were calculated using the Benjamini–Hochberg method.
Single-nucleus ATAC-sequencing (snATAC-seq) bioinformatics workflow
Cells from all snATAC-seq experiments were combined into a single Seurat object dataset and filtered through the Signac pipeline (v1.10.0; Stuart et al., 2021) using default parameters. Low-quality cells were removed using filters for peak region fragments <100,000, percent reads in peaks >40, blacklist site ratio <0.025, nucleosome signal <4, and transcriptional start site (TSS) enrichment score >2. The data was then normalized via singular value decomposition (SVD) of the term frequency-inverse document frequency (TF-IDF) matrix and all identified variable features were used for linear dimensional reduction. Remaining preprocessing and dimensionality reduction was performed according to Signac recommendations using default parameters. A gene activity matrix was constructed by counting snATAC-seq peaks within the gene body and 2 kb upstream of the transcriptional start site (TSS) using protein-coding genes annotated in the Ensembl database. UMAP dimensionality reduction was performed with default values.
Differential accessibility analysis
Differentially accessible regions (DARs) between the two conditions (Ts65Dn vs CTL) for each cell type were calculated with the Signac FindMarkers function using default MAST parameters and a log-fold change (logFC) threshold of 0.1 and n_count_peaks as a latent variable. Benjamini–Hochberg corrected p-values were used for significance. Peaks with FDR < 0.05 met statistical criteria for significant differential accessibility. Major cell type annotations were assigned to clusters through manual inspection of canonical marker gene signals and confirmed through label transfer using Seurat’s multimodal snRNA-seq to snATAC-seq integration pipeline. Integration showed 100% cluster label concordance between the two modalities.
Gene ontology (GO) analysis
Gene ontology (GO) analysis was performed for all enriched genes (FDR < 0.05) in each cell type using g:Profiler (v0.7.0; Raudvere et al., 2019) to identify overrepresentation for biological process (BP) and molecular function (MF) categories. Statistically significant enrichment for GO pathways was determined by cell types showing FDR < 0.05. All FDR values were calculated using the Benjamini–Hochberg method.
Transcription factor (TF) motif analysis
Transcription factor (TF) motif activity was estimated using the RunChromVAR wrapper in Signac. The positional weight matrix (PWM) was obtained from the JASPAR2020 database (Fornes et al., 2020). Differential motif activity was assessed using log2fold change (log2FC) threshold of 0.1 with a 0 pseudocount. Motifs with FDR < 0.05 met statistical criteria for significant binding activity.
Fear conditioning
Behavioral testing was performed at The Centre for Phenogenomics (TCP) in Toronto (ON, Canada). Animals were left in their home cage inside the testing room, anteroom or on the day-rack at least 30 min before testing. Mice were then transferred into individual testing chambers with grid floors. After 120 s without any stimulus (which gives the mouse time to get used to the surrounding) a 30 s, 3600 kHz 95-dB audible tone (CS, conditioned stimulus) followed and was co-terminated with a 2-s foot shock of 0.75 mA (US, unconditioned stimulus). Following the shock, mice spent another 30 s in the chamber before removal. Concomitantly, the animals associated the background context cues with the CS (conditioning). Mice were then returned to their holding room where they spent 24 h before being returned to the testing room for additional screening. They were placed back into the same testing chambers for 300 s without changes to the context/interior and no stimuli applied. After conditioning, the CS or the spatial context elicited, in the absence of the US, a central state of fear that was expressed as reduced locomotor activity or total lack of movement (freezing). The time spent immobile was used as a measure of learning/memory performance. This phase was followed by a 2 h break, which mice spent in their home cage before being returned to the testing chamber with a changed context. The grid floor was covered with a plastic sheet, the ceiling was changed from a square to triangular shape, the olfactory cues were changed, and the noise levels were reduced. Mice spent 180 s in this novel environment before a 180 s 3600 kHz 95-dB audible tone (no foot shock) was played again. Following this phase animals, were placed back into their home cage and the test was completed. Clidox 1:5:1 and 70% EtOH solutions were used to disinfect surfaces between testing mice from different cages.
Replicates
All immunostaining analyses were performed on at least three different brains each. All single-nucleus sequencing analyses were performed on three different brains each. All behavioral analyses were performed on at least eight different mice each. Additional details of the statistical analyses can be found in the detailed descriptions of the immunostaining and computational methods above and, where relevant, in the results and the figures legends. For all analyses, n refers to number of animals analyzed.
Data availability
Sequencing data have been deposited in GEO under accession code GSE225554. All data generated or analyzed during this study are included in the manuscript and supporting files. The custom code used for this manuscript is available on GitHub at https://github.com/KalishLab/Ts65Dn_OPC_Senescence.
Results
Characterization of cell types in the adult Ts65Dn cortex using multiomic single-nucleus sequencing
To identify cellular programs underlying age-related cognitive decline in trisomy, we performed droplet-based single-nucleus ATAC (snATAC-seq) and RNA-sequencing (snRNA-seq) on the six-month Ts65Dn and euploid control (CTL) littermate mouse cortex using the 10× Genomics platform (Fig. 1A; Materials and Methods; G.X.Y. Zheng et al., 2017; Satpathy et al., 2019). Nuclei from each biological sample were split into two fractions to capture and analyze both the mRNA and accessible chromatin: one part was used for snATAC-seq and the other was used for snRNA-seq. Ts65Dn mice and littermate controls were selected from three separate litters. This study was restricted to the cortex, the outermost portion of the brain, because of its involvement in cognition and higher-order processing (Shipp, 2007), and the associated structural and functional deficits known to occur in DS (N.R. Lee et al., 2016; Utagawa et al., 2022). We analyzed the transcriptomes and epigenomes from each dataset using the well-established Seurat (Hao et al., 2021) and Signac (Stuart et al., 2021) pipelines, respectively (Materials and Methods). Data was quality control (QC) filtered to remove clusters likely to be of low quality resulting from debris, doublets, or dead cells, and was subsequently normalized using default parameters. After QC processing, we profiled a total of 53,244 nuclei for snATAC-seq and 37,251 nuclei for snRNA-seq (Extended Data Fig. 1-1).
Figure 1.
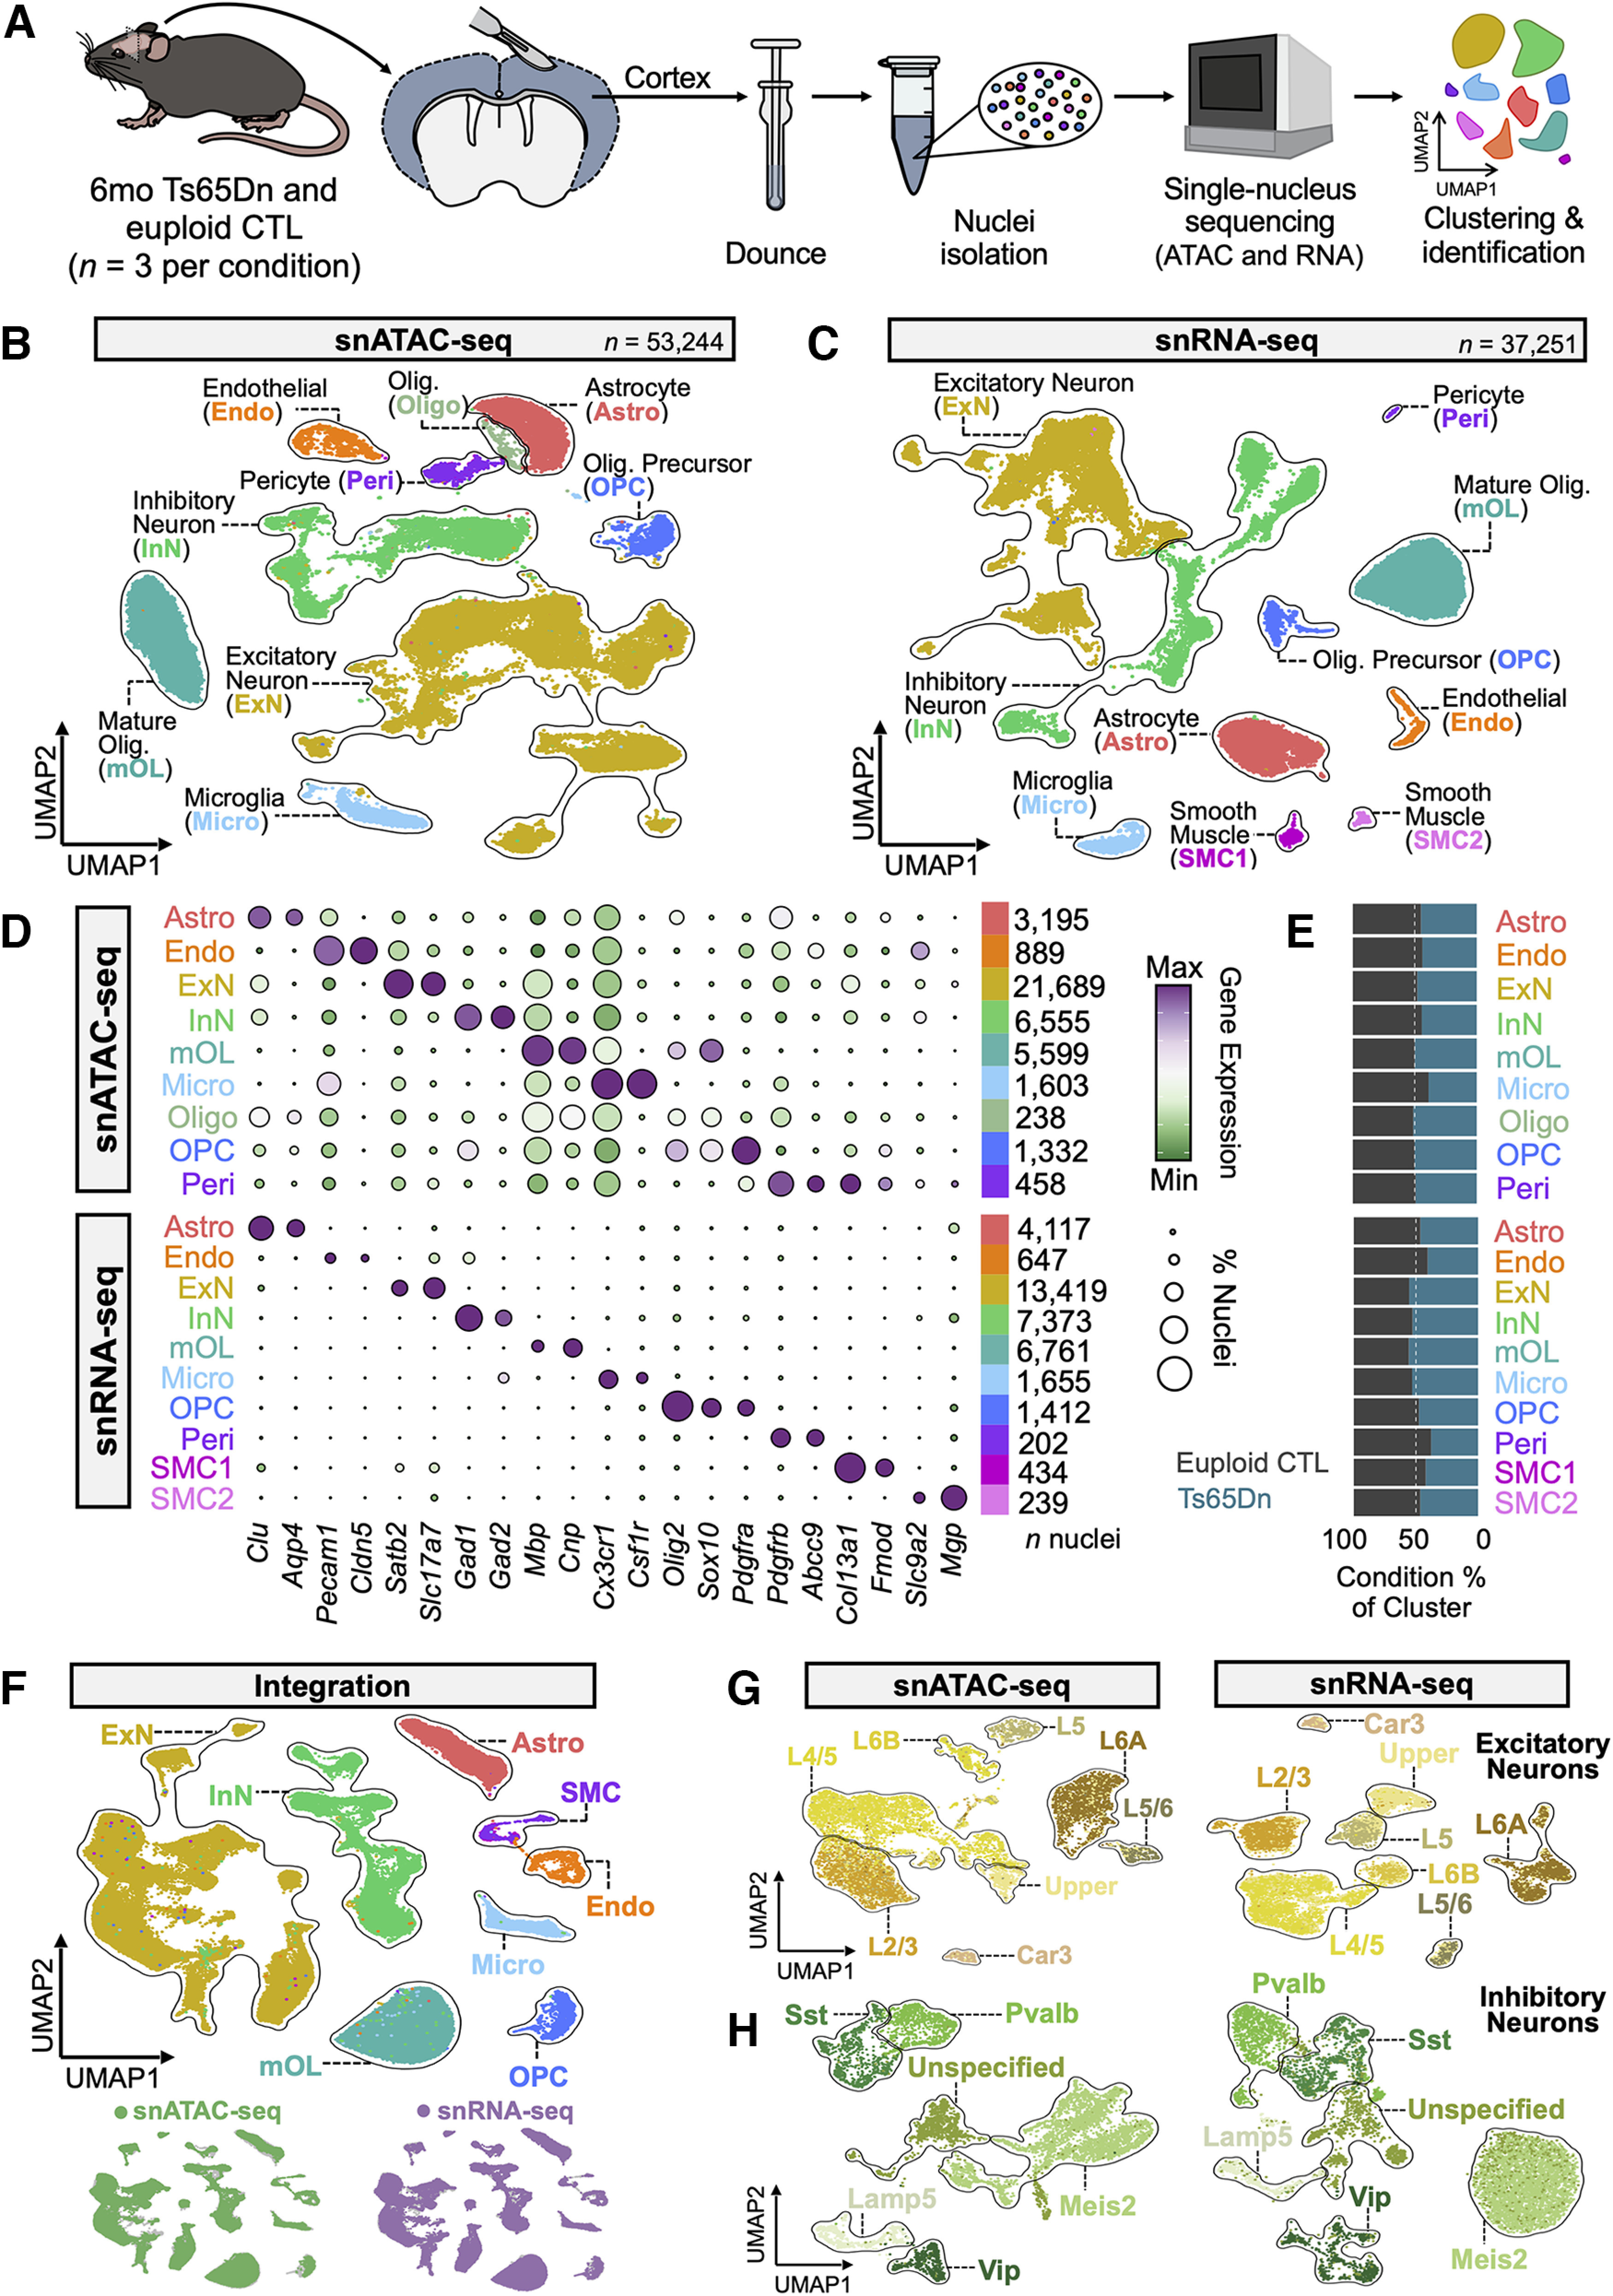
Multimodal single-nucleus sequencing of the Ts65Dn mouse cortex identifies all major neuronal and non-neuronal cell types. A, Schematic representation of biological samples, cortical dissection, tissue processing and sequencing workflow for snATAC-seq and snRNA-seq from six months Ts65Dn and euploid control (CTL) mice (n = 3 male mice per condition). B, UMAP visualization of the snATAC-seq dataset, where each dot represents a single nucleus, for a total of 53,244 nuclei. UMAP plots are generated from combined replicates across Ts65Dn and CTL conditions. Each cluster is colored by cell type: Astro, astrocytes; Endo, endothelial cells; ExN, excitatory neurons; InN, inhibitory neurons; mOL, mature oligodendrocytes; Micro, microglia; Oligo, oligodendrocytes; OPC, oligodendrocyte precursor cells; Peri, pericytes; SMC1/2, smooth muscle cells. C, As in B, but a visualization of the snRNA-seq dataset, containing a total of 37,251 nuclei. D, Dotplot of snATAC-seq and snRNA-seq datasets showing gene expression or gene accessibility patterns, respectively, with several key canonical marker genes used for cluster identification. The diameter of the dot corresponds to the proportion of nuclei expressing or exhibiting accessibility of the indicated gene, and the color of the dot corresponds to the average expression or accessibility of the gene relative to all cell types. The number of nuclei assigned to each cell type are indicated. E, Barplot depicting the fraction of nuclei per cell type by condition. F, UMAP visualization of multi-omic integration of snATAC-seq and snRNA-seq datasets colored by cell type assignment. Beneath are UMAPs of the integration colored by originating dataset. G, UMAP visualization of excitatory neuron (ExN) subsets as extracted from snATAC-seq and snRNA-seq datasets. Each cluster is colored by cell type: Car3, Car3-expressing excitatory neurons; L2/3, cortical Layers II -III; L4/5, cortical Layers IV -V; L5, cortical Layer V; L5/6, cortical Layers V -VI; L6A/B, cortical Layer VI excitatory neuron subsets; Upper, mixed upper layer (II -IV) excitatory neurons. H, As in G, but a visualization of inhibitory neuron (InN) subsets. Each cluster is colored by cell type: Lamp5, Lamp5-expressing interneurons; Meis2, Meis2-expressing interneurons; Pvalb, parvalbumin-expressing interneurons; Sst, somatostatin-expressing interneurons; Vip, vasoactive intestinal peptide-expressing interneurons; Unspecified, interneurons of unspecified classification. See Extended Data Figure 1-1 for quality control (QC) metrics used in the initial processing of snATAC-seq and snRNA-seq data.
Quality control (QC) metrics for multiomic single-nucleus data and integration of snATAC-seq and snRNA-seq data for neuronal subsets, related to Figure 1. A, Quality control (QC) metrics for snATAC-seq data, including the percentage of reads in peaks, the number of peak region fragments, transcription start site (TSS) enrichment, blacklist ratio, and nucleosome signal per replicate from six-month Ts65Dn and euploid control (CTL) mice (n = 3 male mice per condition). B, As in A, but depicting QC metrics for snRNA-seq data, including the number of features, total transcript counts, and percent mitochondrial content per replicate. C, UMAP visualization of multiomic integration of snATAC-seq and snRNA-seq datasets colored by originating dataset for the excitatory neuron (ExN) subset. D, As in C, but depicting multiomic integration for the inhibitory neuron (InN) subset. Download Figure 1-1, TIF file (2.2MB, tif) .
Genes with high variance were used to compute principal components for projecting and clustering cell populations with similar molecular signatures. Unsupervised clustering through Leiden clustering and plotting via uniform manifold approximation and projection (UMAP; Materials and Methods) dimensionality reduction revealed 10 major cell classes across the snATAC-seq and snRNA-seq datasets: astrocytes (Astro), excitatory neurons (ExN), inhibitory neurons (InN), mature oligodendrocytes (mOL), microglia (Micro), oligodendrocyte precursor cells (OPC), oligodendrocyte lineage cells (Oligo), endothelial cells (Endo), pericytes (Peri), and smooth muscle cells (SMC; Fig. 1B). Cell types were assigned based on a combination of canonical marker gene expression (Fig. 1C) and confirmed through a machine learning reference-based mapping approach (scPred; Materials and Methods; Alquicira-Hernandez et al., 2019) using the Allen Brain Atlas whole cortex and hippocampus 10× Genomics dataset (Materials and Methods; Yao et al., 2021). Integration and label transfer (Materials and Methods) between snRNA-seq and snATAC-seq further confirmed cell population assignments and demonstrated strong concordance between the two modalities, with cell types identified in either platform grouping together in the integrated UMAP space (Fig. 1D). All major cell types were present in both conditions, with high transcriptomic and epigenetic overlap between genotypes.
The ExN and InN clusters were proportionally the largest by number out of all identified cell type clusters, consistent with previous reports that neurons are the most numerous cell type in the cortex (Keller et al., 2018). To further subcategorize heterogeneous neuronal populations, we performed a second level of hierarchical clustering on ExNs and InNs to identify distinct subpopulations of each neuron class (Fig. 1E). Again, using the scPred algorithm on the snRNA-seq dataset, we identified clusters spanning five cortical layers (L2–L6), a distinct Car3+ population of ExNs, as well as five subpopulations of InNs, all with distinct transcriptional signatures. Integration of snRNA-seq and snATAC-seq neuronal subclusters revealed corresponding ExN cortical layer and InN subpopulations within the snATAC-seq dataset (Extended Data Fig. 1-1). Overall, this analysis transcriptionally and epigenetically identified all major neuronal and non-neuronal cell types and subtypes across the murine cortex.
Identification of cell type-specific trisomy-associated transcriptomic changes in the Ts65Dn cortex
To identify transcriptional signatures of trisomy-associated cognitive decline, we performed cell type-specific differential gene expression (DGE) between Ts65Dn and euploid CTL mice (Materials and Methods). We used differentially expressed genes (DEGs) that met a false discovery rate (FDR) value < 0.05 to define statistically significant changes in transcript expression between Ts65Dn and CTL offspring. We identified a total of 4715 cell type-specific DEGs across all cell populations (Fig. 2A; Table 1), with 64.3% of DEGs upregulated (log2FC > 0) and 35.7% downregulated (log2FC < 0) in Ts65Dn. We found that 38% of the DEGs significantly altered by Ts65Dn trisomy were cell type specific, with the remaining 62% intersecting between two or more cell types (Fig. 2B).
Figure 2.
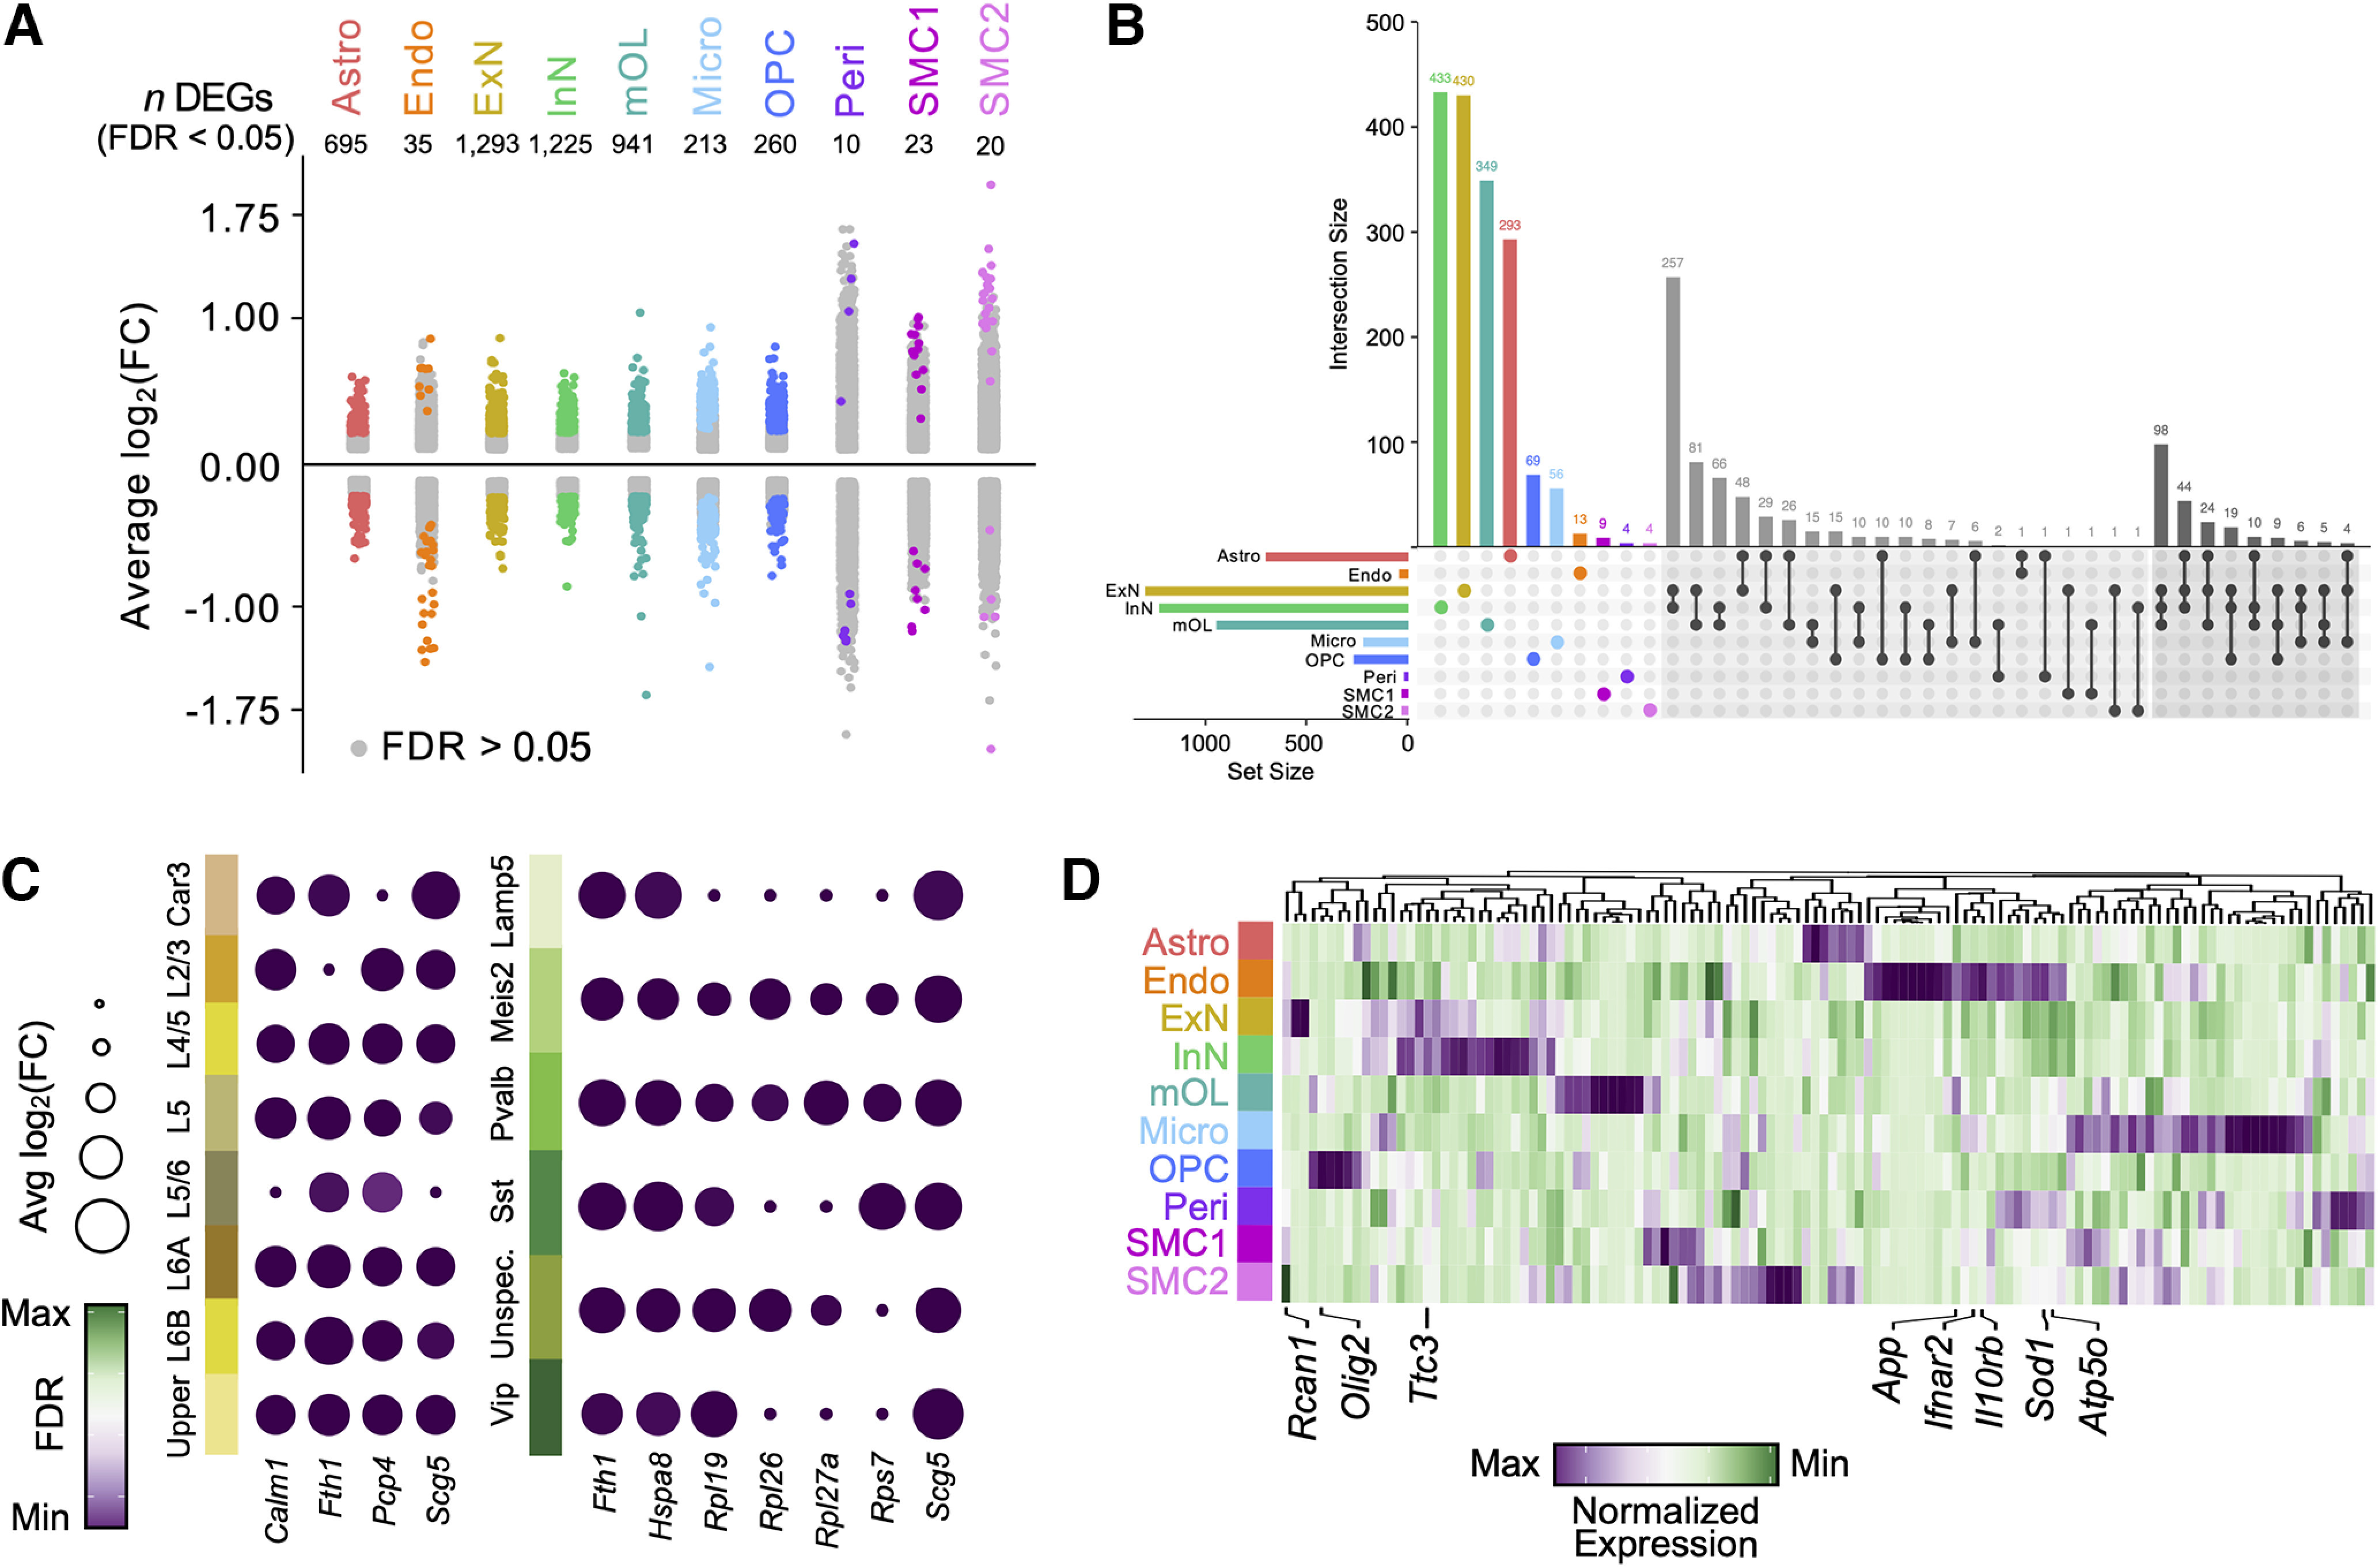
Transcriptionally distinct cellular subpopulations in Ts65Dn cortex. A, Strip plot displaying differentially expressed genes (DEGs) between Ts65Dn and CTL offspring at six months. Colored dots represent significant genes (FDR < 0.05) per cell type. The number of significant DEGs per cell type is indicated. The x-axis displays all major cortical cell types profiled through snRNA-seq. Data obtained from n = 3 biological replicates per condition. B, UpSet plot displaying the number of unique and shared DEGs across cell types, with unique genes colored based on cell type, and genes shared between two or three cell types indicated by black dots connected by lines according to shared origins. The histogram indicates the number of DEGs for each cell type, and the barplots show the number of significant DEGs (FDR < 0.05) per cell type. C, Dotplot of select differentially expressed genes (DEGs) within excitatory neuron (ExN) and inhibitory neuron (InN) subsets. Each row represents a neuronal subset population. Each column represents a gene. The color code represents the FDR, and the size of the dots represents the average log2fold change [avg log2(FC)] of gene expression between Ts65Dn and CTL mice. D, Hierarchically clustered heatmap of normalized gene expression for genes contained within the Ts65Dn chromosomal product. The plot displays gene activity across all cell types in snRNA-seq. Several genes of interest are indicated. Each column represents a cell type. The color code represents the row-normalized expression for each gene.
Table 1.
Top five genes enriched in each cortical cell type in Ts65Dn mice compared with CTL
| Gene | FDR | log2(FC) | Cell type | Gene | FDR | log2(FC) | Cell type |
|---|---|---|---|---|---|---|---|
| Scg5 | 1.66E-19 | 0.55 | Astro | Scg5 | 3.20E-09 | 0.86 | Micro |
| mt-Co3 | 3.08E-19 | 0.51 | Astro | Pcp4 | 1.87E-17 | 0.74 | Micro |
| Pcp4 | 3.56E-23 | 0.48 | Astro | Fmn1 | 5.78E-04 | 0.70 | Micro |
| Fth1 | 1.98E-28 | 0.47 | Astro | Hbb-bs | 1.36E-04 | 0.64 | Micro |
| mt-Co1 | 9.46E-10 | 0.46 | Astro | Rpl26 | 7.83E-06 | 0.60 | Micro |
| Nxpe2 | 1.55E-08 | 1.13 | Endo | Fth1 | 8.83E-13 | 0.73 | OPC |
| H2-K1 | 1.32E-04 | 0.78 | Endo | mt-Co1 | 3.23E-08 | 0.66 | OPC |
| Ly6a | 4.38E-02 | 0.60 | Endo | Ano3 | 4.03E-07 | 0.65 | OPC |
| Ccni | 1.03E-02 | 0.60 | Endo | mt-Nd4 | 1.21E-05 | 0.57 | OPC |
| Nxpe4 | 4.07E-02 | 0.60 | Endo | mt-Cytb | 1.01E-05 | 0.55 | OPC |
| mt-Co3 | 1.40E-234 | 0.79 | ExN | Adora2a | 2.35E-01 | 1.47 | Peri |
| Fth1 | 3.68E-196 | 0.64 | ExN | Tnfrsf21 | 2.58E-01 | 1.47 | Peri |
| mt-Co1 | 2.18E-136 | 0.64 | ExN | Nefl | 4.06E-02 | 1.38 | Peri |
| Pcp4 | 1.29E-125 | 0.57 | ExN | Arpc2 | 9.73E-02 | 1.36 | Peri |
| Calm1 | 2.77E-212 | 0.55 | ExN | Anp32b | 2.58E-01 | 1.31 | Peri |
| Scg5 | 5.85E-70 | 0.57 | InN | Sdc2 | 1.03E-02 | 0.92 | SMC1 |
| Gpr88 | 1.53E-24 | 0.51 | InN | Tuba4a | 1.03E-02 | 0.91 | SMC1 |
| Hsp90aa1 | 1.45E-63 | 0.49 | InN | Arpp19 | 1.03E-02 | 0.87 | SMC1 |
| Fth1 | 8.98E-71 | 0.49 | InN | Uqcrh | 4.07E-04 | 0.87 | SMC1 |
| Ckb | 5.74E-65 | 0.48 | InN | Tpt1 | 5.12E-03 | 0.82 | SMC1 |
| Spock1 | 1.01E-61 | 0.94 | mOL | mt-Co2 | 1.97E-06 | 1.74 | SMC2 |
| Fmn1 | 1.41E-22 | 0.66 | mOL | Pcp4 | 5.18E-09 | 1.34 | SMC2 |
| Hbb-bs | 6.47E-18 | 0.60 | mOL | mt-Co3 | 2.13E-04 | 1.24 | SMC2 |
| Pcp4 | 8.02E-49 | 0.58 | mOL | Rps20 | 3.17E-02 | 1.20 | SMC2 |
| Camk2n1 | 6.42E-19 | 0.53 | mOL | Scand1 | 6.83E-03 | 1.19 | SMC2 |
Listed are the top five genes [ranked by highest average log2(FC)] that are significantly differentially enriched in Ts65Dn mice compared with CTL as detected via snRNA-seq. Shown are fold-change (FC) values of the average expression for each gene and the false discovery rate (FDR) between Ts65Dn and CTL cells. Each cell type is listed in the final column: Astro, astrocytes; Endo, endothelial cells; ExN, excitatory neurons; InN, inhibitory neurons; mOL, mature oligodendrocytes; Micro, microglia; OPC, oligodendrocyte precursor cells; Peri, pericytes; SMC1/2, smooth muscle cells.
ExN and InN populations were the most numerous of all identified cell types, and accordingly had the highest number of total and shared DEGs (Fig. 2B). Several genes were found to be overexpressed in a majority of ExN subclusters (at least five out of eight; Fig. 2C; Table 2), including Calm1, an essential regulator of early neuronal migration (Kobayashi et al., 2015), Fth1, a ferroxidase enzyme that supports iron detoxification as part of the neuronal antioxidant defense system (Mukherjee et al., 2020), Scg5, a secretory chaperone that co-localizes with aggregated proteins in neurodegenerative diseases (Chaplot et al., 2020), and Pcp4, a modulator of calcium signaling that is triplicated in DS (Mouton-Liger et al., 2011). A similar trend was observed in InNs, with several genes showing overexpression across multiple subtype clusters (at least four out of six; Fig. 2C), including the aforementioned Fth1 and Scg5, as well as Hspa8, a molecular chaperone whose expression increases during injury and activates proinflammatory responses through NF-κB signaling (Mi et al., 2021). Several large (Rpl) and small (Rps) ribosomal subunit genes, including Rpl19/26/27a and Rps7 were also overexpressed in several InN subtypes, suggesting a disruption in translation-associated ribosomal machinery. These data support existing findings of metabolic (Izzo et al., 2018; Dierssen et al., 2020; Sarver et al., 2023), inflammatory (Wilcock, 2012; Flores-Aguilar et al., 2020), transcriptional (Gardiner, 2006), and translational (Sullivan et al., 2016; Aivazidis et al., 2017) dysregulation in the trisomic brain.
Table 2.
Top five genes enriched in each excitatory (ExN) and inhibitory (InN) neuronal subtype in Ts65Dn mice compared with CTL
| Gene | FDR | log2(FC) | Cell type | Gene | FDR | log2(FC) | Cell type |
|---|---|---|---|---|---|---|---|
| Scg5 | 1.49E-03 | 0.92 | Car3 | Fth1 | 1.54E-47 | 0.64 | Upper |
| Bex2 | 1.52E-03 | 0.86 | Car3 | Pcp4 | 1.27E-33 | 0.58 | Upper |
| Rtn1 | 1.13E-08 | 0.84 | Car3 | Calm1 | 6.98E-47 | 0.55 | Upper |
| Cck | 7.34E-03 | 0.79 | Car3 | Scg5 | 2.40E-31 | 0.55 | Upper |
| Tomm20 | 3.67E-03 | 0.73 | Car3 | Cmss1 | 6.98E-47 | 0.48 | Upper |
| Pcp4 | 5.10E-26 | 0.68 | L2/3 | Cck | 4.04E-02 | 0.71 | Lamp2 |
| Calm1 | 8.56E-42 | 0.61 | L2/3 | Pcp4 | 7.90E-04 | 0.69 | Lamp2 |
| Fth1 | 2.51E-25 | 0.59 | L2/3 | Scg5 | 8.38E-03 | 0.67 | Lamp2 |
| Cd81 | 4.06E-18 | 0.58 | L2/3 | Tac1 | 1.61E-02 | 0.67 | Lamp2 |
| Lama2 | 2.33E-04 | 0.56 | L2/3 | Vdac2 | 1.73E-02 | 0.63 | Lamp2 |
| Fth1 | 1.65E-46 | 0.61 | L4/5 | Scg5 | 3.52E-31 | 0.59 | Meis2 |
| Pcp4 | 1.16E-32 | 0.58 | L4/5 | Junb | 2.23E-14 | 0.57 | Meis2 |
| Camk2n1 | 9.50E-29 | 0.54 | L4/5 | Gpr88 | 2.90E-15 | 0.48 | Meis2 |
| Scg5 | 7.07E-30 | 0.52 | L4/5 | Ckb | 1.89E-34 | 0.46 | Meis2 |
| Pld5 | 3.36E-18 | 0.52 | L4/5 | Actb | 2.12E-19 | 0.46 | Meis2 |
| Fth1 | 1.47E-13 | 0.71 | L5 | Pcp4 | 3.43E-11 | 0.67 | Pvalb |
| Camk2n1 | 1.09E-08 | 0.69 | L5 | Chchd2 | 2.53E-09 | 0.58 | Pvalb |
| Itm2c | 1.19E-09 | 0.65 | L5 | Fth1 | 1.00E-08 | 0.57 | Pvalb |
| Calm1 | 5.88E-15 | 0.63 | L5 | Scg5 | 2.60E-07 | 0.56 | Pvalb |
| Ubb | 1.75E-11 | 0.62 | L5 | Actg1 | 9.05E-09 | 0.56 | Pvalb |
| Eid1 | 3.14E-03 | 0.79 | L5/6 | Hspa8 | 5.86E-08 | 0.67 | Sst |
| Tuba1a | 2.50E-03 | 0.78 | L5/6 | Itm2c | 4.58E-06 | 0.63 | Sst |
| Lars2 | 3.83E-02 | 0.63 | L5/6 | Pcp4 | 3.38E-09 | 0.61 | Sst |
| Eef1g | 2.59E-02 | 0.62 | L5/6 | Fth1 | 1.31E-07 | 0.60 | Sst |
| Ndufa13 | 3.83E-02 | 0.61 | L5/6 | Scg5 | 1.16E-06 | 0.59 | Sst |
| Fth1 | 4.00E-37 | 0.71 | L6A | Gpr88 | 2.66E-08 | 0.56 | Unspec |
| Calm1 | 5.38E-40 | 0.62 | L6A | Cck | 2.94E-04 | 0.56 | Unspec |
| Atp6v0c | 1.97E-22 | 0.61 | L6A | Fth1 | 5.39E-17 | 0.54 | Unspec |
| Tubb5 | 3.17E-19 | 0.57 | L6A | Scg5 | 1.15E-10 | 0.52 | Unspec |
| Serinc1 | 4.53E-17 | 0.54 | L6A | Ckb | 1.12E-14 | 0.48 | Unspec |
| Fth1 | 1.32E-14 | 0.93 | L6B | Scg5 | 5.01E-08 | 0.72 | Vip |
| Rpl23 | 4.66E-05 | 0.68 | L6B | Vip | 7.19E-06 | 0.71 | Vip |
| Pgrmc1 | 6.01E-05 | 0.66 | L6B | H3f3b | 1.29E-07 | 0.63 | Vip |
| Rpl13 | 4.36E-07 | 0.62 | L6B | Lars2 | 3.34E-04 | 0.57 | Vip |
| Rpl26 | 9.65E-06 | 0.61 | L6B | Rpl19 | 5.11E-05 | 0.55 | Vip |
Listed are the top five genes [ranked by highest average log2(FC)] that are significantly differentially enriched in Ts65Dn mice compared with CTL as detected via snRNA-seq. Shown are fold-change (FC) values of the average expression for each gene and the false discovery rate (FDR) between Ts65Dn and CTL cells. Each neuronal subtype is listed in the final column: Car3, Car3-expressing excitatory neurons; L2/3, cortical Layers II–III; L4/5, cortical Layers IV–V; L5, cortical Layer V; L5/6, cortical Layers V–VI; L6A/B, cortical Layer VI excitatory neuron subsets; Upper, mixed upper layer (II-IV) excitatory neurons; Lamp5, Lamp5-expressing interneurons; Meis2, Meis2-expressing interneurons; Pvalb, parvalbumin-expressing interneurons; Sst, somatostatin-expressing interneurons; Vip, vasoactive intestinal peptide-expressing interneurons; Unspecified, interneurons of unspecified classification.
All cell types exhibited upregulation of ∼10–20% of the genes expressed on the Ts65Dn trans-chromosome at the transcript level. However, not all Ts65Dn triplicated genes were equally altered in each cell type (Fig. 2D), consistent with previous analyses conducted on human iPSC-derived DS lines (Jose Luis Olmos-Serrano et al., 2016; Ponroy Bally et al., 2020) and single-cell analyses of DS mouse models (Lyle et al., 2004; Palmer et al., 2021; Sierra et al., 2021) that demonstrate limited overexpression of triplicated genes in trisomic cells. Only a few genes such as Atp5o or Sod1 were consistently found at higher levels in trisomic mice across various cell types, while others were overexpressed only in particular cell populations. For instance, Olig2, a key transcription factor (TF) that is triplicated in DS and activates the expression of myelin-associated genes in OL-lineage cells (Zhou et al., 2000; Zhou and Anderson, 2002), was selectively upregulated in trisomic OPCs by 15%; its overexpression is known to contribute to impaired OPC proliferation and differentiation in DS (Chakrabarti et al., 2010; Jose Luis Olmos-Serrano et al., 2016; Xu et al., 2019). Ttc3, an interactor of nerve growth factor (Ngf) that strongly inhibits neurite extension on overexpression (Berto et al., 2007), was upregulated in Ts65Dn ExNs by 13%. App, an integral membrane protein that is triplicated in DS and associated with increased amyloid-β (Aβ) aggregation and plaque deposition (O’Brien and Wong, 2011) showed enrichment of 8.6% and 11% in trisomic ExNs and microglia, respectively, and Rcan1, whose overexpression leads to neurofibrillary tangles (Ermak and Davies, 2013), was enriched in Ts65Dn endothelial cells by 16%. Lastly, pericytes and astrocytes exhibited an increase in Ifnar2 expression by 37% and 8.6%, respectively, while microglia showed an increased expression of Ifnar2 by 10% and Il10rb by 13%; the upregulated expression of these IFN receptors may contribute to the hyper-inflammatory milieu of the trisomic brain. The cell type-specific DEGs resulting from trisomy are consistent with many of the molecular disruptions in DS, including impaired myelinogenesis (Ábrahám et al., 2012; Flores-Aguilar et al., 2020), neuroinflammation (Wilcock, 2012; Flores-Aguilar et al., 2020), and neurogenesis (Stagni et al., 2018).
Gene set enrichment analysis (GSEA) reveals dysregulation of several biological pathways in the mature Ts65Dn cortex
To identify functional pathways perturbed in Ts65Dn mice, we performed gene set enrichment analysis (GSEA) using the Reactome repertoire of biological pathways (Gillespie et al., 2022) on ranked genes across all cell types (Materials and Methods). Of the top 10 enriched GSEA categories, four emerged as common processes altered in almost all cell types: ribosomal RNA (rRNA) processing, respiratory electron transport, nonsense-mediated decay (NMD), and translation initiation (Fig. 3A; Table 3). DS is characterized by an impairment in mitochondrial and ribosomal biogenesis, as well as integrated stress response (ISR)-mediated disruption in proteostasis (Aivazidis et al., 2017; Izzo et al., 2018; P.J. Zhu et al., 2019). Increased ribosomal and rRNA processing have been described in DS (Ravaioli et al., 2022) and premature aging (Buchwalter and Hetzer, 2017), and ribosome biogenesis has been shown to be regulated, and thus disrupted, in an ISR-dependent manner (Szaflarski et al., 2022). Consistent with this finding, we observed overexpression and dysregulation of over 30 large (Rpl) and small (Rps) ribosomal subunit genes and 15 mitochondrial (mt and cox) transcripts in the Ts65Dn brain. Genes involved in translation initiation, such as eIF4e, eIF3e, and eIF3a (Gingras et al., 1999; Aitken et al., 2016), were also found to have increased expression in all cortical Ts65Dn cells. Disrupted mitochondrial biogenesis in DS has previously been shown to impair oxidative phosphorylation (Bayona-Bafaluy et al., 2021), reduce mitochondrial energy production, and lower mitochondrial function (Helguera et al., 2013; Bayona-Bafaluy et al., 2021), together resulting in a hypoxia-like neuropathology (Pecze et al., 2020), further suggestive of a widespread metabolic dysregulation in the DS brain.
Figure 3.

Gene set enrichment analysis (GSEA) reveals disruption of several biological pathways in trisomic cells from the Ts65Dn cortex. A, Gene set enrichment analysis (GSEA) of several Reactome biological pathways enriched across a majority of cortical cell types. The bars correspond to the left y-axis, displaying normalized enrichment score for each cell type by pathway and are colored by cell type identity. The dots correspond to the right y-axis, displaying -log2(FDR) for each cell type by pathway; the dashed horizontal line intercepts the right y-axis at 4.3, corresponding to an FDR = 0.05. All dots above this horizontal line are statistically significant. B, As in A, but depicting GSEA of several Reactome biological pathways enriched across astrocytes (Astro), mature oligodendrocytes (mOL), microglia (Micro), and oligodendrocyte precursor cells (OPC). C, Dotplot of select differentially expressed genes (DEGs) within astrocytes (red), microglia (light blue), and OPCs (dark blue). Each column represents a cell population. Each row represents a gene. The color code represents the FDR, and the size of the dots represents the average log2fold change [avg log2(FC)] of gene expression between Ts65Dn and CTL.
Table 3.
Top three Ts65Dn enriched pathways in each cortical cell type identified via gene set enrichment analysis (GSEA) in Ts65Dn mice compared with CTL
| GSEA pathway | FDR | NES | Cell type |
|---|---|---|---|
| The citric acid (TCA) cycle and respiratory electron transport | 3.51E-05 | 2.81 | Astro |
| Respiratory electron transport | 9.86E-05 | 2.77 | Astro |
| Nonsense mediated decay (NMD) | 1.54E-04 | 2.65 | Astro |
| Interferon signaling | 1.68E-02 | 2.25 | Endo |
| Interferon-α/β signaling | 2.89E-02 | 2.23 | Endo |
| Negative regulation of the PI3K/AKT network | 4.20E-02 | 2.10 | Endo |
| SRP-dependent cotranslational protein targeting to membrane | 4.60E-14 | 3.48 | ExN |
| Nonsense mediated decay (NMD) | 3.06E-13 | 3.43 | ExN |
| rRNA processing in the nucleolus and cytosol | 4.20E-13 | 3.36 | ExN |
| Metabolism | 8.47E-12 | 3.13 | InN |
| The citric acid (TCA) cycle and respiratory electron transport | 2.20E-08 | 3.04 | InN |
| Innate immune system | 3.87E-08 | 2.94 | InN |
| The citric acid (TCA) cycle and respiratory electron transport | 1.57E-11 | 3.43 | mOL |
| SRP-dependent cotranslational protein targeting to membrane | 1.39E-11 | 3.42 | mOL |
| Nonsense mediated decay (NMD) | 1.68E-11 | 3.39 | mOL |
| The citric acid (TCA) cycle and respiratory electron transport | 7.15E-12 | 3.24 | Micro |
| Respiratory electron transport | 1.06E-10 | 3.21 | Micro |
| Eukaryotic translation initiation | 9.00E-10 | 3.10 | Micro |
| SRP-dependent cotranslational protein targeting to membrane | 1.56E-10 | 3.34 | OPC |
| Eukaryotic translation initiation | 1.56E-10 | 3.31 | OPC |
| Nonsense mediated decay (NMD) | 3.06E-10 | 3.28 | OPC |
| Cellular response to heat stress | 5.14E-03 | 1.84 | Peri |
| Translation | 2.05E-03 | 1.72 | Peri |
| Cellular response to stimuli | 1.53E-03 | 1.71 | Peri |
| Formation of a pool of free 40S subunits | 1.63E-07 | 2.86 | SMC1 |
| Nonsense mediated decay (NMD) | 1.63E-07 | 2.84 | SMC1 |
| Eukaryotic translation initiation | 2.62E-07 | 2.73 | SMC1 |
| SRP-dependent cotranslational protein targeting to membrane | 7.11E-24 | 3.78 | SMC2 |
| Nonsense mediated decay (NMD) | 1.86E-23 | 3.74 | SMC2 |
| Formation of a pool of free 40S subunits | 9.16E-24 | 3.70 | SMC2 |
Listed are the top three pathways identified via GSEA analysis (ranked by lowest FDR value) that are significantly enriched in Ts65Dn mice compared with CTL. All normalized enrichment scores (NES) are listed in the third column. Each cell type is listed in the final column and is abbreviated as described in Table 1.
DEGs in trisomic astrocytes, microglia, and OPCs also exhibited enrichment of GSEA categories including immune activation, neutrophil degranulation, macroautophagy, and stress response (Fig. 3B). In Ts65Dn astrocytes, we observed upregulation of Ikbkb, an activator of the NF-κB pathway (Israel, 2010), RhoA, a regulator of reactive astrocyte dynamics (Renault-Mihara and Okano, 2017), and inflammatory mediators Cd47, Cd63, and Cd81 (Hazrati et al., 2022; Fig. 3C). Ts65Dn OPCs likewise exhibited increased expression of several genes whose functions have been associated with immune activation, such as Adam10, an extracellular matrix (ECM) protein involved in inflammatory signaling (Pabois et al., 2014) and Ifngr2, an IFN receptor, whose upregulation induces increased immunomodulatory signaling (Schroder et al., 2004). Trisomic astrocytes, microglia, and OPCs also showed increased expression of several proteasome subunits including Psmb1/7 (Tanaka, 2009), as well as antioxidant enzymes Prdx1/5, whose functions are important during periods of oxidative stress (Park et al., 2016), and Lamtor1/2, which mediate cellular autophagy and survival responses to inflammation (Scheffler et al., 2014). Taken together, these transcriptional changes are consistent with previous reports of glial reactivity in the DS brain (Jørgensen et al., 1990; C. Chen et al., 2014; Pinto et al., 2020; Ponroy Bally and Murai, 2021).
Cortical Ts65Dn OPCs exhibit enrichment for a senescence-associated gene signature and an altered cell surfaceosome landscape
Given reports of increased DNA damage and chronic neuroinflammation in DS and the Ts65Dn brain (Guedj et al., 2016; Ahmed et al., 2021; Puente-Bedia et al., 2022), we hypothesized that subpopulations of Ts65Dn cells would exhibit accelerated senescence. Senescent cells accumulate in aged tissues because of exhaustion of proliferation-competent cells (Di Micco et al., 2021; Kumari and Jat, 2021). However, the identification and characterization of senescent cells, particularly in bulk or single-nucleus sequencing data, is challenging because of the low average expression of many senescence-associated transcripts and the imprecise genetic definition of cellular senescence. We thus performed GSEA using a recently-published senescence-associated gene signature: SenMayo (Saul et al., 2022; Materials and Methods). This gene set is composed of 125 senescence-associated genes, including key SASP factors, transmembrane, and intracellular protein-encoding transcripts that have been validated across murine and human age-related transcriptomic datasets. Through this analysis, we observed selective enrichment (normalized enrichment score, NES > 0, FDR < 0.05) of the SenMayo gene set only in Ts65Dn OPCs (Fig. 4A,B), suggesting a cell type-specific senescence phenotype in this population.
Figure 4.
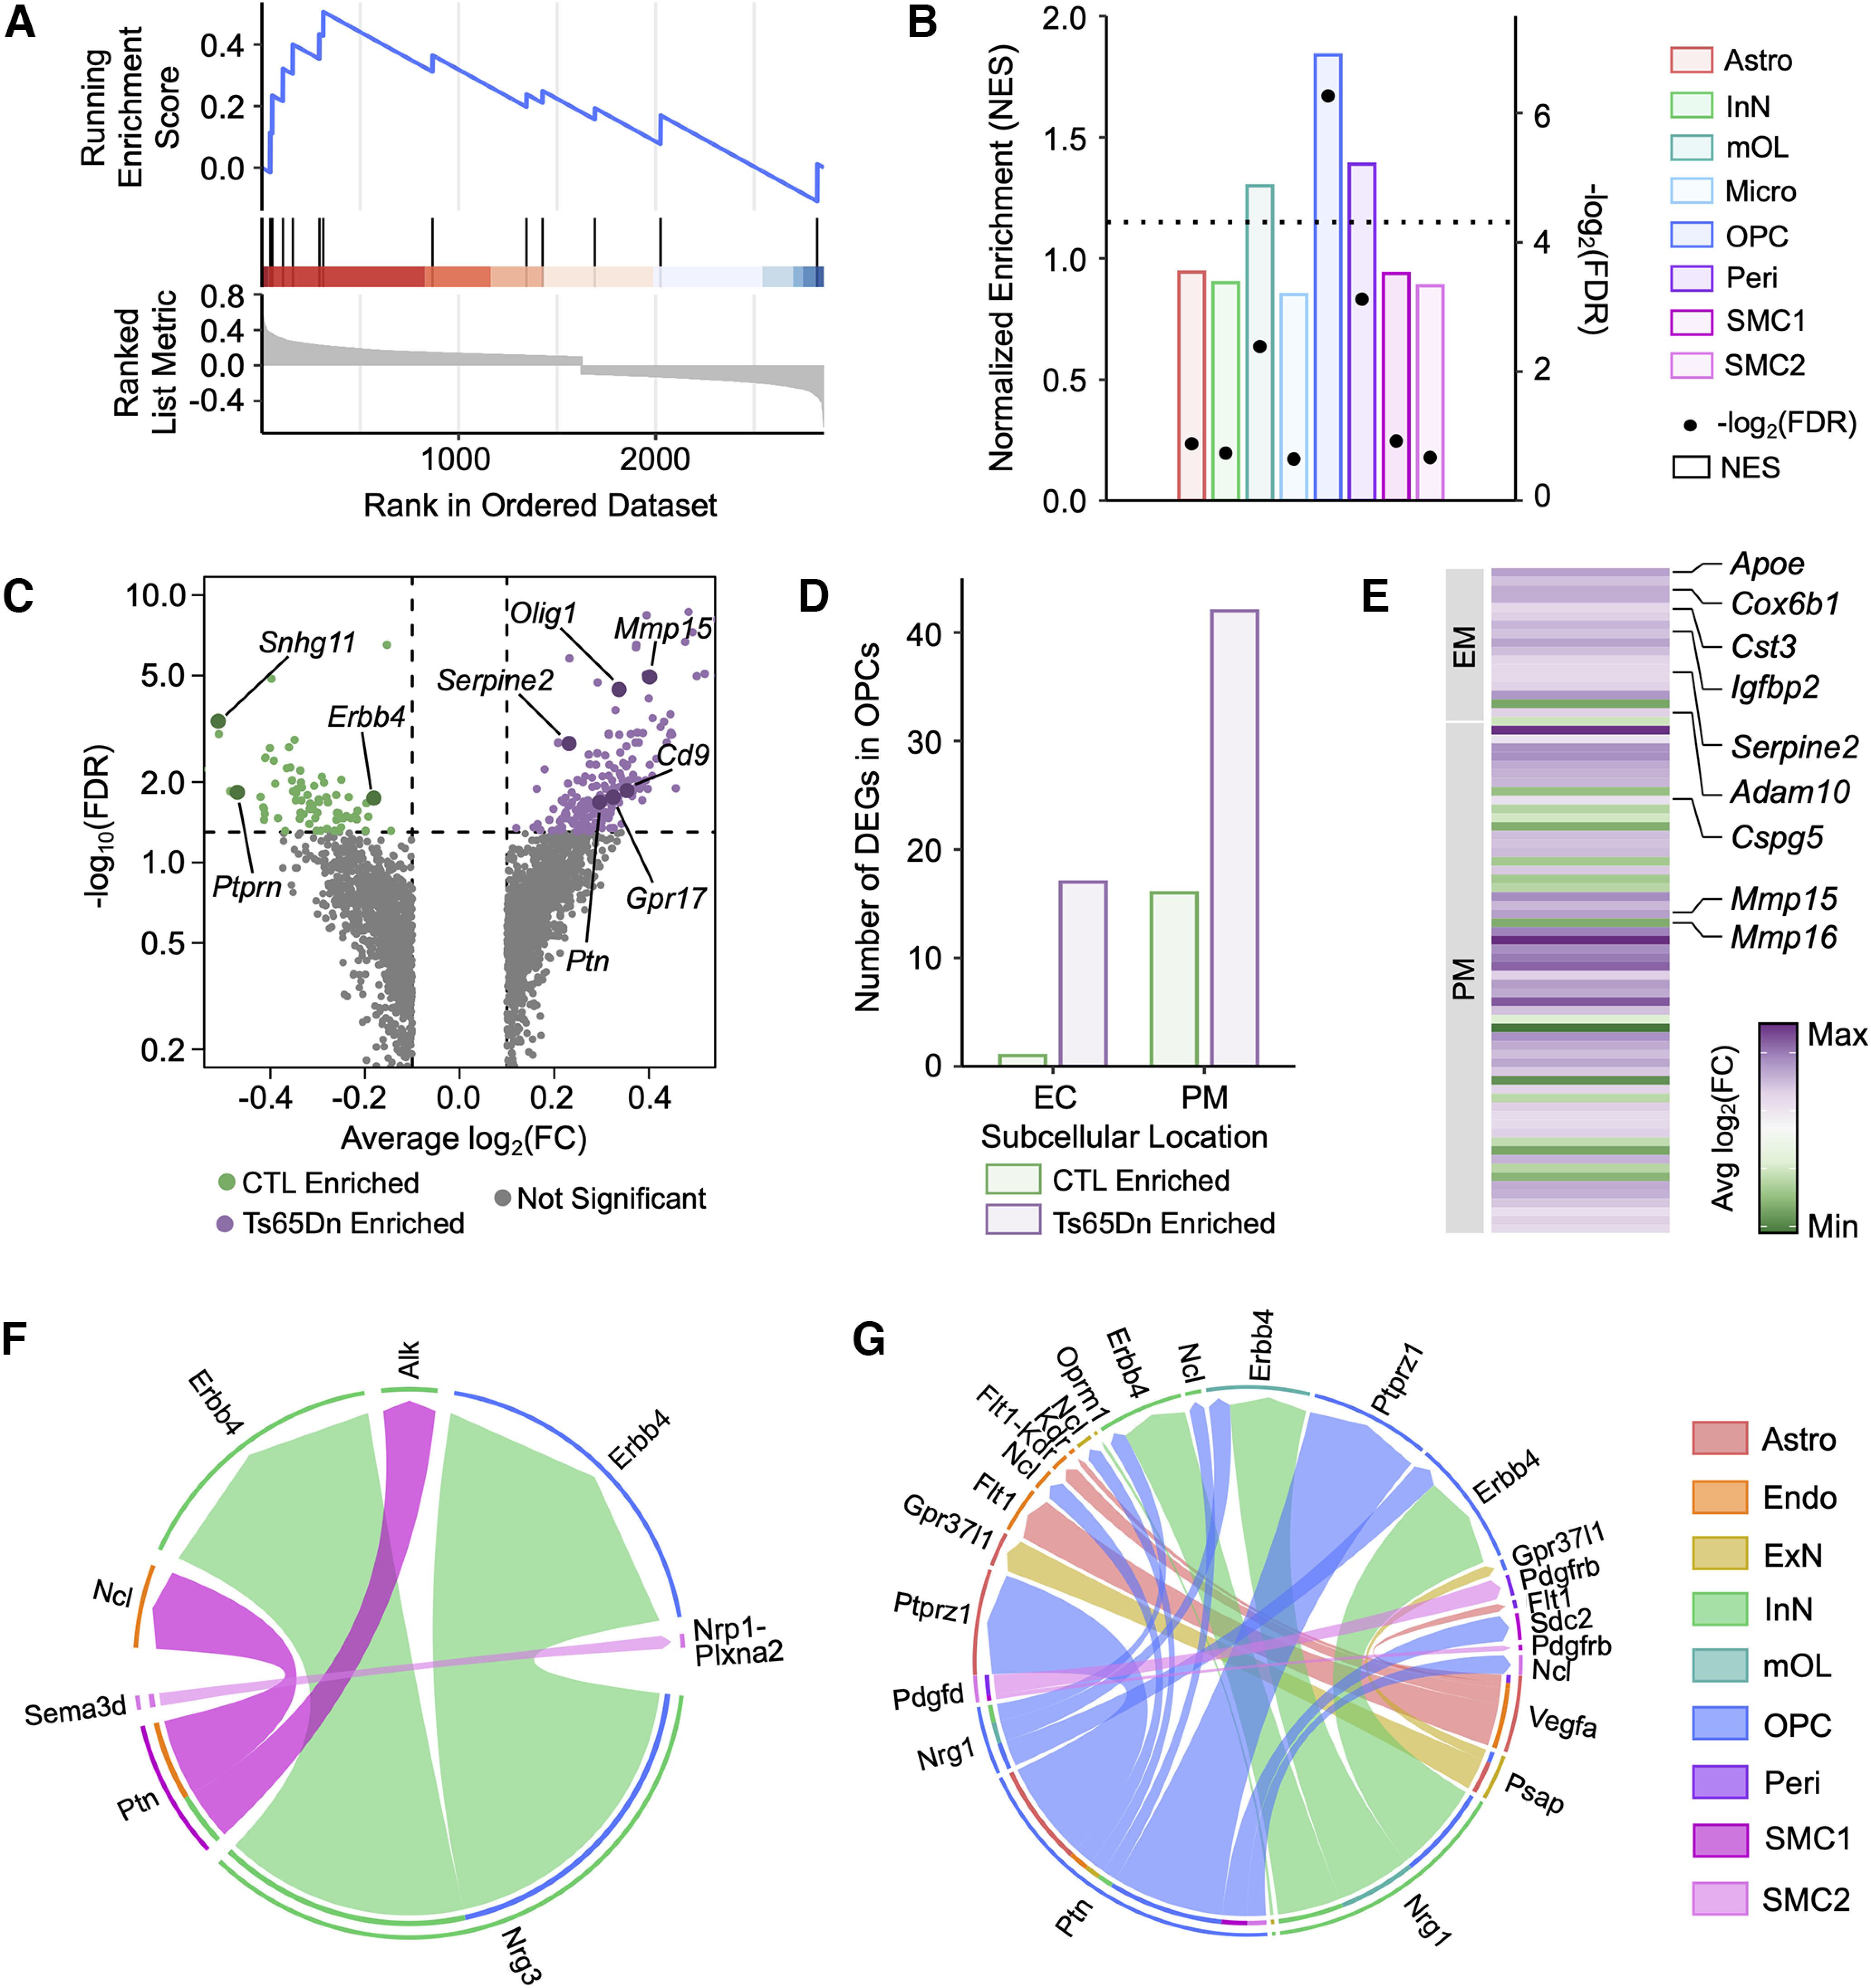
Cortical Ts65Dn OPCs exhibit a selective senescence-associated phenotype. A, GSEA-based enrichment plot of the SenMayo senescence gene set for OPCs. The upper y-axis represents the enrichment score (ES), and the blue line represents the running enrichment score. The x-axis displays gene ranked according to their expression in Ts65Dn, with the most upregulated genes on the left-hand side and the most downregulated genes toward the right-hand side. Black vertical lines depict the positions of individual genes and their enrichment within the transcriptional signature. B, Barplot displaying the enrichment of the SenMayo senescence gene set across cortical cell types. The bars correspond to the left y-axis, displaying normalized enrichment score for each cell type by pathway and are colored by cell type identity. The dots correspond to the right y-axis, displaying -log2(FDR) for each cell type by pathway; the dashed horizontal line intercepts the right y-axis at 4.3, corresponding to an FDR = 0.05. All dots above this horizontal line are statistically significant. C, Volcano plot of OPC DEGs in Ts65Dn versus CTL conditions. Only genes with an average log2fold change [avg log2(FC)] >0.1 or <−0.1. are included in the plot. Each dot represents a gene. Dots are colored according to enrichment: green dots are enriched in CTL, purple dots are enriched in Ts65Dn, and gray dots are not significantly enriched in either condition. The horizontal line depicts an FDR = 0.05, such that all genes above this line are statistically significant. D, Barplot depicting the number of DEGs (FDR < 0.05) in OPCs with functionality localized to the extracellular compartment (EC) or plasma membrane (PM). Purple bars depict DEGs enriched in Ts65Dn, and green bars depict DEGs enriched in CTL. E, Heatmap of differentially expressed genes (DEGs) localized to the extracellular compartment (EC) or plasma membrane (PM) in OPCs. Each row represents a gene. The color code represents the avg log2(FC) of gene expression between Ts65Dn and CTL. F, Chord diagram of cell-cell signaling pathways that are downregulated in Ts65Dn versus CTL. Cell type identity of the ligand is indicated in the outermost edge of the diagram, while the cell identity of the receptor is indicated by the internal ring. Colored arrows indicate the specific ligand-receptor (LR) pairs and are colored according to the outgoing ligand signal. G, As in F, but depicting cell-cell signaling pathways that are upregulated in Ts65Dn versus CTL.
Trisomic OPCs also demonstrated altered expression of several genes pertaining to maturation, proliferation, and inflammation (Fig. 4C). Among Ts65Dn-enriched OPC DEGs, we observed increased expression of Gpr17, which causes myelinogenesis defects when overexpressed in OL-lineage cells (Y. Chen et al., 2009; Ou et al., 2016), Mif, a proinflammatory cytokine that regulates NF-κB and p53 expression (Salminen and Kaarniranta, 2011; Kim et al., 2017), as well as Mmp15 and Adamts17, which are endoproteases that mediate the activity and bioavailability of inflammatory factors, such as TNFα and IL-1 (Rosenberg, 2002; Cabral-Pacheco et al., 2020). GSEA analysis of Ts65Dn OPCs also revealed an enrichment for metabolic regulation by p53, a key TF whose upregulation induces growth arrest, apoptosis, and cellular senescence (Mijit et al., 2020).
Cellular senescence is also marked by the widescale disruption of protein secretion and expression, which leads to the acquisition of a senescence-associated secretory phenotype (SASP). The SASP includes chemokines, cytokines, matrix metalloproteinases (MMPs), interleukins, and proteases, which damage and modify the surrounding microenvironment (Coppé et al., 2010). Further examination of OPC DEGs revealed that Ts65Dn-upregulated DEGs include several SASP family members, including Apoe, Igfbp2, Cst3, Serpine2, and Cox6b1 (Fig. 4D,E). Aberrant apolipoprotein E (APOE) accumulation has been shown to drive senescence through degradation of nuclear envelope proteins that lead to heterochromatin destabilization and disorganization (Zhao et al., 2022). IGFBP2 similarly induces and sustains cellular senescence by inhibiting apoptosis via the interaction with and protection of p21 (Mercurio et al., 2020). Alongside the induction of tissue sensing programs and secreted mediators, senescent cells demonstrate remodeling of the cell-surfaceome landscape through the upregulation of transcripts encoding plasma membrane (PM) proteins (H.A. Chen et al., 2023). Indeed, many of the upregulated DEGs in Ts65Dn OPCs encoded PM proteins, such as ECM molecules (Adam10, Cspg5, Mmp15/16), and VEGF signaling molecules (Cadm4, Cd63; Fig. 4D,E). Taken together, the increase in extracellular (EC) and PM-encoding transcripts suggests an enhanced capability to sense and secrete environmental cues permitting senescent Ts65Dn OPCs an increased interaction with and influence of their surrounding microenvironment.
Ligand-receptor (LR) analysis of the Ts65Dn cortex identifies changes in intercellular communication
Given the importance of cell-cell signaling in shaping neural circuits, we performed ligand-receptor (LR) mapping in the six-month Ts65Dn and euploid CTL cortex using CellChat (S. Jin et al., 2021; Materials and Methods). We sought to build a comprehensive intercellular signaling network and better understand how trisomy-driven changes in gene expression affect cell-cell signaling by leveraging the transcriptional profiles of each cell population. Network analysis showed that 24 signaling pathways in the cortex were perturbed in Ts65Dn mice. Pleiotrophin (Ptn) and neuregulin (Nrg) were among the top mediators of disrupted crosstalk between various major cell types in the Ts65Dn cortex (Fig. 4F,G).
PTN is a ligand for several receptors in the brain, including protein tyrosine phosphatase receptor type Z1 (PTPRZ1), anaplastic lymphoma kinase (ALK), and nucleolin (Ncl; X. Wang, 2020; Papadimitriou et al., 2022). We found increased Ptn to Ptprz1 signaling in OPCs, decreased Ptn to Alk signaling between SMC1 and InNs, and decreased Ptn to Ncl signaling between SMC1 and endothelial cells in the trisomic mouse brain (Fig. 4F,G). Upregulated PTN-PTPRZ1 signaling indirectly increases the bioavailability of β-catenin, whose activity can hinder both developmental myelination and adult remyelination (Harroch et al., 2002; McClain et al., 2012). The increased PTPRZ1 signaling in OPCs may thus contribute to the defective myelinogenesis observed in trisomy. Homeostatic PTN-ALK signaling promotes differentiation, growth, and survival (Bowden et al., 2002). This LR pair may therefore represent a key signaling node whose downregulation contributes to abnormalities and disruptions in Ts65Dn InN network activity (Huo et al., 2018; Giffin-Rao et al., 2022; Zorrilla de San Martin et al., 2020). NCL is expressed in endothelial cells and plays a role in angiogenesis and vascularization (Koutsioumpa et al., 2012). The downregulated signaling of a proangiogenic LR interaction in endothelial cells is thus consistent with prior observations of impaired endothelial vascular recruitment and mobilization in DS (Reynolds et al., 2010; Koutsioumpa et al., 2012).
Another set of perturbed pathways detected in Ts65Dn mice involved inferred interactions between Erbb2 receptor tyrosine kinase 4 (Erbb4) with neuregulin1 (Nrg1) and neuregulin3 (Nrg3). We uncovered increased Nrg1 to Erbb4 signaling in OPCs and InNs, and decreased Nrg3 to Erbb4 signaling between InNs and OPCs in the Ts65Dn cortex (Fig. 4F,G). NRG1 regulates neuronal plasticity and migration, OL-lineage maturation, myelination, and dendritic arborization (Mei and Xiong, 2008). In InNs, NRG1 signaling through ERBB4 plays a critical role in circuit development, neuronal differentiation and GABAergic transmission (Ting et al., 2011; Cahill et al., 2012). Similarly, this signaling is vital in regulating OPC growth, proliferation, and differentiation into mOLs (Brinkmann et al., 2008). The dysregulation of this LR interaction between InNs and OPCs may thus contribute to DS cognitive disability attributable to excitatory/inhibitory (E/I) imbalance (Souchet et al., 2014), modified neural-network excitability (Contestabile et al., 2017), and reduced axon myelination (Jose Luis Olmos-Serrano et al., 2016; Reiche et al., 2019). Like Nrg1, Nrg3 is part of the neuregulin (Nrg) family and plays an important role in neural circuitry development through Erbb4 signaling (D. Zhang et al., 1997; Mei and Nave, 2014). Its downregulation has been implicated in several neurologic and psychiatric conditions such as schizophrenia (Avramopoulos, 2018). Importantly, the imbalance of NRG signaling in the brain can drive neuropathology by compromising overall neural connectivity and circuit homeostasis. Thus, the disrupted reciprocal interaction we observe in the Ts65Dn Nrg1/3 LR networks may promote broad disruptions in brain architecture.
Ts65Dn trisomy induces unique chromatin accessibility patterns in the mature cortex
To identify cell type-specific changes in the chromatin landscape of the Ts65Dn cortex, we analyzed differentially accessible regions (DARs) in snATAC-seq (Materials and Methods). We used DARs that met an FDR value of 0.05 to define statistically significant changes in chromatin-level expression between Ts65Dn and CTL offspring. We found that DARs were highly heterogeneous across cortical cell types (Fig. 5A; Table 4) and a majority (75.1%) were downregulated (Fig. 5B). To assess the genomic distribution of DARs, we used ChIPseeker (Q. Wang et al., 2022; Materials and Methods). We found that the distribution of DARs was relatively consistent across cell types, with a majority occurring in distal regulatory sites (Fig. 5B). Across DARs, ∼6% were found in exons, ∼36% were found in promoters (<0–3 kb), and ∼56% were found in distal regulatory sites (5′/3′ UTR, introns, >300kb downstream, or intergenic; Fig. 5C).
Figure 5.
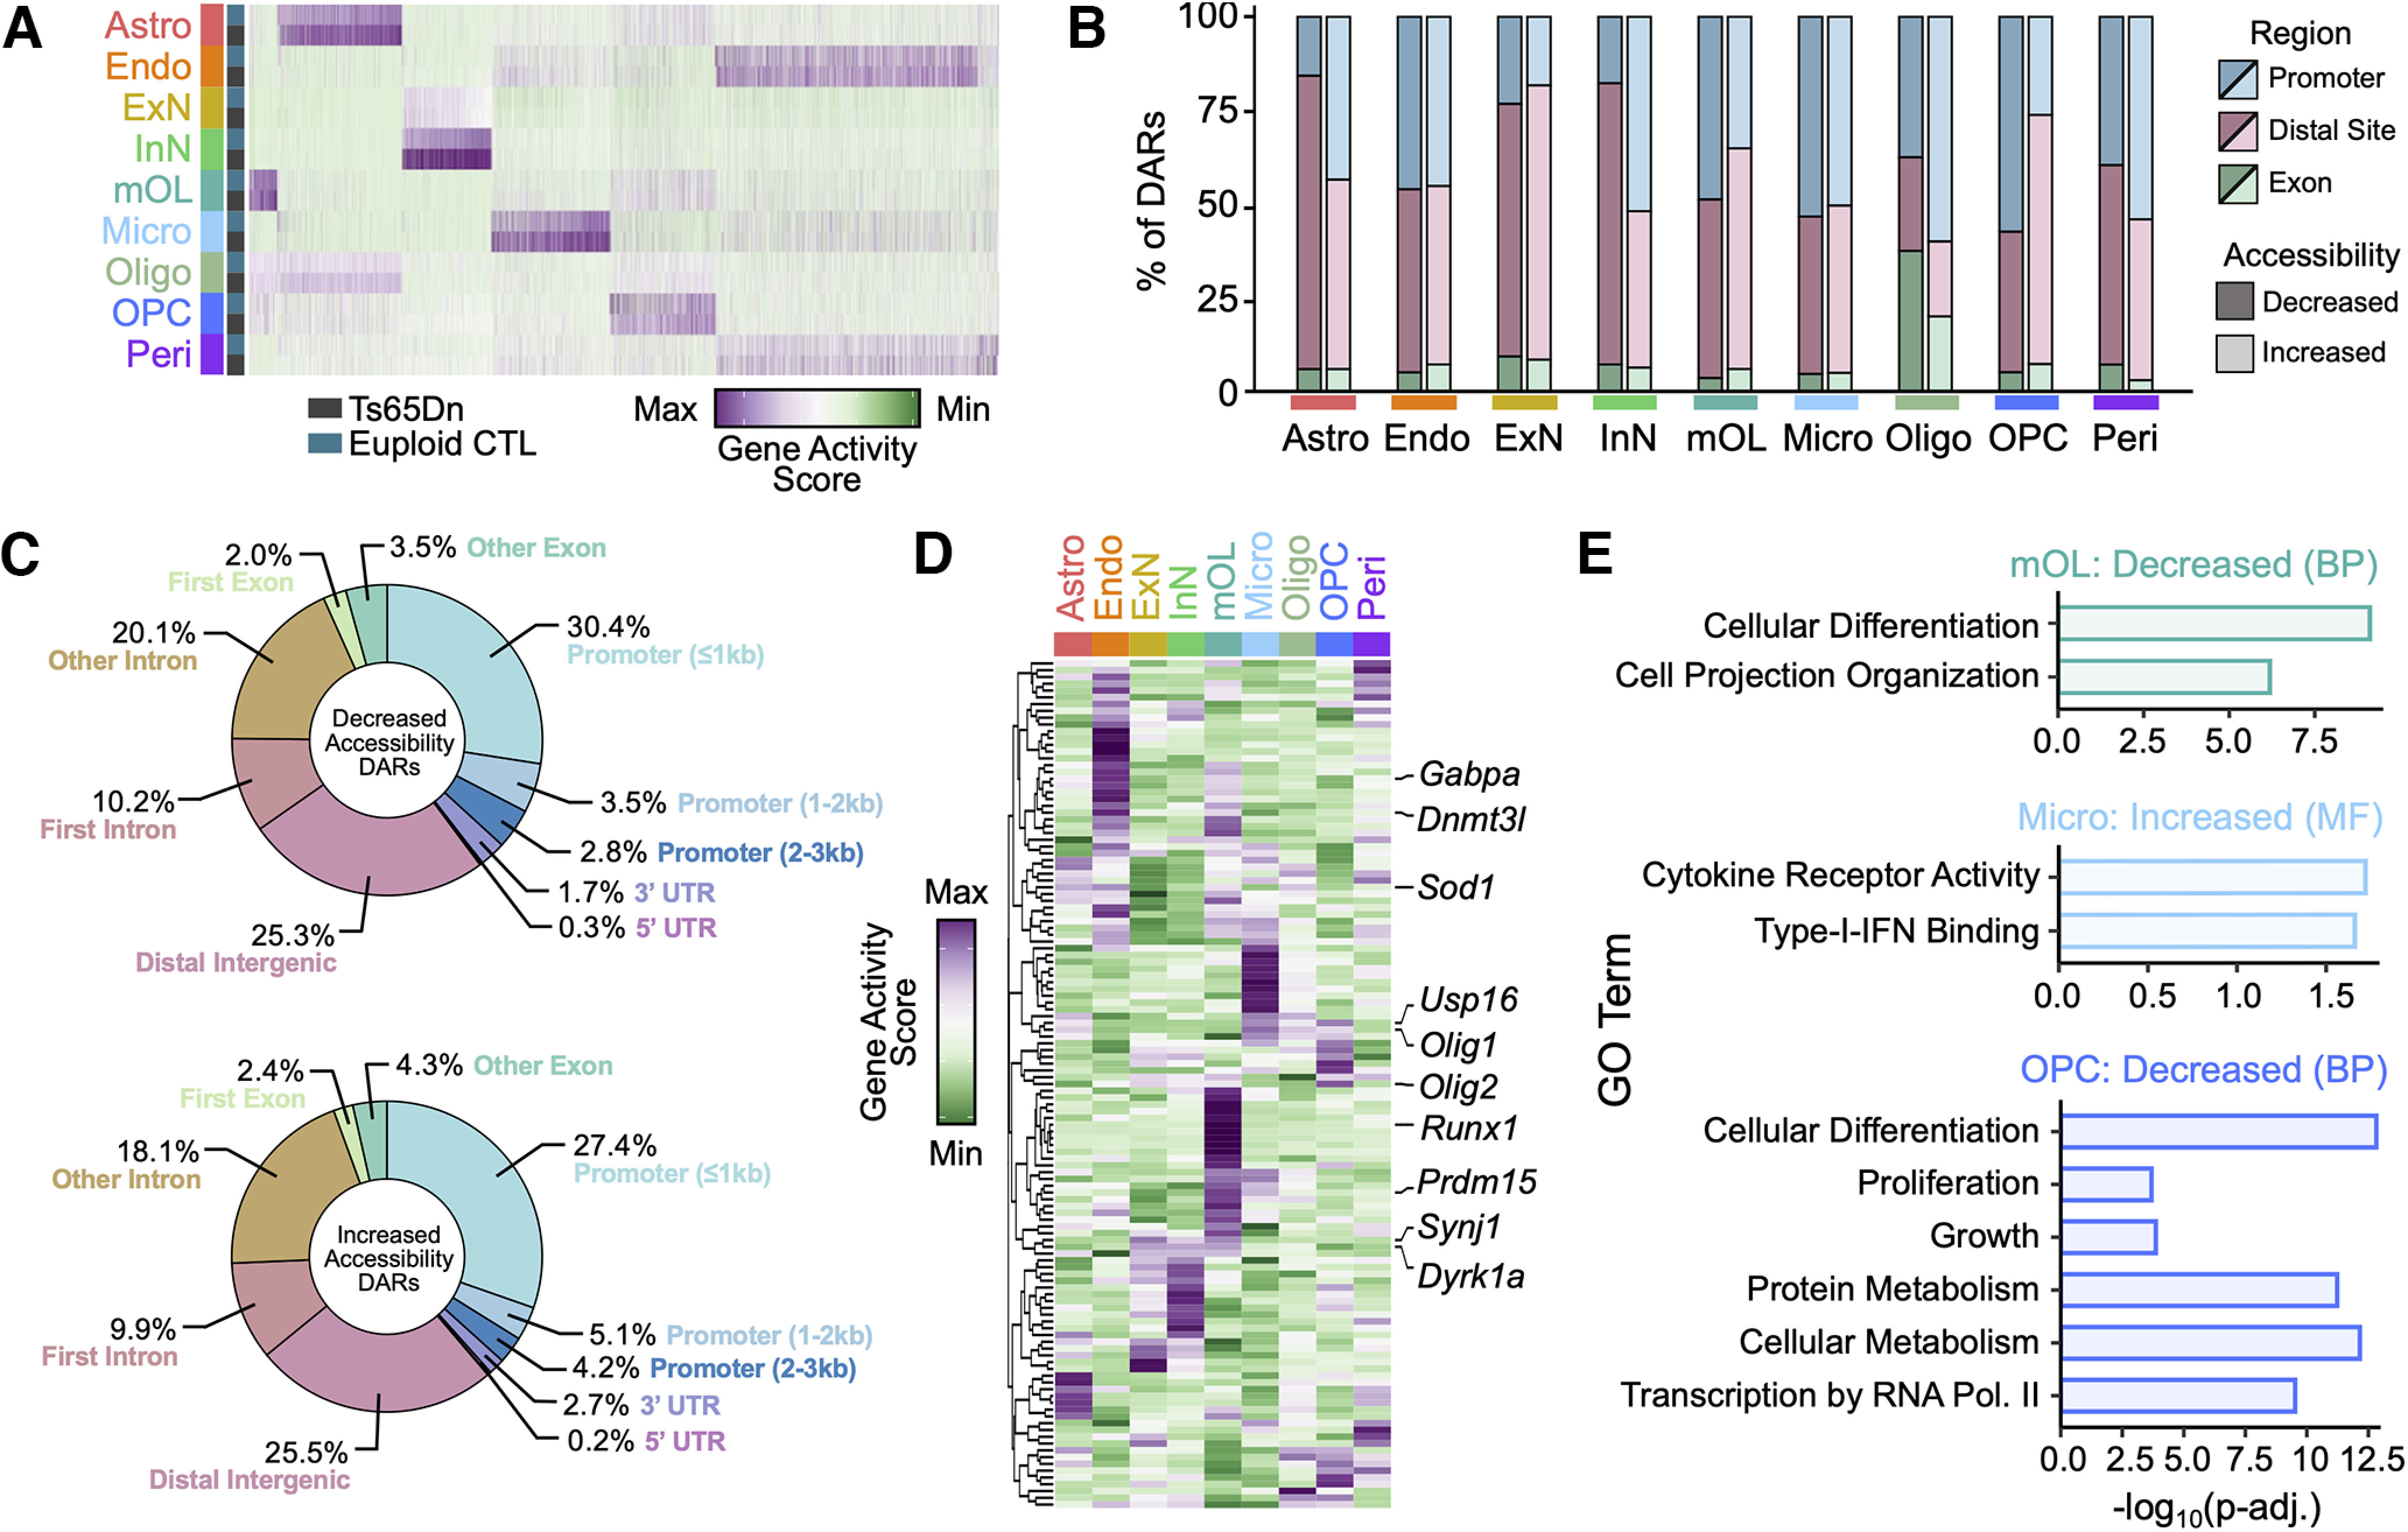
Chromatin accessibility landscape in the mature Ts65Dn cortex. A, Heatmap of the average number of cut sites within a DAR for each cell type by condition. Each column represents a cell type from Ts65Dn or CTL. The color code represents the gene activity score. B, Stacked barplot displaying the genomic distribution of differentially accessible regions (DARs). DARs located within promoters (<0–3 kb of the gene) are colored in blue, within distal regulatory sites (5′/3′ UTRs, introns, >300 kb downstream of the gene or intergenic) are colored in pink, or within exons are colored in green. Bars shaded in darker colors correspond to DARs showing decreased accessibility in Ts65Dn, and bars shaded in lighted colors correspond to DARs showing increased accessibility in Ts65Dn. Bars are grouped according to cell type identity. C, Pie chart of the genomic distribution of DARs that exhibit decreased or increased accessibility in Ts65Dn mice. Each fraction of the pie corresponds to a different genomic region, and is labeled according to the percentage of DARs associated with the specific genomic region. D, Hierarchically clustered heatmap of normalized gene accessibility for genes contained within the Ts65Dn chromosomal product. The plot displays gene activity across all cell types in snATAC-seq. Several genes of interest are indicated. Each column represents a cell type. The color code represents the row-normalized accessibility for each gene. E, Barplot of the -log10(p-adj) value of enrichment for select gene ontology (GO) biological process (BP) or molecular function (MF) terms for mature oligodendrocytes (mOL), microglia (Micro), and oligodendrocyte precursor cells (OPC). Bars are colored according to cell type.
Table 4.
Top five loci with increased accessibility in each cortical cell type in Ts65Dn mice compared with CTL
| Gene | FDR | log2(FC) | Cell type | Gene | FDR | log2(FC) | Cell type |
|---|---|---|---|---|---|---|---|
| Acsl3 | 1.24E-31 | 0.38 | Astro | Dscaml1 | 7.58E-13 | 0.21 | mOL |
| Enthd1 | 1.96E-14 | 0.31 | Astro | Prr18 | 3.44E-11 | 0.21 | mOL |
| Tiam2 | 1.63E-16 | 0.31 | Astro | Dleu2 | 1.07E-10 | 0.50 | Micro |
| Gas7 | 1.62E-12 | 0.30 | Astro | Magi1 | 7.32E-08 | 0.42 | Micro |
| Ripk4 | 7.13E-11 | 0.29 | Astro | Ccr6 | 9.00E-07 | 0.33 | Micro |
| Mlph | 2.68E-10 | 0.56 | Endo | Ccr6 | 9.37E-05 | 0.30 | Micro |
| Rnf150 | 8.14E-10 | 0.54 | Endo | Chsy1 | 2.92E-06 | 0.28 | Micro |
| Slc5a6 | 8.37E-11 | 0.53 | Endo | Snx33 | 2.22E-02 | 0.46 | Oligo |
| Calr3 | 7.76E-15 | 0.51 | Endo | Cnbd2 | 2.22E-02 | 0.43 | Oligo |
| Coro2b | 2.15E-12 | 0.47 | Endo | Dtna | 4.13E-02 | 0.30 | Oligo |
| Car10 | 2.29E-144 | 0.25 | ExN | Dyrk1a | 1.84E-02 | 0.22 | Oligo |
| Dennd1b | 1.16E-121 | 0.24 | ExN | Rps6ka2 | 2.22E-02 | 0.22 | Oligo |
| Ifi202b | 1.51E-66 | 0.17 | ExN | Itga9 | 3.93E-06 | 0.34 | OPC |
| Dleu2 | 5.09E-64 | 0.16 | ExN | Olig2 | 3.58E-09 | 0.32 | OPC |
| Pde10a | 5.43E-51 | 0.15 | ExN | Ptpn14 | 2.11E-05 | 0.31 | OPC |
| Cldn17 | 1.44E-14 | 0.16 | InN | Cspg4 | 4.11E-05 | 0.29 | OPC |
| Acoxl | 1.84E-13 | 0.16 | InN | Olig2 | 7.81E-05 | 0.29 | OPC |
| Atp5j | 1.21E-41 | 0.16 | InN | Trp53i11 | 1.18E-02 | 0.46 | Peri |
| Arhgap15 | 1.09E-10 | 0.16 | InN | Msx1 | 5.06E-03 | 0.44 | Peri |
| Mis18a | 1.25E-11 | 0.15 | InN | Rps2-ps6 | 1.04E-02 | 0.43 | Peri |
| Fcho1 | 1.52E-81 | 0.50 | mOL | Gltp | 6.28E-04 | 0.42 | Peri |
| Mylk | 1.78E-17 | 0.27 | mOL | Rps6ka2 | 2.09E-03 | 0.41 | Peri |
| App | 8.82E-22 | 0.23 | mOL |
Listed are the top five genes [ranked by highest average log2(FC)] that show significant differential accessibility in Ts65Dn mice compared with CTL as detected via snATAC-seq. Shown are fold-change values of the average expression for each gene and the false discovery rate (FDR) between Ts65Dn and CTL cells. Each cell type is listed in the final column and is abbreviated as described in Table 1.
Ts65Dn cells exhibited increased accessibility of ∼25% of Ts65Dn-encoded genes at the chromatin level. Similar to snRNA-seq, we observed heterogeneous accessibility levels of Ts65Dn triplicated genes across cell types, with only a few gene loci including the antioxidant Sod1, the kinase Dyrk1a, and the spliceosome component Son at significantly higher levels in at least seven out of nine identified cortical cell types (Fig. 5D). Increased chromatin accessibility of Olig1 and Olig2 loci was observed selectively in astrocytes, mOLs, and OPCs. Overexpression of Olig2 has been shown to preferentially drive progenitors toward a GFAP+ reactive astrocyte fate rather than an OL-lineage fate (Lu et al., 2012) and can trigger transcriptional repression during myelinogenesis (K. Zhang et al., 2022). The Runx1 locus exhibited increased accessibility in Ts65Dn microglia; RUNX1 is a TF that modulates microglial gene expression during early postnatal life, but can increase in adults following brain injury or infection to promote microglial activation (Zusso et al., 2012; Yeh and Ikezu, 2019). Synj1 was another locus that showed selective increased accessibility in trisomic InNs and is known for its involvement with endocytosis and synaptic vesicle cycling (Choudhry et al., 2021). Specifically, elevated levels of SYNJ1 have been shown to trigger deficits in age-dependent long-term memory retention in individuals with DS-related AD (Miranda et al., 2018), thus implicating SYNJ1 as a key mediator of cognitive disability.
We next employed gene ontology (GO) analysis to assess biological pathways associated with chromatin accessibility changes in Ts65Dn mice (Materials and Methods; Table 5; Raudvere et al., 2019). Among downregulated DARs from trisomic OPCs and mOLs, we observed an enrichment of GO categories associated with cell differentiation, projection organization, and regulation of metabolic processes (Fig. 5E). We also found enrichment of biological process (BP) ontologies associated with growth and proliferation in trisomic OPC DARs with decreased accessibility, further suggesting a disruption in OPC development and a growth arrest typical of a senescence phenotype (Fig. 5E). Consistent with the hyperactive inflammatory milieu known to occur in the trisomic brain (Wilcock, 2012; Flores-Aguilar et al., 2020), we observed an enrichment of cytokine receptor activity and type-I-IFN binding among the top five enriched molecular function (MF) categories for increased accessibility DARs in Ts65Dn microglia (Fig. 5E). Taken together, these findings demonstrate that trisomy has a profound genome-wide impact on gene expression, with a notable effect on genes related to inflammation and differentiation in glial cell populations.
Table 5.
Top three Ts65Dn enriched biological processes (BP) in each cortical cell type identified via gene ontology (GO) analysis in Ts65Dn mice compared with CTL
| GO biological process (BP) pathway | FDR | Gene ratio | Cell type |
|---|---|---|---|
| System development | 1.05E-05 | 0.35 | Astro |
| Positive regulation of biological process | 1.76E-05 | 0.45 | Astro |
| Regulation of metabolic process | 7.97E-05 | 0.47 | Astro |
| Anatomical structure development | 1.66E-20 | 0.42 | Endo |
| Negative regulation of cellular process | 1.57E-19 | 0.36 | Endo |
| Developmental process | 3.78E-19 | 0.44 | Endo |
| Phosphate-containing compound metabolic process | 6.34E-04 | 0.40 | ExN |
| Phosphorus metabolic process | 7.09E-04 | 0.40 | ExN |
| Organophosphate metabolic process | 4.31E-03 | 0.24 | ExN |
| Synapse assembly | 6.34E-03 | 0.10 | InN |
| Animal organ development | 1.27E-02 | 0.37 | InN |
| Positive regulation of gene expression | 1.92E-02 | 0.20 | InN |
| Cell development | 1.08E-07 | 0.32 | mOL |
| Neurogenesis | 3.24E-07 | 0.27 | mOL |
| Nervous system development | 9.38E-07 | 0.31 | mOL |
| Regulation of cellular process | 2.93E-05 | 0.67 | Micro |
| Biosynthetic process | 3.88E-05 | 0.41 | Micro |
| Cellular biosynthetic process | 7.17E-05 | 0.40 | Micro |
| Multicellular organism development | 5.54E-22 | 0.44 | OPC |
| Anatomical structure development | 3.08E-21 | 0.49 | OPC |
| System development | 1.13E-19 | 0.40 | OPC |
| Cellular localization | 2.48E-05 | 0.35 | Peri |
| Phosphate-containing compound metabolic process | 7.90E-04 | 0.29 | Peri |
| Phosphorus metabolic process | 9.26E-04 | 0.29 | Peri |
Listed are the top three biological processes (BP) identified via GO analysis (ranked by lowest FDR value) that are significantly enriched in Ts65Dn mice compared with CTL. The gene ratio is defined as the ratio between the intersection size and query size. Oligo cells were not included in this list, as no pathways were significantly enriched (FDR < 0.05) between conditions. Each cell type is listed in the final column and is abbreviated as described in Table 1.
Ts65Dn OPCs exhibit an altered chromatin state consistent with cellular senescence
To assess locus-specific changes in Ts65Dn OPC chromatin accessibility, we more closely examined population-level DARs. Herein, we observed reduced accessibility at several cell growth and mitosis regulatory loci (Fig. 6A), including Tacc3, Knstrn, Ptprg, and Spag9, whose suppression can induce cell-cycle arrest and tend cells toward a senescent state (C.S. Lee et al., 2014; Cheung et al., 2015; Suhail et al., 2015; Jagadish et al., 2016). Further, we observed increased accessibility at several chondroitin sulfate proteoglycans (CSPG) loci, including Tnr, Bcan, Vcan, Acan, and Ncan (Jang et al., 2020; Fig. 6A). CSPGs have been found to negatively regulate OPC proliferation, differentiation and remyelination, as well as induce production of proinflammatory cytokines (Ghorbani and Yong, 2021; Tewari et al., 2022). Similar to our findings in snRNA-seq data, we found that Ts65Dn OPCs exhibited an increase in accessibility at several endoprotease loci, including Mmp15/19, Adam12, and Adamts5/17 loci (Fig. 6A), all of which play a role in modulating neuroimmune activity through the regulation of proinflammatory cytokine availability and signaling (Rosenberg, 2002; Cabral-Pacheco et al., 2020).
Figure 6.
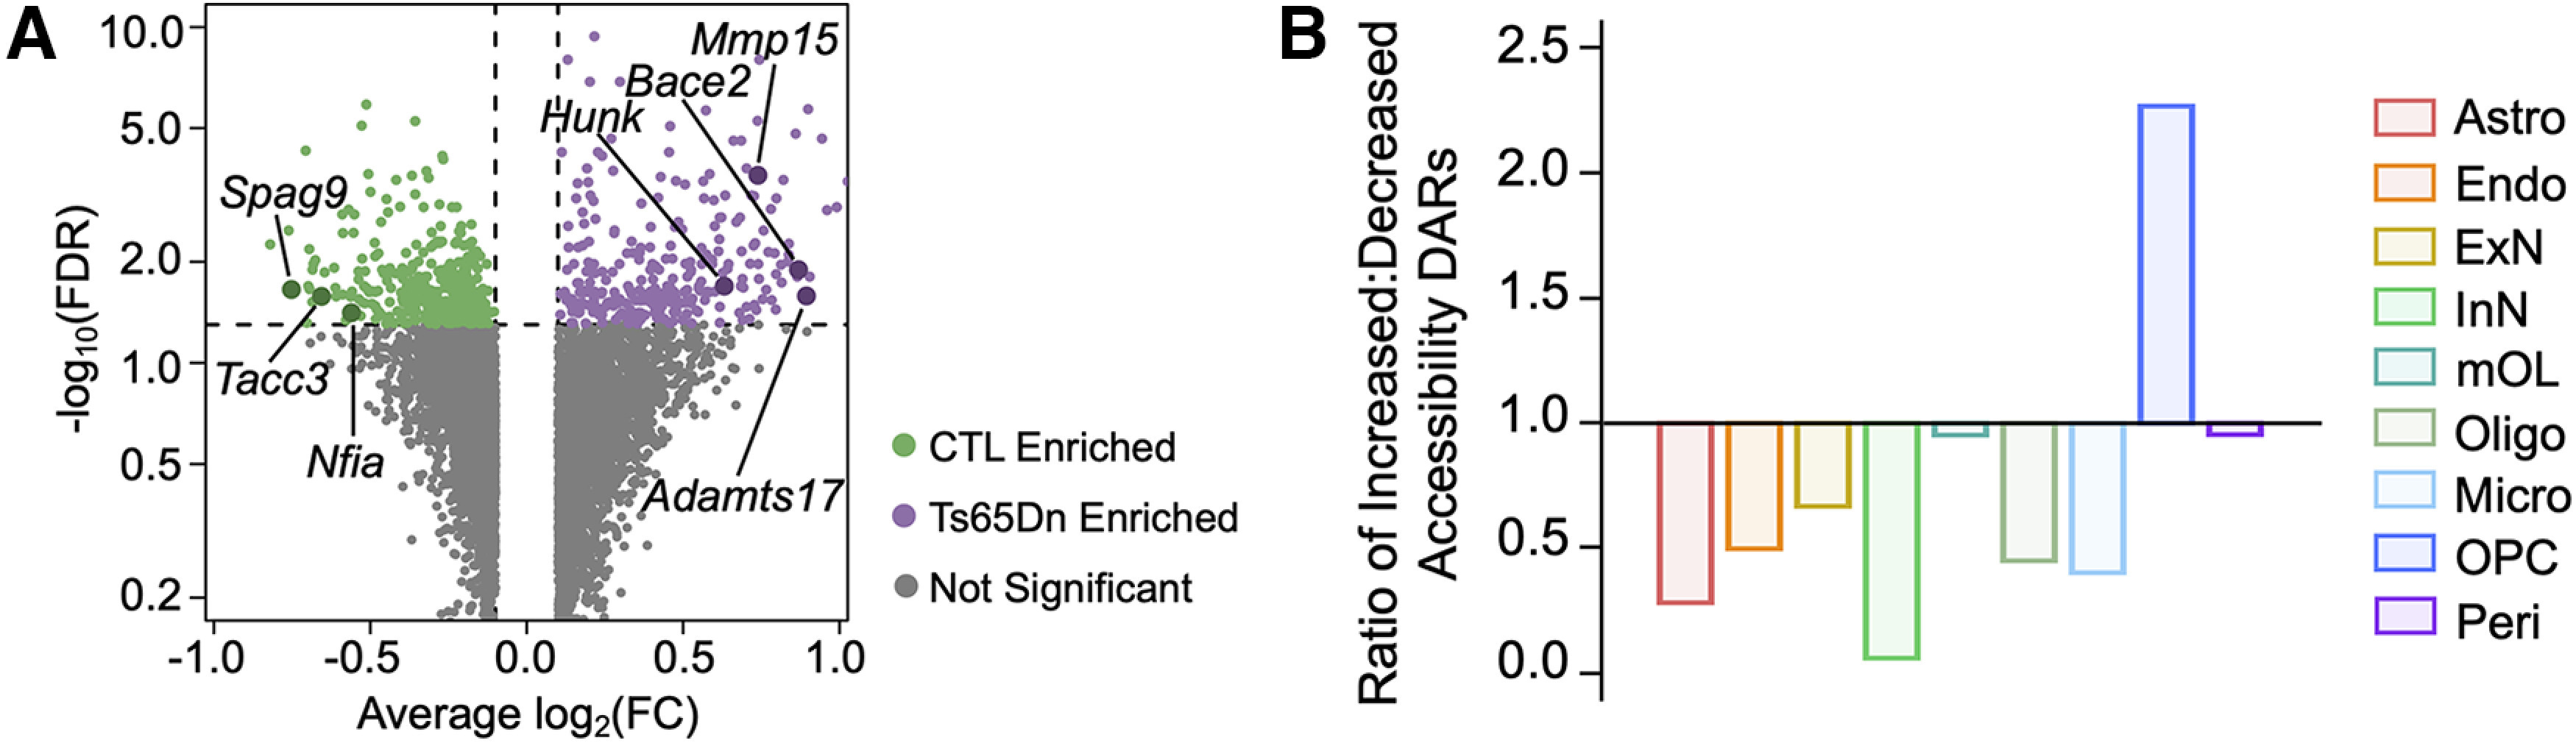
Cortical Ts65Dn OPCs exhibit senescence-associated chromatin changes. A, Volcano plot of OPC DARs in Ts65Dn versus CTL conditions. Only genes with an average log2fold change [log2(FC)] >0.1 or <−0.1. are included in the plot. Each dot represents a gene. Dots are colored according to enrichment: green dots are enriched in CTL, purple dots are enriched in Ts65Dn, and gray dots are not significantly enriched in either condition. The horizontal line depicts an FDR = 0.05, such that all genes above this line are statistically significant. B, Barplot displaying the ratio of DARs with increased to decreased accessibility across all cell types. A ratio of 1 indicates an equal number of increased and decreased DARs, while a ratio of greater or <1 indicates a greater number of increased or decreased DARs, respectively. Each bar is colored by cell type identity. Only statistically significant DARs (FDR < 0.05) are included.
Structural changes within and around senescent cells are also accompanied by dramatic molecular changes to the epigenetic landscape, including a global reduction in heterochromatin (Sadaie et al., 2013; Nacarelli et al., 2017; Sidler et al., 2017). To investigate whether cortical Ts65Dn OPCs exhibited this senescence-associated loss of heterochromatin, we compared the number of DARs with increased or decreased accessibility in Ts65Dn versus euploid CTL across all cell types. We found a greater number of peaks with increased accessibility in Ts65Dn relative to CTL only in OPCs, consistent with a net increase in chromatin accessibility (Fig. 6B). All other cell types profiled through snATAC-seq exhibited a greater number of peaks with decreased accessibility, suggestive of a cell type-specific loss of heterochromatin consistent with selective senescence in Ts65Dn OPCs.
Cell type-specific transcription factors (TF) in the trisomic mouse cortex
To gain insight into transcription factor (TF)-mediated gene regulation in Ts65Dn mice, we constructed cell type-specific TF regulatory networks based on the presence of binding motifs within DARs. We used chromVAR (Schep et al., 2017) to identify shared and cell type-specific gene-chromatin interactions using our snATAC-seq data and observed unique TFs enriched across all cortical cell types (Materials and Methods; Fig. 7A; Table 6).
Figure 7.
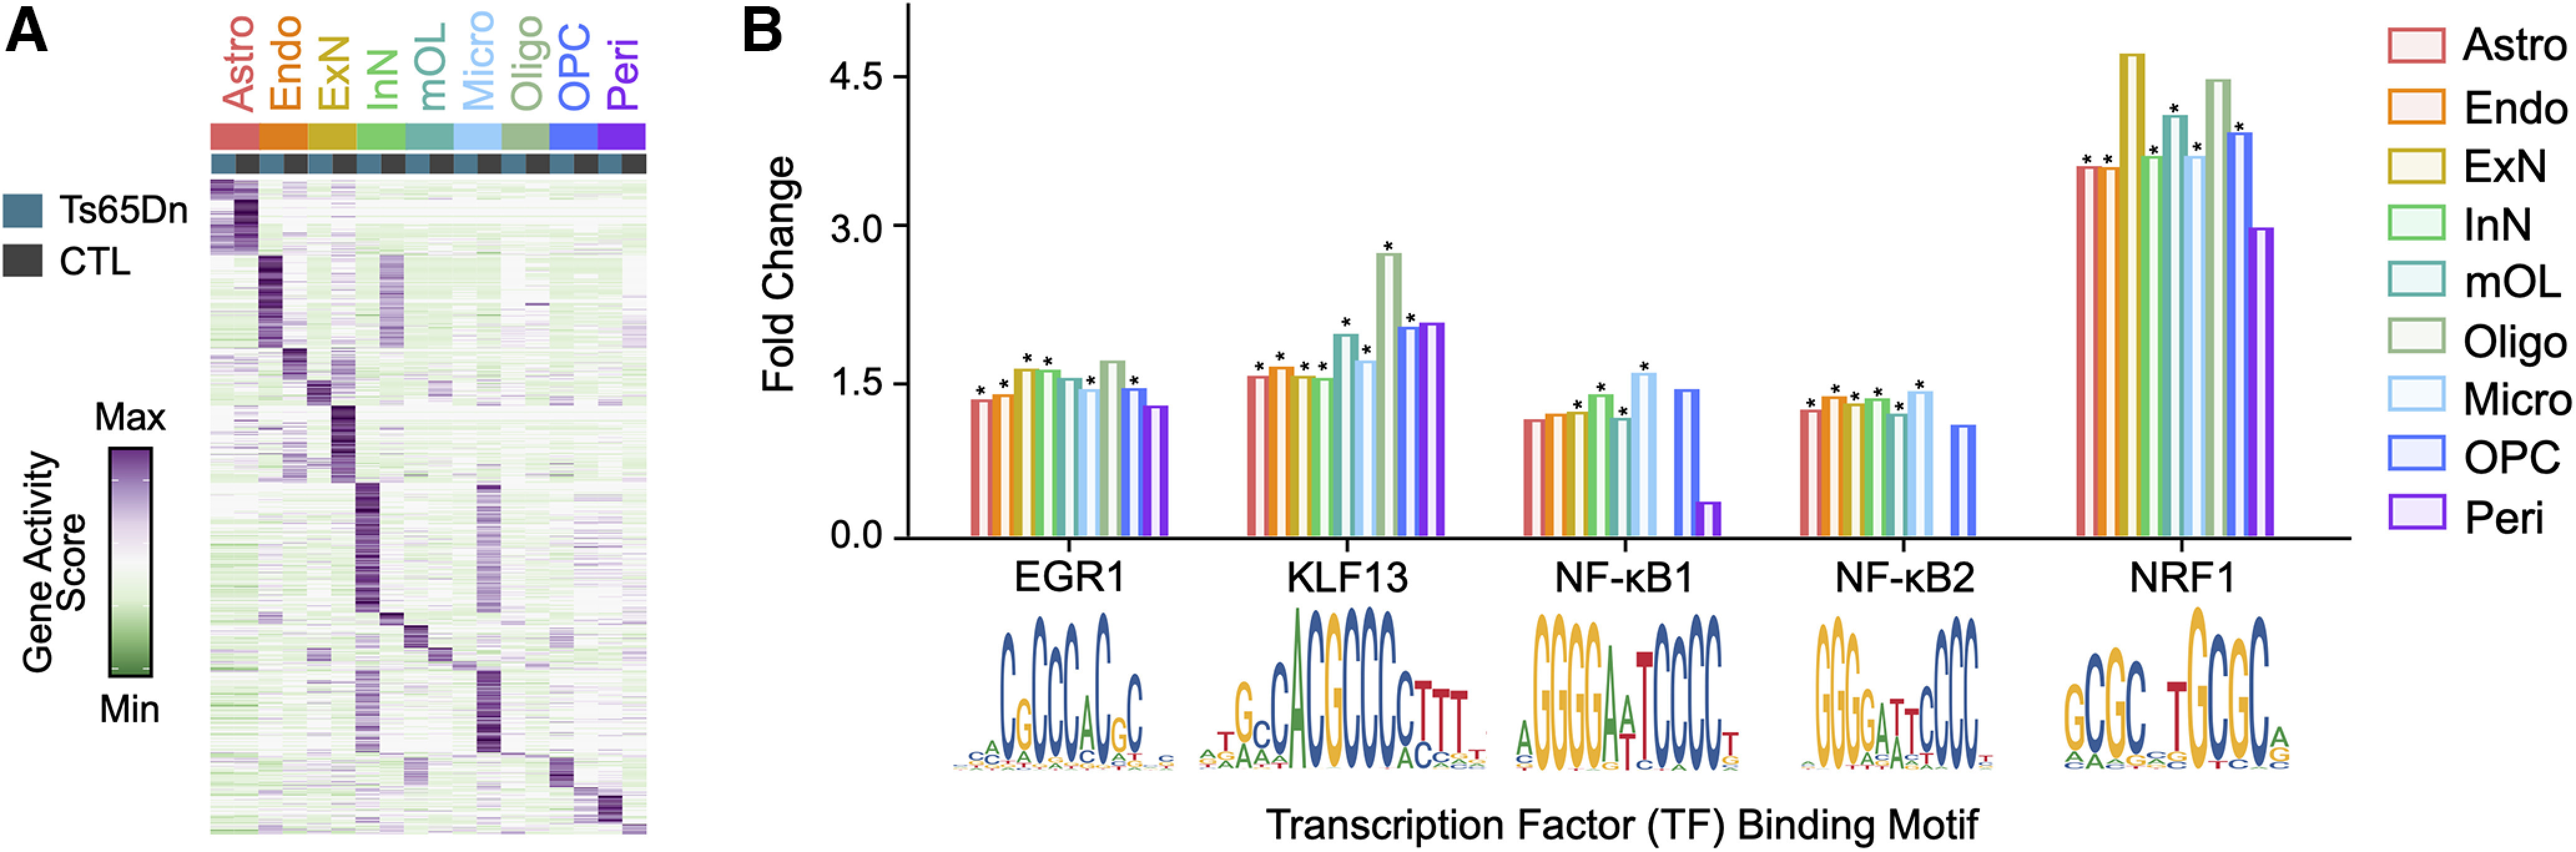
Cell type-specific transcription factor (TF) activity in the mature Ts65Dn cortex. A, Heatmap of average ChromVAR transcription factor (TF) motif activity for each cell type. Each column represents a cell type from Ts65Dn or CTL. The color code represents the row-normalized accessibility for each TF. B, Barplot showing the relative fold change for select TFs between Ts65Dn and CTL. Each bar corresponds to a cell type. Bars labeled with asterisks indicate statistically significant enrichment (FDR < 0.05) for the given TF. Beneath each grouped barplot is the position weight matrix (PWM) for the binding motif associated with each TF.
Table 6.
Top five transcription factor (TF) binding motifs enriched within DARs in each cortical cell type in Ts65Dn mice compared with CTL
| Motif | FDR | FE | Cell type | Motif | FDR | FE | Cell type |
|---|---|---|---|---|---|---|---|
| HINFP | 4.40E-116 | 4.34 | Astro | HINFP | 2.89E-308 | 4.71 | mOL |
| ZBTB33 | 1.29E-74 | 4.17 | Astro | ZBTB33 | 1.29E-167 | 4.50 | mOL |
| ZBTB14 | 3.16E-232 | 3.69 | Astro | YY2 | 1.03E-263 | 3.84 | mOL |
| NRF1 | 4.23E-241 | 3.63 | Astro | ELK1 | 9.27E-205 | 3.48 | mOL |
| TFDP1 | 1.84E-164 | 3.62 | Astro | HES1 | 5.44E-200 | 3.21 | mOL |
| HINFP | 7.04E-59 | 4.21 | Endo | HINFP | 7.84E-32 | 4.09 | Micro |
| ZBTB14 | 7.86E-141 | 3.83 | Endo | TFDP1 | 2.05E-58 | 3.84 | Micro |
| NRF1 | 4.69E-134 | 3.62 | Endo | NRF1 | 2.24E-76 | 3.73 | Micro |
| ZBTB33 | 1.05E-25 | 3.44 | Endo | YY2 | 1.95E-34 | 3.69 | Micro |
| TFDP1 | 4.72E-81 | 3.41 | Endo | ZBTB14 | 1.76E-66 | 3.62 | Micro |
| ZFP57 | 3.33E-240 | 2.44 | ExN | KLF14 | 1.64E-02 | 5.79 | Oligo |
| E2F2 | 1.52E-62 | 2.27 | ExN | NRF1 | 2.88E-43 | 3.96 | OPC |
| CENPB | 2.12E-88 | 2.27 | ExN | ZBTB14 | 3.04E-37 | 3.82 | OPC |
| E2F1 | 1.29E-66 | 2.23 | ExN | HINFP | 3.74E-13 | 3.81 | OPC |
| E2F4 | 3.49E-65 | 2.20 | ExN | ZBTB33 | 2.17E-07 | 3.54 | OPC |
| ZBTB33 | 5.01E-238 | 4.13 | InN | TCFL5 | 3.67E-19 | 3.50 | OPC |
| HES1 | 2.82E-248 | 2.88 | InN | E2F1 | 1.58E-06 | 17.31 | Peri |
| ELK1 | 4.88E-178 | 2.70 | InN | KLF15 | 1.21E-02 | 2.72 | Peri |
| YY2 | 3.61E-179 | 2.69 | InN | KLF14 | 3.52E-02 | 2.54 | Peri |
| EGR2 | 6.27E-254 | 2.30 | InN |
Listed are the top five TF motifs [ranked by highest fold enrichment (FE)] that show significant enrichment in Ts65Dn mice compared with CTL. Shown are FE values for each binding motif and the false discovery rate (FDR) between Ts65Dn and CTL cells. Each cell type is listed in the final column and is abbreviated as described in Table 1.
ChromVAR detected enrichment of the early growth response factor 1 (EGR1) TF binding site in DS InNs (Fig. 7B), which was supported by increased Egr1 mRNA in Ts65Dn InNs. EGR1 regulates the development of GABA receptor subunit genes, thus acting as a key regulator of InN development (Mo et al., 2015). KLF13, which binds to regulatory regions of genes that are important for OL differentiation and maturation, such as Mag, Mbp, and Plp1 (Bernhardt et al., 2022), similarly showed increased motif accessibility and increased Klf13 expression in snRNA-seq (Fig. 7B).
In trisomic endothelial cells, ExNs, InNs, microglia, and mOLs, we observed a marked increase in motif enrichment for nuclear factor κ-light-chain-enhancer of activated B cells (NF-κB1 and NF-κB2), a critical modulator of cell growth, cell survival, development, and inflammation (Liu et al., 2017; Fig. 7B). This increase in NF-κB1/2 TF accessibility across several cortical cell types suggests an increase in inflammatory signaling, consistent with the hyperimmune milieu observed in trisomy. Additionally, we found an enrichment of nuclear respiratory factor 1 (NRF1) motif accessibility in all trisomic major neuronal and non-neuronal cell types except for mOLs and pericytes (Fig. 7B). NRF1 is a key regulator of cell growth, apoptosis, senescence, neurogenesis, genomic instability, and mitochondrial function (Preciados et al., 2016). A disruption in mitochondrial biogenesis, driven by NRF1 dysregulation, has been observed in many neurodegenerative and neurodevelopmental disorders including AD, Parkinson’s disease (PD), and Huntington’s disease (HD), and may play a similar role in widespread neurogenesis or myelination deficits in DS (Satoh et al., 2013; Preciados et al., 2016; Morabito et al., 2021). Lastly, we noted enrichment of the hairy and enhancer of split-1 (HES1) motif in Ts65Dn ExNs, InNs, and OPCs relative to euploid CTL (Fig. 7B). HES1 represses proneural or differentiation genes to keep stem cell progenitors in quiescent or proliferative states (Ogata et al., 2011; Fan et al., 2018; Hu and Zou, 2022). Importantly, HES1 expression is downregulated during myelination, and HES1 overexpression in OPCs results in impaired oligodendrogenesis (Li et al., 2021). Together, these results show that Ts65Dn trisomy leads to widespread perturbation of TF activity and binding motif accessibility, which may contribute to key elements of trisomy-associated neuropathology.
Deep layer cortical Ts65Dn OPCs display increased senescence
To support our finding of an enriched senescence-associated gene signature in Ts65Dn OPCs, we assayed coronal brain sections from three- and six-month mice for lysosomal senescence-associated-β-galactosidase (SA-β-gal) activity coupled with immunohistochemistry (IHC; Materials and Methods). We profiled several major cortical cell types using antibodies against canonical marker genes, including astrocytes (AQP4+), microglia (IBA1+), neurons (NEUN+), OL-lineage cells (OLIG2+), and OPCs (PDGFRA+). Analysis of the cortex was restricted to a region of interest (ROI) of ∼3 mm2 across the motor and somatosensory regions (Fig. 8A; Materials and Methods). Ts65Dn mice exhibited a 1.7-fold increase in OLIG2+ SA-β-gal activity at three months (t(1) = 6.79, p = 0.021; Table 7) and a 1.8-fold increase in OLIG2+ SA-β-gal activity at six months (Genotype effect, F(2) = 305.25, p = 1.3 × 10⁻⁶), as well as a 1.4-fold increase in PDGFRA+ SA-β-gal activity at three months (t(3) = 9.97, p = 0.0021) and a 1.3-fold increase in PDGFRA+ SA-β-gal activity at six months (Genotype effect, F(4) = 24.87, p = 0.0063; Fig. 8B,C). Intriguingly, we observed that the increase in OL-lineage senescence was restricted to the deep layers (L5–L6) of the Ts65Dn cortex and was absent in the upper cortical layers (L1–L4) and the corpus callosum (CC; Fig. 8D). No other major cortical cell type demonstrated a significant increase in SA-β-gal activity in Ts65Dn mice (Fig. 8E). Overall, this analysis is suggestive of a regional and cell type-specific senescence phenotype.
Figure 8.
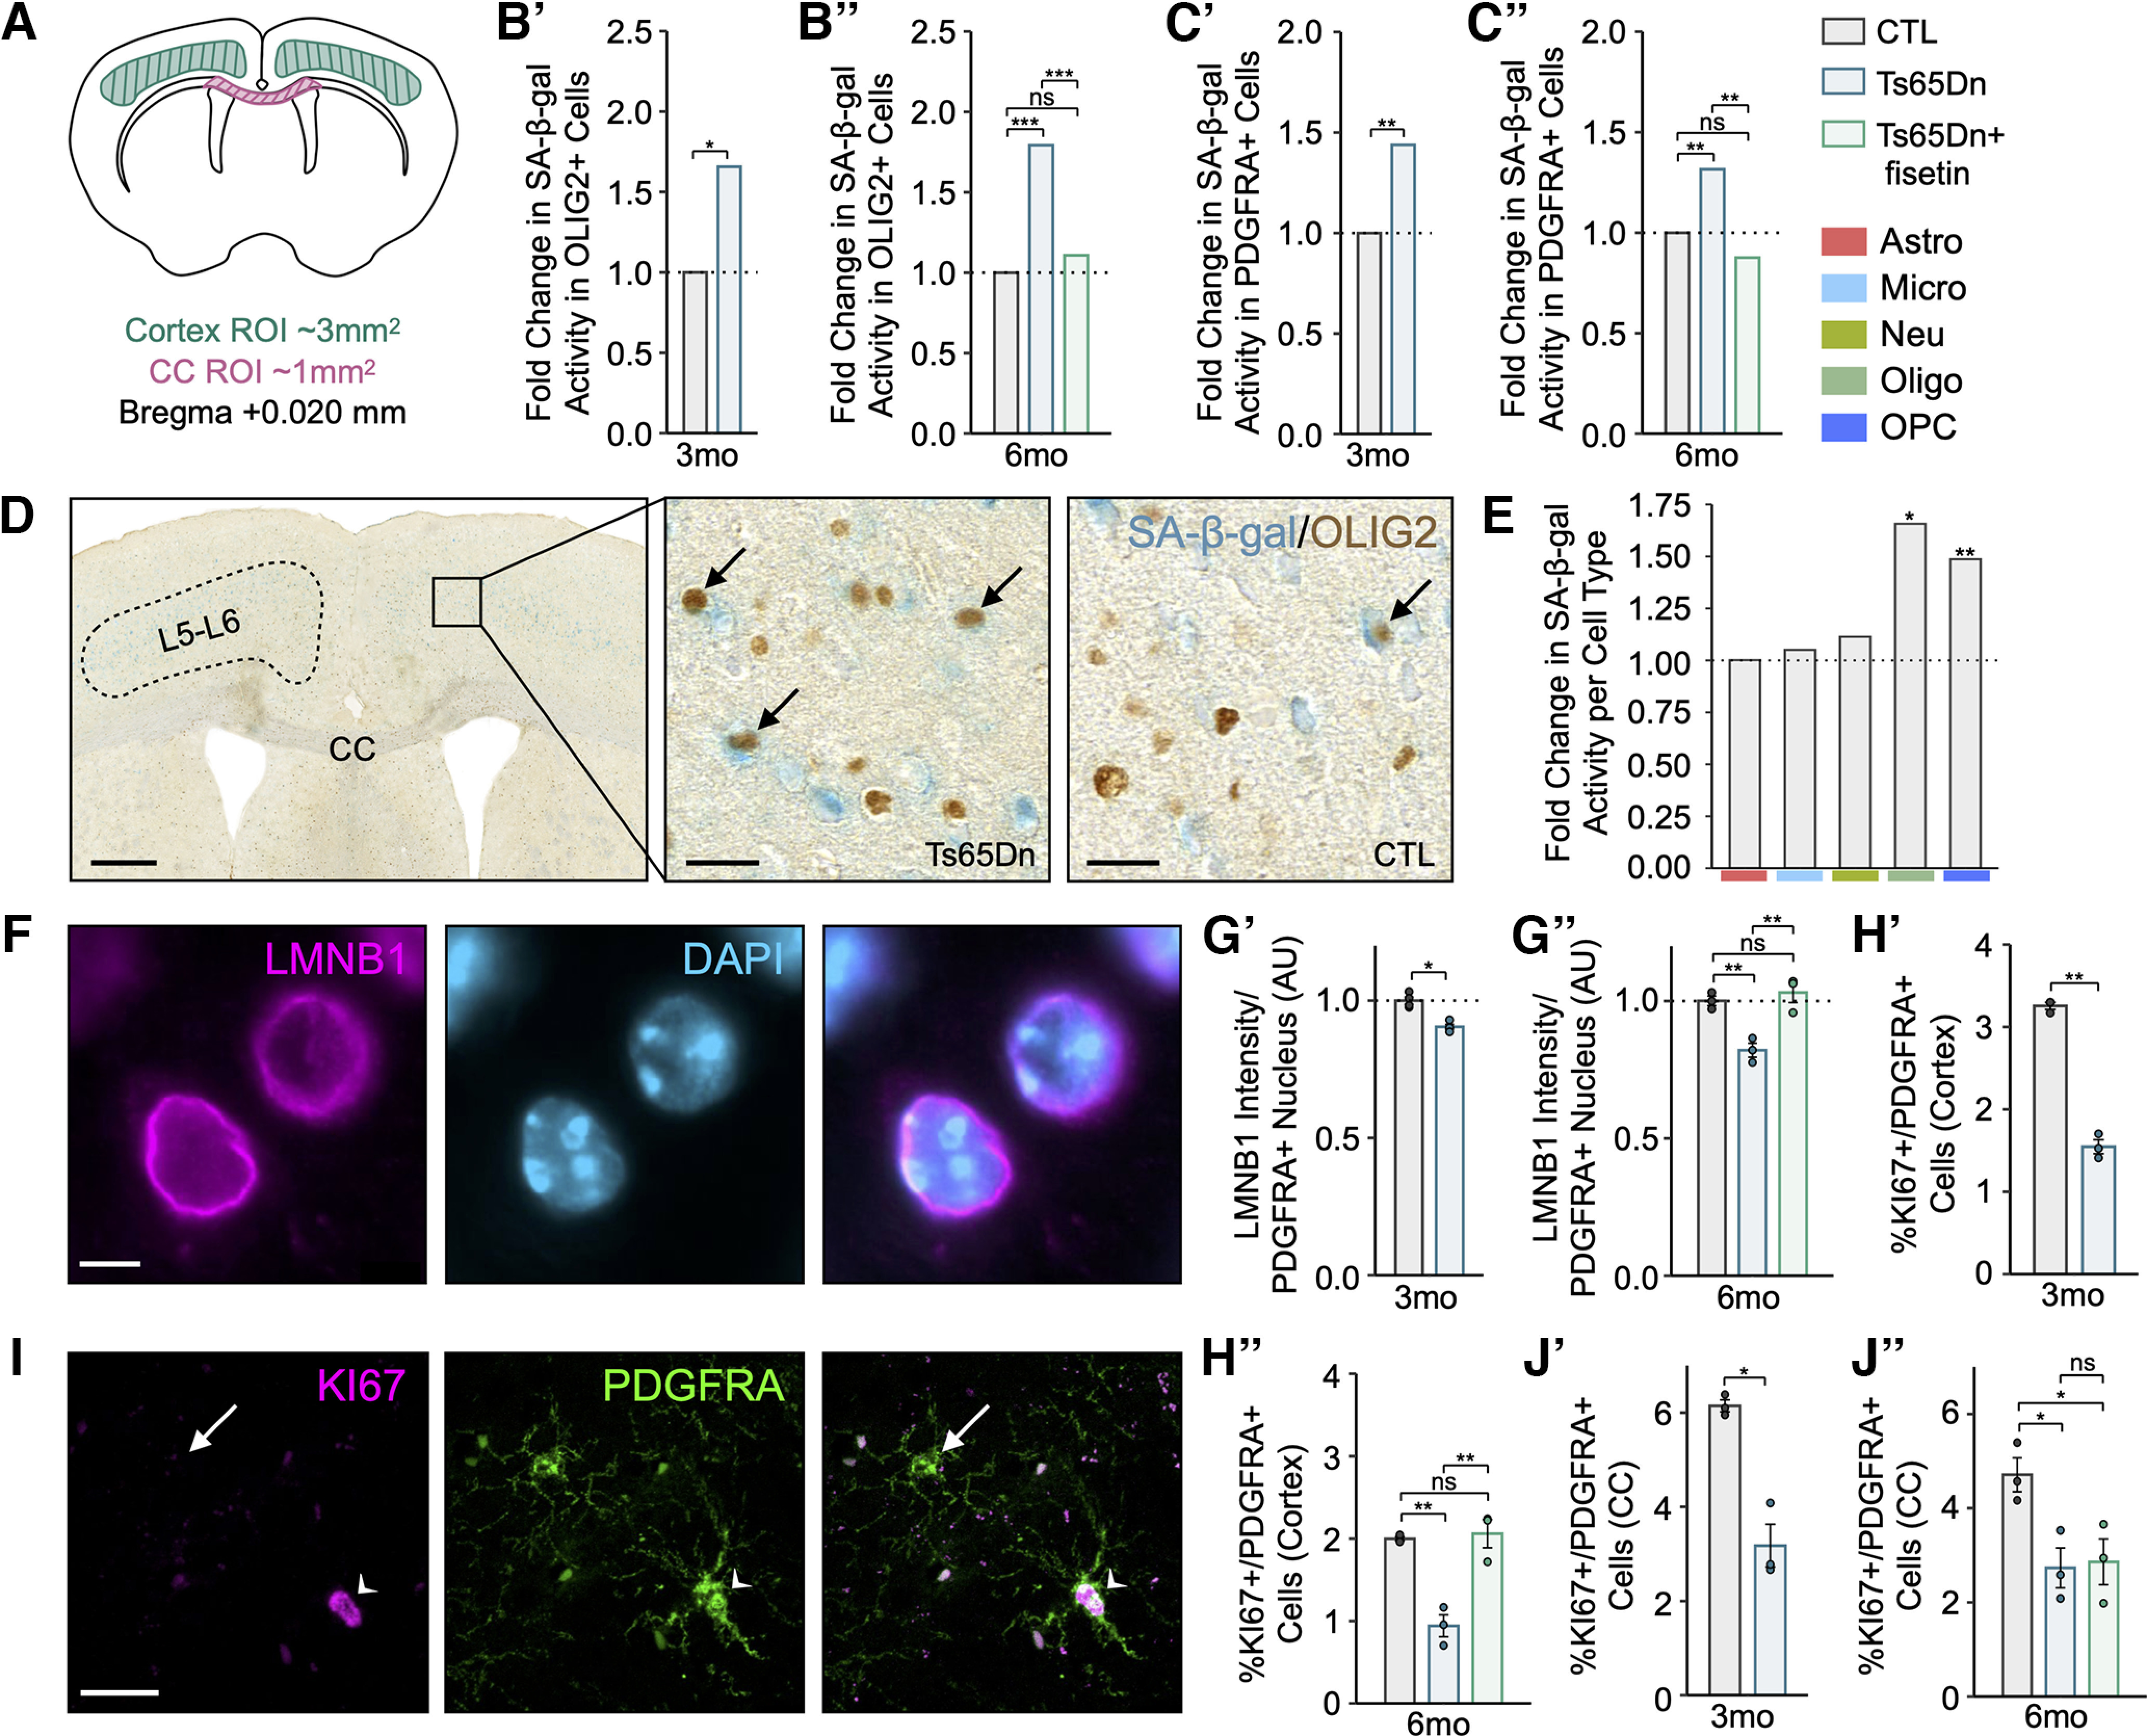
Deep cortical layer Ts65Dn OPCs exhibit several hallmarks of senescence that are rescued in mature adult mice treated with fisetin. A, Schematic of the region of interest (ROI) used for cell quantification across the cortex (∼3 mm2) and CC (∼1 mm2), demarcated with a green and magenta border, respectively. All tissue was sliced at bregma +0.020 mm. B’, B’’, Barplot of SA-β-gal activity in OLIG2+ cells (OL-lineage) in three- and six-month mice, showing a significant increase in SA-β-gal+/OLIG2+ cells in Ts65Dn at both time points, with a rescue in six-month Ts65Dn mice treated with fisetin. Bars represent the average values for each condition (n = 3 male mice per condition, n = 3 replicates per mouse), and dots represent the average values for each mouse per condition. C’, C’’, As in B but depicting SA-β-gal activity in PDGFRA+ cells (OPCs), showing a significant increase in SA-β-gal+/PDGFRA+ cells in Ts65Dn at both time points, with a rescue in six-month Ts65Dn mice treated with fisetin (n = 4 mice per condition, n = 3 replicates per mouse, n = 3 males, n = 1 female). D, SA-β-gal staining in coronal brain sections from a three-month Ts65Dn mouse; arrows point to OLIG2+ (brown) SA-β-gal+ (blue) cells throughout the cortex. Panel on the right shows a high magnification image of the area demarcated in the left panel. Images are representative of those observed in samples from Ts65Dn and CTL mice. Scale bars are shown in the bottom left corner of each panel: left panel, 500 μm; right/center panels, 50 μm. E, Barplot of the fold change in SA-β-gal activity across several major cortical cell types in three-month Ts65Dn versus CTL mice (n = 3 male mice per condition, n = 3 replicates per mouse). Astro, astrocytes; Micro, microglia; Neu, neurons; Oligo, oligodendrocytes; OPC, oligodendrocyte precursor cells. Only Oligos and OPCs exhibit statistically significant increases in SA-β-gal activity in Ts65Dn versus CTL. F, Immunostaining for LMNB1 (pink) and nuclear DAPI (blue) in a three-month Ts65Dn mouse. Images are representative of those observed in samples from Ts65Dn and CTL mice. Scale bar is shown in the bottom left corner of the panel: 5 μm. G’, G’’, Barplots of LaminB1 (LMNB1) intensity in arbitrary units (AU) per OPC (PDGFRA+) nucleus. Values have been normalized to the mean intensity found in CTL replicates. Bars represent the average values for each condition (at 3 months: n = 4 mice per condition, n = 3 replicates per mouse, n = 3 males and n = 1 female; at 6 months: n = 3 male mice per condition, n = 3 replicates per mouse), and dots represent the average values for mouse per condition. H’, H’’, Barplots of the percentage of KI67+/PDGFRA+ cells (proliferating OPCs), showing a significant increase in proliferating OPCs cells in Ts65Dn at both time points, with a rescue in six-month Ts65Dn mice treated with fisetin. Bars represent the average values for each condition (n = 3 male mice per condition, n = 3 replicates per mouse), and dots represent the average values for each mouse per condition. I, Immunostaining for KI67 (pink) and PDGFRA (green) in a three-month Ts65Dn mouse. Images are representative of those observed in samples from Ts65Dn and CTL mice (n = 3 male mice per condition, n = 3 replicates per mouse). The arrow points to a PDGFRA+ cell, and the arrowhead points to a KI67+/PDGFRA+ cell. Scale bar is shown in the bottom left corner of the panel: 20 μm. J’, J’’, Barplots of the percentage of KI67+/PDGFRA+ cells (proliferating OPCs), showing a significant increase in proliferating OPCs cells in Ts65Dn at both time points, with a rescue in six-month Ts65Dn mice treated with fisetin. Bars represent the average values for each condition (n = 3 male mice per condition, n = 3 replicates per mouse), and dots represent the average values for each mouse per condition. For all plots: significance is determined using the two-tailed Student’s t test at three months, or using the one-way ANOVA and post hoc Tukey’s test at six months. *p-value < 0.05, **p-value < 0.01, ***p-value < 0.001, ns: not significant; error bars represent the average ± 1 standard deviation (SD).
Table 7.
Statistical table
| Figure | Data structure | Type of test | Power | p-value | |
|---|---|---|---|---|---|
| 1 | 8B’ | Normal distribution | Two-tailed unpaired Student’s t test | 6.79 | p = 0.021 |
| 2 | 8B’’ | Normal distribution | One-way ANOVA with a post hoc Tukey | 305.25 | Ts65Dn vs CTL = 1.3 × 10⁻⁶ Ts65Dn+fisetin vs CTL = 0.054 Ts65Dn+fisetin vs Ts65Dn = 2.5 × 10⁻⁶ |
| 3 | 8C’ | Normal distribution | Two-tailed unpaired Student’s t test | 9.97 | p = 0.0021 |
| 4 | 8C’’ | Normal distribution | One-way ANOVA with a post hoc Tukey | 24.87 | Ts65Dn vs CTL = 0.0063 Ts65Dn+fisetin vs CTL = 0.215 Ts65Dn+fisetin vs Ts65Dn = 0.0011 |
| 5 | 8G’ | Normal distribution | Two-tailed unpaired Student’s t test | 5.05 | p = 0.014 |
| 6 | 8G’’ | Normal distribution | One-way ANOVA with a post hoc Tukey | 15.86 | Ts65Dn vs CTL = 0.0076 Ts65Dn+fisetin vs CTL = 0.963 Ts65Dn+fisetin vs Ts65Dn = 0.0059 |
| 7 | 8H’ | Normal distribution | Two-tailed unpaired Student’s t test | 14.13 | p = 0.0049 |
| 8 | 8H’’ | Normal distribution | One-way ANOVA with a post hoc Tukey | 24.84 | Ts65Dn vs CTL = 0.0013 Ts65Dn+fisetin vs CTL = 0.936 Ts65Dn+fisetin vs Ts65Dn = 0.0019 |
| 9 | 9B’’ | Normal distribution | One-way ANOVA with a post hoc Tukey | 11.63 | Ts65Dn vs CTL = 0.0032 Ts65Dn+fisetin vs CTL = 0.514 Ts65Dn+fisetin vs Ts65Dn = 0.017 |
| 10 | 8J’ | Normal distribution | Two-tailed unpaired Student’s t test | 8.68 | p = 0.013 |
| 11 | 8J’’ | Normal distribution | One-way ANOVA with a post hoc Tukey | 6.73 | Ts65Dn vs CTL = 0.039 Ts65Dn+fisetin vs CTL = 0.976 Ts65Dn+fisetin vs Ts65Dn = 0.050 |
| 12 | 10A’ | Normal distribution | Two-tailed unpaired Student’s t test | 4.43 | p = 0.047 |
| 13 | 10A’’ | Normal distribution | One-way ANOVA with a post hoc Tukey | 8.64 | Ts65Dn vs CTL = 0.018 Ts65Dn+fisetin vs CTL = 0.718 Ts65Dn+fisetin vs Ts65Dn = 0.046 |
| 14 | 10B’’ | Normal distribution | One-way ANOVA with a post hoc Tukey | 11.39 | Ts65Dn vs CTL = 0.0091 Ts65Dn+fisetin vs CTL = 0.506 Ts65Dn+fisetin vs Ts65Dn = 0.033 |
| 15 | 7E | Normal distribution | One-way ANOVA with a post hoc Tukey | 10.31 | Ts65Dn vs CTL = 0.0016 Ts65Dn+fisetin vs CTL = 0.973 Ts65Dn+fisetin vs Ts65Dn = 0.0011 |
| 16 | 7E | Normal distribution | One-way ANOVA with a post hoc Tukey | 11.68 | Ts65Dn vs CTL = 0.00013 Ts65Dn+fisetin vs CTL = 0.0044 Ts65Dn+fisetin vs Ts65Dn = 0.294 |
To confirm these findings, we analyzed three- and six-month coronal sections for additional hallmarks of senescent cells: reduction of nuclear envelope protein LaminB1 (LMNB1) and reduction of proliferation (Freund et al., 2012; Kumari and Jat, 2021). LMNB1 decline associated with senescence can be detected at the protein-level through immunofluorescence (IF) staining and subsequent measurement of fluorescence intensity. We thus stained for LMNB1 in Ts65Dn and euploid CTL tissues in a cell type-specific manner (using PDGFRA to stain for OPCs) and compared LMNB1 fluorescence intensity between conditions (Materials and Methods). As expected, we observed a decline in cortical OPC (PDGFRA+) LMNB1 intensity by 10.4% at three months (t(5) = 5.05, p = 0.014) and 14.4% at six months (Genotype effect, F(6) = 15.86, p = 0.0076; Fig. 8F–H). Senescent cells are also typified by an irreversible cell cycle and proliferation arrest (Kumari and Jat, 2021). KI67 is only detected in actively dividing and not quiescent or senescent cells. Proliferating cell populations can thus be identified by quantifying nuclear KI67 positivity. We observed a 51.7% and 58.0% reduction in proliferating KI67+ OPCs in the Ts65Dn cortex at three months (t(7) = 14.13, p = 0.049) and six months (Genotype effect, F(8) = 24.84, p = 0.0013), respectively (Fig. 8I,J), suggestive of a growth arrest typical of senescence in trisomic OPCs.
OPC senescence alters progenitor abundance but not oligodendrocyte maturation or myelination in the Ts65Dn cortex
To determine how OPC senescence affects cortical populations of OL-lineage cells, we quantified changes in OPC and mOL cell counts in coronal brain sections from Ts65Dn and euploid CTL mice. Prior studies have shown that trisomy-associated triplication of OLIG2 results in a transient early-life increase in OPCs, followed by a progressive decline in the progenitor pool with a resulting deficit in myelination that persists into adulthood (Lu et al., 2012; Jose Luis Olmos-Serrano et al., 2016). We stained for OLIG2 to mark the OL-lineage, and PDGFRA or CC1 to identify OPCs or mOLs, respectively. At both the three- and six-month time points, we discovered a decline in the percentage of PDGFRA+/OLIG2+ cells in the cortex, but only that at the six-month time point reached statistical significance (Genotype effect, F(9) = 11.63, p = 0.0032; Fig. 9A,B). Despite changes in OPC proliferation and abundance in the trisomic cortex, the percentage of CC1+/OLIG2+ mOLs was not significantly changed in the cortex of Ts65Dn mice (Fig. 9C). Likewise, we found no change in cortical Mbp mRNA levels through quantitative PCR (qPCR; Fig. 9D), or in MBP fluorescence intensity measured through immunostaining (Fig. 9E). Overall, this analysis suggests that OPC senescence alters progenitor abundance, but not OL maturation or myelination in the adult Ts65Dn cortex.
Figure 9.
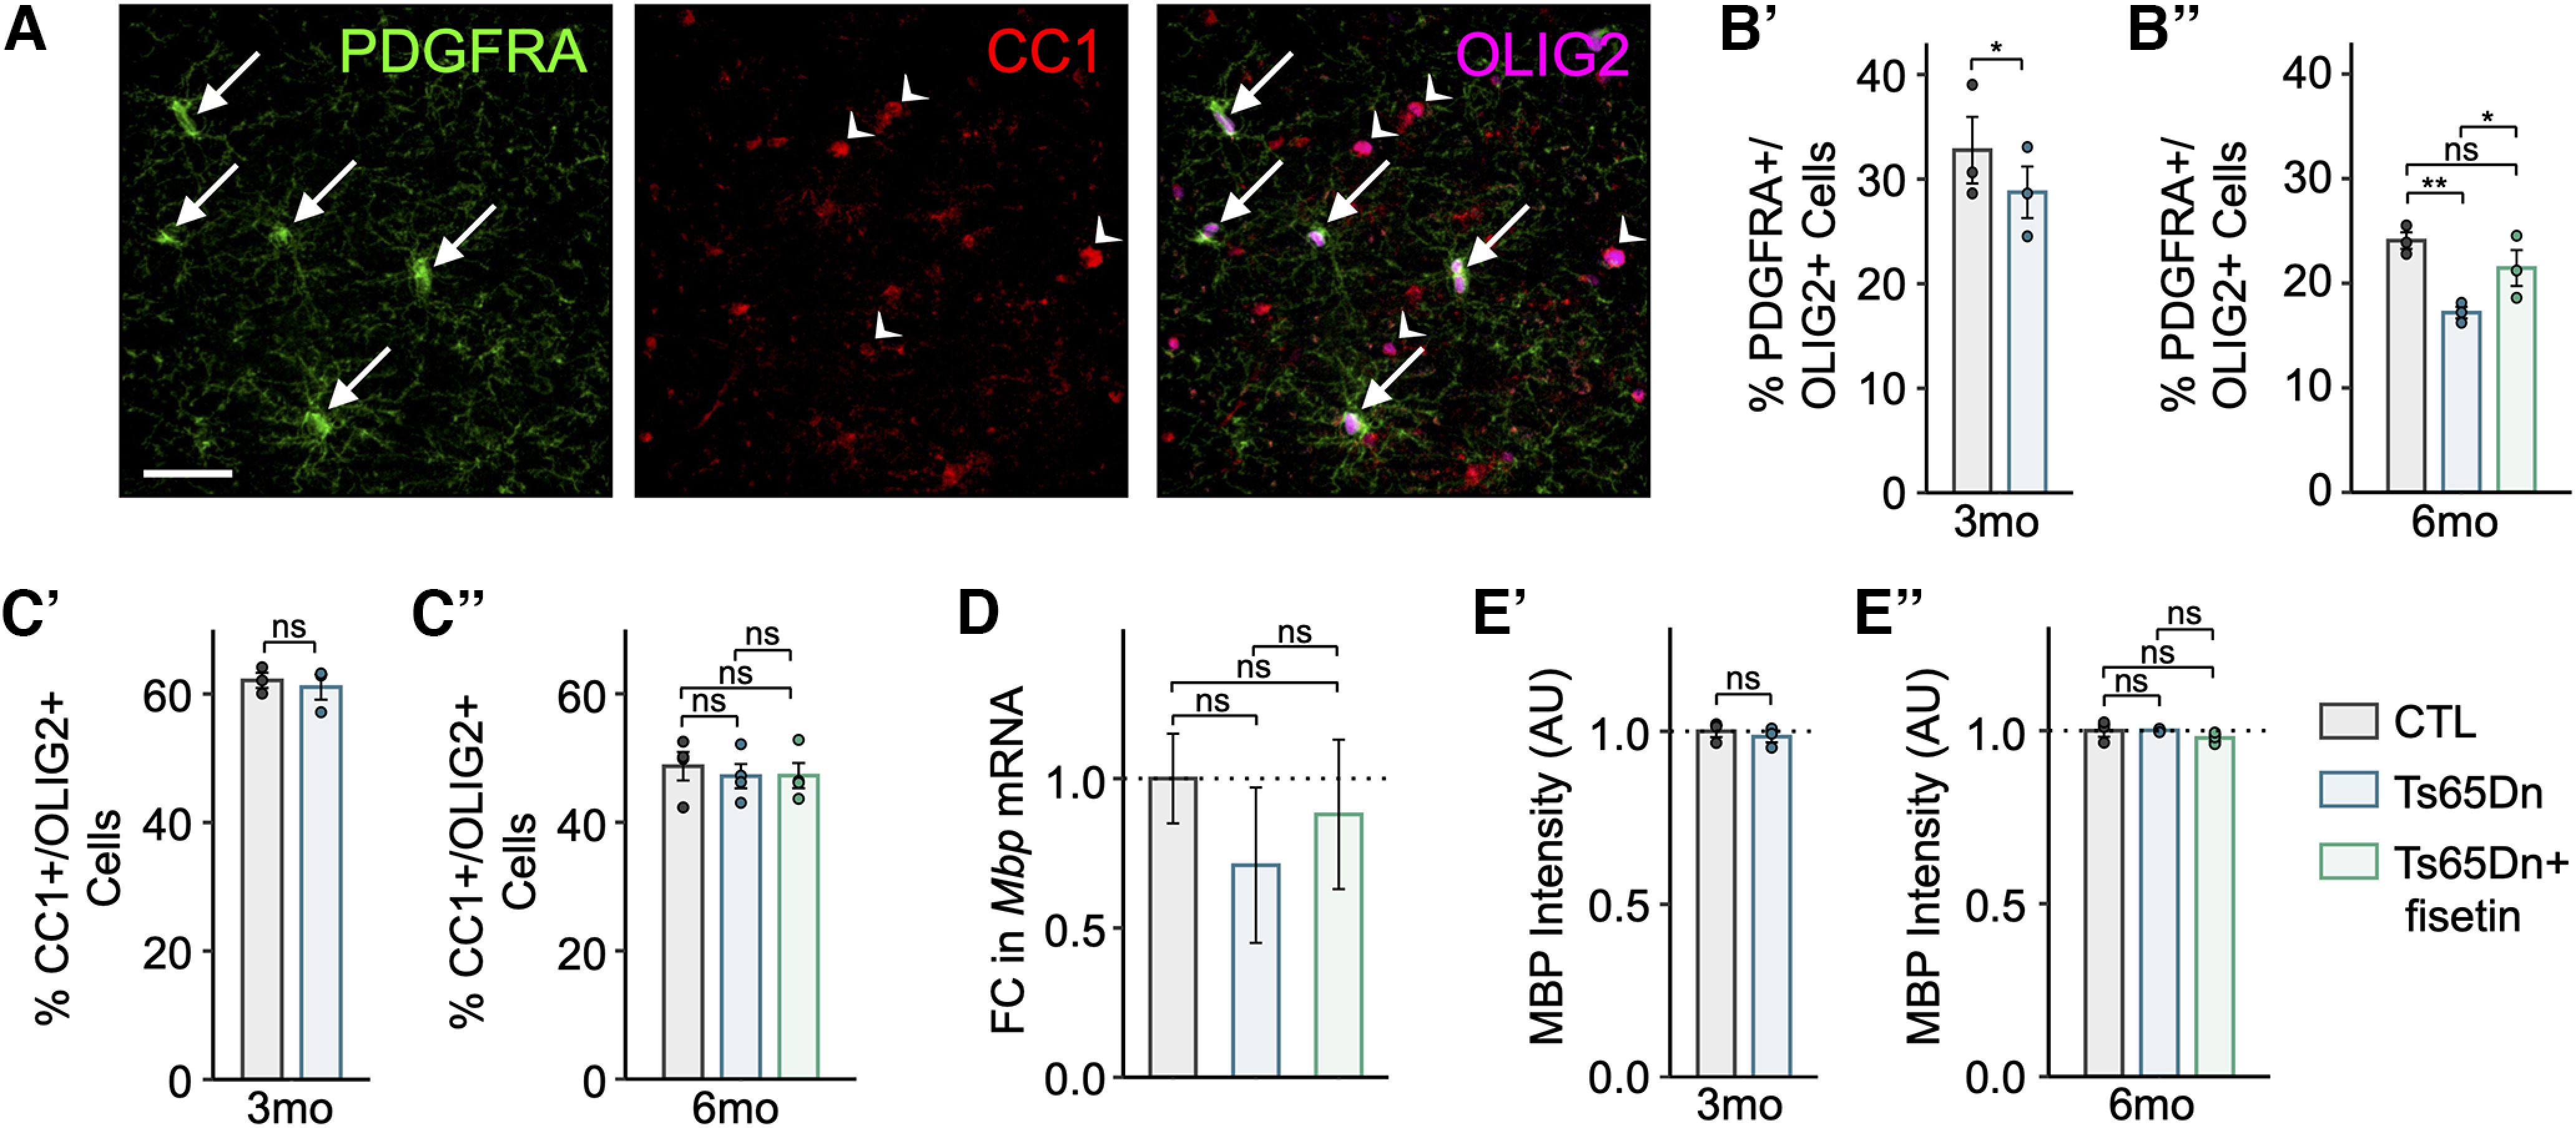
OPC senescence alters the number of progenitors but not the number of mature OLs. A, Immunostaining for PDGFRA (green), CC1 (red), and OLIG2 (pink) in a three-month Ts65Dn mouse. Images are representative of those observed in samples from Ts65Dn and CTL mice. Arrows point to PDGFRA+/OLIG2+ cells, and arrowheads point to CC1+/OLIG2+ cells. Scale bar is shown in the bottom left corner of the panel: 20 μm. B’, B’’, Barplots of the percentage of PDGFRA+/OLIG2+ cells (OPCs), showing a significant decrease in the number of OPCs at six months, with a rescue in six-month Ts65Dn mice treated with fisetin. Bars represent the average values for each condition (at 3 months: n = 3 male mice per condition, n = 3 replicates per mouse; at 6 months: n = 3 male mice per condition, n = 3 replicates per mouse), and dots represent the average values for each mouse per condition. C’, C’’, As in B but depicting the percentage of CC1+/OLIG2+ cells (mOLs), showing no significant change in the number of cells in Ts65Dn at either time point, and no rescue in six-month Ts65Dn mice treated with fisetin (at 3 months: n = 3 male mice per condition, n = 3 replicates per mouse; at 6 months: n = 4 mice per condition, n = 3 replicates per mouse, n = 3 males and n = 1 female). D, Barplot of the fold change (FC) in Mbp mRNA as measured through quantitative PCR (qPCR). Values were first normalized to Gapdh, and then normalized to the mean expression found in CTL replicates. Bars represent the average values for each condition (n = 3 mice per condition, n = 4 replicates per mouse, n = 3 males). E’, E’’, As in B, but depicting MBP intensity in arbitrary units (AU). Values have been normalized to the mean intensity found in CTL replicates (n = 3 male mice per condition, n = 3 replicates per mouse). For all plots: significance is determined using the two-tailed Student’s t test at three months, or using the one-way ANOVA and post hoc Tukey’s test at six months. *p-value < 0.05, **p-value < 0.01, ***p-value < 0.001, ns: not significant; error bars represent the average ± 1 standard deviation (SD).
Treatment with the senescence-reducing flavonoid fisetin rescues cellular and behavioral deficits in Ts65Dn mice
Senescent cell anti-apoptotic pathways (SCAPs) are a key feature of senescent cells, allowing them to evade apoptotic cell death (Kumari and Jat, 2021). SCAPs can be targeted by small molecule senolytic compounds to selectively clear senescent cells from pathologic tissues (Y. Zhu et al., 2015). Fisetin, a natural flavonoid, has senolytic properties and can be added to the diet as a supplement with minimal adverse effects (Elsallabi et al., 2022). We fed Ts65Dn mice a diet supplemented with 500-ppm fisetin, as previously described (Camell et al., 2021; Materials and Methods).
To begin investigating the cellular effects of fisetin treatment, we stained coronal brain sections from six-month mice for SA-β-gal activity under the same parameters as previously described. We observed a significant reduction in SA-β-gal positivity in both OLIG2+ (Genotype effect, F(2) = 305.25, p = 2.5 × 10⁻⁶) and PDGFRA+ (Genotype effect, F(4) = 24.87, p = 0.0011) cells in the cortex of six-month trisomic mice given fisetin (Fig. 8B,C). Fisetin supplementation also restored LMNB1 protein levels in Ts65Dn OPCs to CTL levels (Genotype effect, F(6) = 15.86, p = 0.0059; Fig. 8G), increased the proportion of KI67+/PDGFRA+ cells in the Ts65Dn cortex (Genotype effect, F(8) = 24.84, p = 0.0019; Fig. 8H), and restored the abundance of cortical OPCs (Genotype effect, F(9) = 11.63, p = 0.017; Fig. 9B). While the number of OPCs was observed to significantly decrease in the three-month Ts65Dn CC, there was no significant difference in the number of OPCs in the CC at six months, and no effect of fisetin treatment on CC OPC cell counts. Likewise, there was a significant decrease in the number of KI67+/PDGFRA+ at both three months (t(10) = 8.68, p = 0.013) and six months (Genotype effect, F(11) = 6.73, p = 0.039), but no rescue of this reduction in proliferation activity through fisetin treatment at six months in the CC (Fig. 8J), consistent with a region-specific effect of senescent OPCs in the Ts65Dn cortex.
DS mouse models demonstrate increased microglial and astrocyte reactivity, as well as increased inflammatory cytokine levels and interferon signaling (Jørgensen et al., 1990; Wilcock, 2012; C. Chen et al., 2014; Sullivan et al., 2016; Flores-Aguilar et al., 2020; Kong et al., 2020; Pinto et al., 2020; Ponroy Bally and Murai, 2021). Given that senescent cells modify the local inflammatory microenvironment through the SASP (Coppé et al., 2010), we hypothesized that fisetin administration and resulting reduction of senescent OPCs would alter local microglial phenotype. To begin, we counted the number of IBA1+ microglia in the cortex of three- and six-month Ts65Dn and CTL mice. We observed a significant increase in the number of microglia at three months and a decrease at the six-month time point (t(12) = 4.43, p = 0.047; Genotype effect, F(13) = 8.64, p = 0.018) in Ts65Dn mice relative to CTL. Fisetin administration was associated with a restoration of IBA1+ microglia in six-month trisomic mice (Genotype effect, F(13) = 8.64, p = 0.046; Fig. 10A). Next, we tested whether the activation state of microglia was altered in Ts65Dn mice by quantifying the abundance of the phagocytic marker CD68 in IBA1+ cells. Interestingly, we observed a decrease in the proportion of CD68+/IBA1+ cells in Ts65Dn at six months (Genotype effect, F(14) = 11.39, p = 0.0091; Fig. 10B,C), suggestive of a reduction in phagocytic microglial activity. This decline in microglial phagocytic capacity is consistent with prior reports demonstrating that aged microglia display a reduction or dysfunction in phagocytosis (Safaiyan et al., 2016; Marques et al., 2020; Thomas et al., 2022), thus suggesting that the Ts65Dn cortex and its associated senescent microenvironment may contribute to an impairment in microglia phagocytic activity, rescuable by fisetin treatment.
Figure 10.
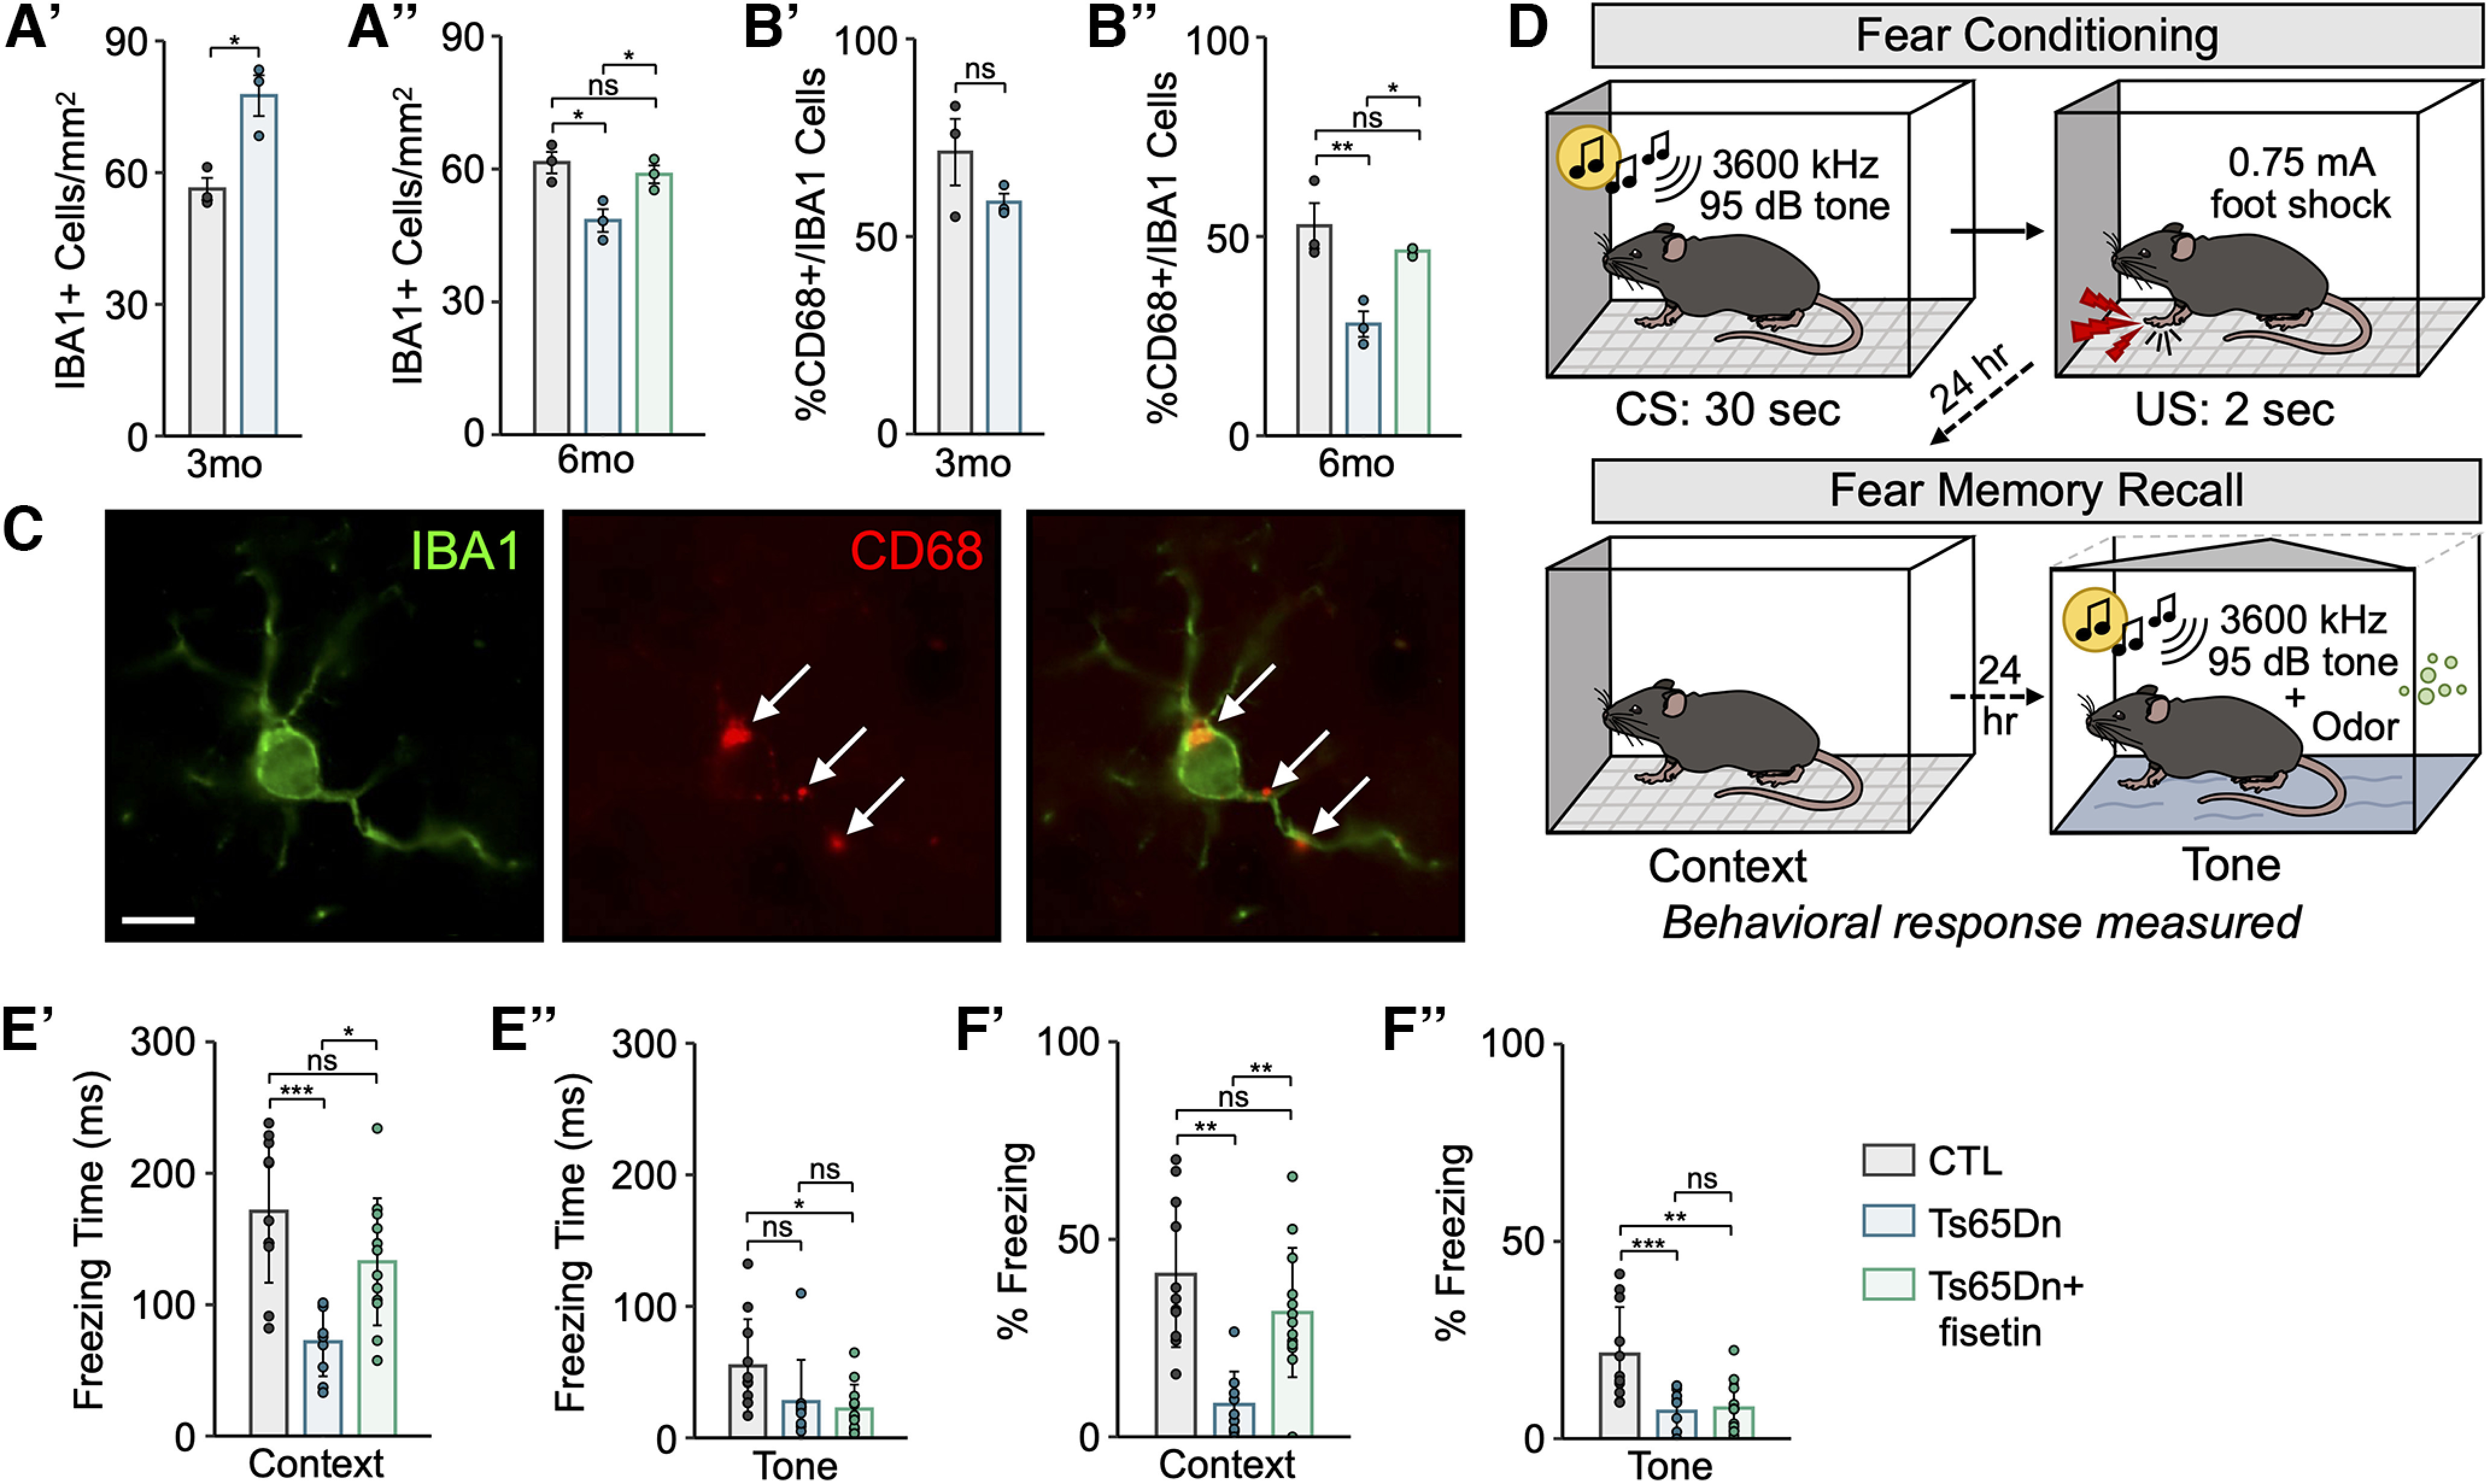
Fisetin rescues microglia phenotype and fear memory behavior in Ts65Dn mice. A’, A’’, Barplots of the number of IBA1+ (microglia) cells per mm2 in the cortex in three- and six-month mice, showing a significant increase in microglia in Ts65Dn at three months and a decrease at six months, with a rescue in six-month Ts65Dn mice treated with fisetin. Bars represent the average values for each condition (n = 3 male mice per condition, n = 3 replicates per mouse), and dots represent the average values for each mouse per condition. B’, B’’, as in A, but depicting the percentage of CD68+/IBA1+ (activated microglia) in the cortex, showing a significant decrease in activated microglia at six months, with a rescue in six-month Ts65Dn mice treated with fisetin (n = 3 male mice per condition, n = 3 replicates per mouse). C, Immunostaining for IBA1 (green) and CD68 (red) in a three-month Ts65Dn mouse. Images are representative of those observed in samples from Ts65Dn and CTL mice. Arrows point to CD68+ puncta in IBA1+ microglia. Scale bar is shown in the bottom left corner of the panel: 15 μm. D, Schematic representation of fear conditioning and memory recall behavioral battery. E’, E’’, Barplots of the time to freezing behavior depending on context and tone, showing a significant decrease in context-based but not tone-based freezing in Ts65Dn mice, with a rescue in the context-based behavior in six-month Ts65Dn mice treated with fisetin. Bars represent the average values for each condition (n = 9 male mice per condition), and dots represent the data collected for each mouse per condition. F’, F’’, As in E, but depicting the percentage of freezing behavior, showing a significant decrease in context-based and tone-based freezing in Ts65Dn mice, with a rescue in the context-based, but not tone-based behavior in six-month Ts65Dn mice treated with fisetin (n = 9 male mice per condition). For all plots: significance is determined using the two-tailed Student’s t test at three months, or using the one-way ANOVA and post hoc Tukey’s test at six months. *p-value < 0.05, **p-value < 0.01, ***p-value < 0.001, ns: not significant; error bars represent the average ± 1 standard deviation (SD).
Individuals with DS, as well as mouse models of DS, exhibit pronounced learning and memory deficits that worsen with age. We thus wanted to determine whether senescence-reducing fisetin supplementation treatment could rescue learning-associated behavioral deficits in six-month trisomic mice. To do so, we employed a contextual fear conditioning paradigm, as previously done for Ts65Dn mice (P.J. Zhu et al., 2019), which pairs a foot shock (unconditioned stimulus, US) with a context (conditioned stimulus, CS), and subsequently tests memory strength by measuring fear-associated freezing behavior in mice exposed to the CS (Fig. 10D Materials and Methods). We found, as expected, that trisomic mice exhibited significantly lower freezing behavior compared with CTL littermates in both contextual and tone-associated freezing behavior (Genotype effect, F(15) = 10.31, p = 0.0016; Genotype effect, F(16) = 11.68, p = 0.00013; Fig. 10E,F). Contextual, but not tone-associated freezing behavior, was rescued in six-month trisomic mice treated with fisetin (Genotype effect, F(15) = 10.31, p = 0.0011), indicating improved associative learning (Fig. 10E,F). Overall, the behavioral data appears to suggest that, in Ts65Dn mice, cognitive impairment may be caused, at least in part, by cortical OPC senescence and that this behavioral impairment is rescuable by fisetin treatment.
Discussion
The present study leverages an integrated transcriptome and chromatin accessibility landscape of the mature Ts65Dn mouse cortex to identify trisomic OPCs that undergo accelerated senescence. The study characterizes cell type-specific effects of trisomy and dosage compensation, identifying putative mechanisms of cell-cell signaling dysfunction in the mature brain. Importantly, we assemble multiple lines of evidence supporting OPC senescence in Ts65Dn mice, and we find that OPC senescence is spatially concentrated in deep cortical layers. This suggests a unique phenotype for cortical gray matter OPCs and a role for the cortical niche in programming OPC state, similar to what has been recently reported for other non-neuronal cells (Stogsdill et al., 2022).
Our work builds on previous data suggesting cell-autonomous defects in OL maturation in mouse models of DS, as our data confirms a reduction in OPC proliferation and fewer mOLs in the CC of Ts65Dn mice. In the developing DS brain, there is a cell fate shift from neurogenesis to gliogenesis, resulting in a transient increase in OLIG2+ cells, followed by a decrease in mOLs and an increase in astrocytes with age, which is thought, in part, to be driven by triplication of the OLIG1/2 TFs (Reiche et al., 2019). This supports a model of defective OL-lineage differentiation capacity and a shift in glial cell commitment. Importantly, our data show that at six months, Ts65Dn mice show a reduction in cortical gray matter OPCs, but not CC OPCs, suggesting an age-restricted cortical gray matter phenotype. Therefore, trisomic OPCs are uniquely vulnerable to impaired maturation, but the local cortical microenvironment may be important as a second hit to promote accelerated senescence.
There is growing recognition that OPCs are an important mediator of neuroinflammation and aging phenotypes in the brain. OPCs exhibit regional, transcriptional, and functional heterogeneity, including differences in calcium signaling and electrical activity (Falcão et al., 2018; Marisca et al., 2020). OPCs become more regionally diverse, acquire ion channels, and undergo an inflammatory transformation with age (Neumann et al., 2021). OPCs harbor a highly dynamic cytokine receptor-mediated surveillance mechanism that responds to cues of injury and inflammation (Kirby et al., 2019), and these receptors promote neuroinflammatory responses on IFN signaling. OPC signaling to the microenvironment is bidirectional: local inflammation influences OPC ability to proliferate and differentiate, while OPCs also exert an immunomodulatory function on neighboring cells. Therefore, our study adds to this existing literature to suggest a region-specific disruption in OPC function with aging in DS.
The DS brain exhibits several pathologic changes, including DNA damage, chromatin instability, oxidative stress, mitochondrial dysfunction, and immune activation, that may predispose to cellular senescence. In particular, there is a chronic hyper-interferon state in the DS brain because of the increased gene dosage of IFNARs (Sullivan et al., 2016; Araya et al., 2019; Waugh et al., 2019; M. Jin et al., 2022). IFNAR inhibition reverses senescent microglia phenotype in human DS cells, and chronic interferon-opathy may contribute to accelerated aging and neurodegeneration in DS (M. Jin et al., 2022). Nevertheless, the precise gene-environment mechanisms that regulate region-specific OPC senescence, at least in Ts65Dn mice, are unclear. Interestingly, our results are consistent with previous studies of the aged AD-affected brain, in which inflammatory Aβ plaque-associated OPCs were found to exhibit increased senescence (P. Zhang et al., 2019). This suggests a link between OPC senescence and a neuroinflammatory microenvironment in aging. Other investigators have reported senescence in human DS neural progenitor cells (NPCs) and microglia, but these studies were done in human cell culture models (Meharena et al., 2022). Our findings are exclusively derived from the Ts65Dn mouse model, and this does not exclude neural progenitor or microglia senescence at other developmental or stimulus-dependent contexts. Further validation of these findings in human tissue across the lifespan will be critical to understanding the role of senescence in individuals with DS.
There are several limitations to the present study. Droplet-based single-cell genomics is limited by gene and chromatin fragment “drop-out” and is sparser than bulk approaches. snRNA-seq is biased against lowly expressed genes, which includes many immune molecules and senescence-associated transcripts in the brain. Chromatin accessibility may be a coarse indicator of senescence-associated epigenetic changes in OPCs, and a detailed analysis of the histone landscape and 3D genome architecture of trisomic OPCs is warranted. Furthermore, gene expression levels may not correlate with protein levels, particularly with aging, and our data do not reflect possible post-transcriptional regulatory mechanisms in translational control. The use of the Ts65Dn mouse model also harbors inherent limitations, namely the inclusion of only ∼55% of Hsa21 protein-coding orthologs (Escorihuela et al., 1995). Indeed, Ts65Dn mice do not triplicate many of the trisomic human loci, do not exhibit β-amyloid plaques consistent with human AD (Choi et al., 2009), and create trisomic imbalance for several Mmu17 genes unrelated to Hsa21. A recent study conducted on a newly-developed DS model, Ts66Yah, demonstrates that several genes located on Mmu17 that are triplicated in Ts65Dn mice may play a role in DS-associated neuropathology and behavior (Duchon et al., 2022). Conclusions drawn from use of the Ts65Dn mouse must therefore be interpreted and understood in the context of existing limitations of the model, and warrant supplementation in other murine contexts or in human DS tissue for increased validity and translatability. Further, senescence-reducing therapy with fisetin is not specifically targeted to OPCs, and the effects of fisetin may be related to noncell-autonomous mechanisms. This does not exclude the possibility of direct effect of fisetin on other cell types. Fisetin also exhibits anti-inflammatory, neuroprotective, and antioxidant activity (L.T. Zheng et al., 2008; Khan et al., 2013; Huang et al., 2018; Molagoda et al., 2021), and has recently been shown to reduce mortality in aged virally-infected mice (Camell et al., 2021). It is therefore possible that fisetin administration could exert a beneficial impact on disease pathogenesis, gliosis, and cognitive function via mechanisms that do not directly involve senescence reduction. Future work using transgenic models to selectively deplete senescent OPCs will be important to demonstrate the importance of this phenomenon to DS-associated cognitive decline and neurodegeneration.
Despite these limitations, our study identifies a cell type-specific senescence phenotype in Ts65Dn OPCs that is targetable with senescence-reducing therapies. These findings shed light on potential drivers of chronic inflammation and cognitive decline in the DS brain. Furthermore, the integrated single-nucleus transcriptomic and chromatin landscape in the Ts65Dn brain is an important resource for discovery in DS neurobiology.
Synthesis
Reviewing Editor: Benjamin Deneen, Baylor College of Medicine
Decisions are customarily a result of the Reviewing Editor and the peer reviewers coming together and discussing their recommendations until a consensus is reached. When revisions are invited, a fact-based synthesis statement explaining their decision and outlining what is needed to prepare a revision will be listed below. The following reviewer(s) agreed to reveal their identity: John Lukens, Yungki Park.
The reviewers found this paper to be of interest as a multiomics analysis of mouse models of Down’s could be a useful resource in the field. Despite these strengths Reviewer 2 found some shortcomings with the bioinformatics analysis and some of the statistical approaches that were employed. We feel strongly that these issues need to be resolved before this paper can be published. Also, reviewer 1 suggested highlighting some of the limitations of the study, which we also agree with. Please proceed with an appropriate revision, incorporating these comments.
References
- Ábrahám H, Vincze A, Veszprémi B, Kravják A, Gömöri É, Kovács GG, Seress L (2012) Impaired myelination of the human hippocampal formation in Down syndrome. Int J Dev Neurosci 30:147–158. 10.1016/j.ijdevneu.2011.11.005 [DOI] [PubMed] [Google Scholar]
- Ahmed MM, Johnson NR, Boyd TD, Coughlan C, Chial HJ, Potter H (2021) Innate immune system activation and neuroinflammation in Down syndrome and neurodegeneration: therapeutic targets or partners? Front Aging Neurosci 13:718426. 10.3389/fnagi.2021.718426 [DOI] [PMC free article] [PubMed] [Google Scholar]
- Aitken CE, Beznosková P, Vlčkova V, Chiu W-L, Zhou F, Valášek LS, Hinnebusch AG, Lorsch JR (2016) Eukaryotic translation initiation factor 3 plays distinct roles at the mRNA entry and exit channels of the ribosomal preinitiation complex. Elife 5:e20934. 10.7554/eLife.20934 [DOI] [PMC free article] [PubMed] [Google Scholar]
- Aivazidis S, Coughlan CM, Rauniyar AK, Jiang H, Liggett LA, Maclean KN, Roede JR (2017) The burden of trisomy 21 disrupts the proteostasis network in Down syndrome. PLoS One 12:e0176307. 10.1371/journal.pone.0176307 [DOI] [PMC free article] [PubMed] [Google Scholar]
- Alexander M, Petri H, Ding Y, Wandel C, Khwaja O, Foskett N (2016) Morbidity and medication in a large population of individuals with Down syndrome compared to the general population. Dev Med Child Neurol 58:246–254. 10.1111/dmcn.12868 [DOI] [PubMed] [Google Scholar]
- Alquicira-Hernandez J, Sathe A, Ji HP, Nguyen Q, Powell JE (2019) scPred: accurate supervised method for cell-type classification from single-cell RNA-seq data. Genome Biol 20:264. 10.1186/s13059-019-1862-5 [DOI] [PMC free article] [PubMed] [Google Scholar]
- Antonarakis SE, Skotko BG, Rafii MS, Strydom A, Pape SE, Bianchi DW, Sherman SL, Reeves RH (2020) Down syndrome. Nat Rev Dis Primer 6:9. [DOI] [PMC free article] [PubMed] [Google Scholar]
- Araya P, Waugh KA, Sullivan KD, Núñez NG, Roselli E, Smith KP, Granrath RE, Rachubinski AL, Enriquez Estrada B, Butcher ET, Minter R, Tuttle KD, Bruno TC, Maccioni M, Espinosa JM (2019) Trisomy 21 dysregulates T cell lineages toward an autoimmunity-prone state associated with interferon hyperactivity. Proc Natl Acad Sci U S A 116:24231–24241. 10.1073/pnas.1908129116 [DOI] [PMC free article] [PubMed] [Google Scholar]
- Avramopoulos D (2018) Neuregulin 3 and its roles in schizophrenia risk and presentation. Am J Med Genet B Neuropsychiatr Genet 177:257–266. 10.1002/ajmg.b.32552 [DOI] [PMC free article] [PubMed] [Google Scholar]
- Barlow GM, Lyons GE, Richardson JA, Sarnat HB, Korenberg JR (2002) DSCAM: an endogenous promoter drives expression in the developing CNS and neural crest. Biochem Biophys Res Commun 299:1–6. 10.1016/s0006-291x(02)02548-2 [DOI] [PubMed] [Google Scholar]
- Bayona-Bafaluy MP, Garrido-Pérez N, Meade P, Iglesias E, Jiménez-Salvador I, Montoya J, Martínez-Cué C, Ruiz-Pesini E (2021) Down syndrome is an oxidative phosphorylation disorder. Redox Biol 41:101871. 10.1016/j.redox.2021.101871 [DOI] [PMC free article] [PubMed] [Google Scholar]
- Becker L, Mito T, Takashima S, Onodera K (1991) Growth and development of the brain in Down syndrome. Prog Clin Biol Res 373:133–152. [PubMed] [Google Scholar]
- Bernhardt C, Sock E, Fröb F, Hillgärtner S, Nemer M, Wegner M (2022) KLF9 and KLF13 transcription factors boost myelin gene expression in oligodendrocytes as partners of SOX10 and MYRF. Nucleic Acids Res 50:11509–11528. 10.1093/nar/gkac953 [DOI] [PMC free article] [PubMed] [Google Scholar]
- Berto G, Camera P, Fusco C, Imarisio S, Ambrogio C, Chiarle R, Silengo L, Di Cunto F (2007) The Down syndrome critical region protein TTC3 inhibits neuronal differentiation via RhoA and citron kinase. J Cell Sci 120:1859–1867. 10.1242/jcs.000703 [DOI] [PubMed] [Google Scholar]
- Bowden ET, Stoica GE, Wellstein A (2002) Anti-apoptotic signaling of pleiotrophin through its receptor, anaplastic lymphoma kinase. J Biol Chem 277:35862–35868. 10.1074/jbc.M203963200 [DOI] [PubMed] [Google Scholar]
- Brinkmann BG, Agarwal A, Sereda MW, Garratt AN, Müller T, Wende H, Stassart RM, Nawaz S, Humml C, Velanac V, Radyushkin K, Goebbels S, Fischer TM, Franklin RJ, Lai C, Ehrenreich H, Birchmeier C, Schwab MH, Nave KA (2008) Neuregulin-1/ErbB signaling serves distinct functions in myelination of the peripheral and central nervous system. Neuron 59:581–595. 10.1016/j.neuron.2008.06.028 [DOI] [PMC free article] [PubMed] [Google Scholar]
- Buchwalter A, Hetzer MW (2017) Nucleolar expansion and elevated protein translation in premature aging. Nat Commun 8:328. 10.1038/s41467-017-00322-z [DOI] [PMC free article] [PubMed] [Google Scholar]
- Cabral-Pacheco GA, Garza-Veloz I, Castruita-De la Rosa C, Ramirez-Acuña JM, Perez-Romero BA, Guerrero-Rodriguez JF, Martinez-Avila N, Martinez-Fierro ML (2020) The roles of matrix metalloproteinases and their inhibitors in human diseases. Int J Mol Sci 21:9739. 10.3390/ijms21249739 [DOI] [PMC free article] [PubMed] [Google Scholar]
- Cahill ME, Jones KA, Rafalovich I, Xie Z, Barros CS, Müller U, Penzes P (2012) Control of interneuron dendritic growth through NRG1/Erbb4-mediated kalirin-7 disinhibition. Mol Psychiatry 17:1, 99–107. 10.1038/mp.2011.35 [DOI] [PMC free article] [PubMed] [Google Scholar]
- Camell CD, et al. (2021) Senolytics reduce coronavirus-related mortality in old mice. Science 373:eabe4832. 10.1126/science.abe4832 [DOI] [PMC free article] [PubMed] [Google Scholar]
- Chakrabarti L, Galdzicki Z, Haydar TF (2007) Defects in embryonic neurogenesis and initial synapse formation in the forebrain of the Ts65Dn mouse model of Down syndrome. J Neurosci Off J urosci Soc Neurosci 27:11483–11495. 10.1523/JNEUROSCI.3406-07.2007 [DOI] [PMC free article] [PubMed] [Google Scholar]
- Chakrabarti L, Best TK, Cramer NP, Carney RSE, Isaac JTR, Galdzicki Z, Haydar TF (2010) Olig1 and Olig2 triplication causes developmental brain defects in Down syndrome. Nat Neurosci 13:927–934. 10.1038/nn.2600 [DOI] [PMC free article] [PubMed] [Google Scholar]
- Chaplot K, Jarvela TS, Lindberg I (2020) Secreted chaperones in neurodegeneration. Front Aging Neurosci 12:268. 10.3389/fnagi.2020.00268 [DOI] [PMC free article] [PubMed] [Google Scholar]
- Chen C, Jiang P, Xue H, Peterson SE, Tran HT, McCann AE, Parast MM, Li S, Pleasure DE, Laurent LC, Loring JF, Liu Y, Deng W (2014) Role of astroglia in Down’s syndrome revealed by patient-derived human-induced pluripotent stem cells. Nat Commun 5:4430. 10.1038/ncomms5430 [DOI] [PMC free article] [PubMed] [Google Scholar]
- Chen HA, Ho YJ, Mezzadra R, Adrover JM, Smolkin R, Zhu C, Woess K, Bernstein N, Schmitt G, Fong L, Luan W, Wuest A, Tian S, Li X, Broderick C, Hendrickson RC, Egeblad M, Chen Z, Alonso-Curbelo D, Lowe SW (2023) Senescence rewires microenvironment sensing to facilitate antitumor immunity. Cancer Discov 13:432–453. 10.1158/2159-8290.CD-22-0528 [DOI] [PMC free article] [PubMed] [Google Scholar]
- Chen Y, Wu H, Wang S, Koito H, Li J, Ye F, Hoang J, Escobar SS, Gow A, Arnett HA, Trapp BD, Karandikar NJ, Hsieh J, Lu QR (2009) The oligodendrocyte-specific G protein–coupled receptor GPR17 is a cell-intrinsic timer of myelination. Nat Neurosci 12:1398–1406. 10.1038/nn.2410 [DOI] [PMC free article] [PubMed] [Google Scholar]
- Cheung AKL, Ip JCY, Chu ACH, Cheng Y, Leong MML, Ko JMY, Shuen WH, Lung HL, Lung ML (2015) PTPRG suppresses tumor growth and invasion via inhibition of Akt signaling in nasopharyngeal carcinoma. Oncotarget 6:13434–13447. 10.18632/oncotarget.3876 [DOI] [PMC free article] [PubMed] [Google Scholar]
- Choi JHK, Berger JD, Mazzella MJ, Morales-Corraliza J, Cataldo AM, Nixon RA, Ginsberg SD, Levy E, Mathews PM (2009) Age-dependent dysregulation of brain amyloid precursor protein in the Ts65Dn Down syndrome mouse model. J Neurochem 110:1818–1827. 10.1111/j.1471-4159.2009.06277.x [DOI] [PMC free article] [PubMed] [Google Scholar]
- Choudhry H, Aggarwal M, Pan P-Y (2021) Mini-review: synaptojanin 1 and its implications in membrane trafficking. Neurosci Lett 765:136288. 10.1016/j.neulet.2021.136288 [DOI] [PMC free article] [PubMed] [Google Scholar]
- Contestabile A, Magara S, Cancedda L (2017) The GABAergic hypothesis for cognitive disabilities in Down syndrome. Front Cell Neurosci 11:54. 10.3389/fncel.2017.00054 [DOI] [PMC free article] [PubMed] [Google Scholar]
- Coppé JP, Desprez PY, Krtolica A, Campisi J (2010) The senescence-associated secretory phenotype: the dark side of tumor suppression. Annu Rev Pathol 5:99–118. 10.1146/annurev-pathol-121808-102144 [DOI] [PMC free article] [PubMed] [Google Scholar]
- Dierssen M, Fructuoso M, Martínez de Lagrán M, Perluigi M, Barone E (2020) Down Syndrome is a metabolic disease: altered insulin signaling mediates peripheral and brain dysfunctions. Front Neurosci 14:670. 10.3389/fnins.2020.00670 [DOI] [PMC free article] [PubMed] [Google Scholar]
- Di Micco R, Krizhanovsky V, Baker D, d’Adda di Fagagna F (2021) Cellular senescence in ageing: from mechanisms to therapeutic opportunities. Nat Rev Mol Cell Biol 22:75–95. 10.1038/s41580-020-00314-w [DOI] [PMC free article] [PubMed] [Google Scholar]
- Duchon A, del Mar Muñiz Moreno M, Chevalier C, Nalesso V, Andre P, Fructuoso-Castellar M, Mondino M, Po C, Noblet V, Birling M-C, Potier M-C, Herault Y (2022) Ts66Yah, a mouse model of Down syndrome with improved construct and face validity. Dis Model Mech 15:dmm049721. 10.1242/dmm.049721 [DOI] [PMC free article] [PubMed] [Google Scholar]
- Elsallabi O, Patruno A, Pesce M, Cataldi A, Carradori S, Gallorini M (2022) Fisetin as a senotherapeutic agent: biopharmaceutical properties and crosstalk between cell senescence and neuroprotection. Molecules 27:738. 10.3390/molecules27030738 [DOI] [PMC free article] [PubMed] [Google Scholar]
- Ermak G, Davies KJA (2013) Chronic high levels of the RCAN1-1 protein may promote neurodegeneration and Alzheimer disease. Free Radic Biol Med 62:47–51. 10.1016/j.freeradbiomed.2013.01.016 [DOI] [PMC free article] [PubMed] [Google Scholar]
- Escorihuela RM, Fernández-Teruel A, Vallina IF, Baamonde C, Lumbreras MA, Dierssen M, Tobeña A, Flórez J (1995) A behavioral assessment of Ts65Dn mice: a putative Down syndrome model. Neurosci Lett 199:143–146. 10.1016/0304-3940(95)12052-6 [DOI] [PubMed] [Google Scholar]
- Falcão AM, van Bruggen D, Marques S, Meijer M, Jäkel S, Agirre E, Samudyata, Floriddia EM, Vanichkina DP, Ffrench-Constant C, Williams A, Guerreiro-Cacais AO, Castelo-Branco G (2018) Disease-specific oligodendrocyte lineage cells arise in multiple sclerosis. Nat Med 24:1837–1844. 10.1038/s41591-018-0236-y [DOI] [PMC free article] [PubMed] [Google Scholar]
- Fan H, Zhao J, Yan J, Du G, Fu Q, Shi J, Yang Y, Du X, Bai X (2018) Effect of Notch1 gene on remyelination in multiple sclerosis in mouse models of acute demyelination. J Cell Biochem 119:9284–9294. 10.1002/jcb.27197 [DOI] [PubMed] [Google Scholar]
- Flores-Aguilar L, Iulita MF, Kovecses O, Torres MD, Levi SM, Zhang Y, Askenazi M, Wisniewski T, Busciglio J, Cuello AC (2020) Evolution of neuroinflammation across the lifespan of individuals with Down syndrome. Brain J Brain Neurol 143:3653–3671. 10.1093/brain/awaa326 [DOI] [PMC free article] [PubMed] [Google Scholar]
- Fornes O, Castro-Mondragon JA, Khan A, van der Lee R, Zhang X, Richmond PA, Modi BP, Correard S, Gheorghe M, Baranašić D, Santana-Garcia W, Tan G, Chèneby J, Ballester B, Parcy F, Sandelin A, Lenhard B, Wasserman WW, Mathelier A (2020) JASPAR 2020: update of the open-access database of transcription factor binding profiles. Nucleic Acids Res 48:D87–D92. [DOI] [PMC free article] [PubMed] [Google Scholar]
- Freund A, Laberge R-M, Demaria M, Campisi J (2012) Lamin B1 loss is a senescence-associated biomarker. Mol Biol Cell 23:2066–2075. 10.1091/mbc.E11-10-0884 [DOI] [PMC free article] [PubMed] [Google Scholar]
- Gardiner K (2006) Transcriptional dysregulation in Down syndrome: predictions for altered protein complex stoichiometries and post-translational modifications, and consequences for learning/behavior genes ELK, CREB, and the estrogen and glucocorticoid receptors. Behav Genet 36:439–453. 10.1007/s10519-006-9051-1 [DOI] [PubMed] [Google Scholar]
- Ghorbani S, Yong VW (2021) The extracellular matrix as modifier of neuroinflammation and remyelination in multiple sclerosis. Brain 144:1958–1973. 10.1093/brain/awab059 [DOI] [PMC free article] [PubMed] [Google Scholar]
- Giffin-Rao Y, Sheng J, Strand B, Xu K, Huang L, Medo M, Risgaard KA, Dantinne S, Mohan S, Keshan A, Daley RA Jr, Levesque B, Amundson L, Reese R, Sousa AMM, Tao Y, Wang D, Zhang SC, Bhattacharyya A (2022) Altered patterning of trisomy 21 interneuron progenitors. Stem Cell Reports Rep 17:1366–1379. 10.1016/j.stemcr.2022.05.001 [DOI] [PMC free article] [PubMed] [Google Scholar]
- Gillespie M, et al. (2022) The reactome pathway knowledgebase 2022. Nucleic Acids Res 50:D687–D692. 10.1093/nar/gkab1028 [DOI] [PMC free article] [PubMed] [Google Scholar]
- Gingras AC, Raught B, Sonenberg N (1999) eIF4 initiation factors: effectors of mRNA recruitment to ribosomes and regulators of translation. Annu Rev Biochem 68:913–963. 10.1146/annurev.biochem.68.1.913 [DOI] [PubMed] [Google Scholar]
- Godfrey M, Lee NR (2018) Memory profiles in Down syndrome across development: a review of memory abilities through the lifespan. J Neurodev Disord 10:5. [DOI] [PMC free article] [PubMed] [Google Scholar]
- Granholm A-CE, Sanders LA, Crnic LS (2000) Loss of cholinergic phenotype in basal forebrain coincides with cognitive decline in a mouse model of Down’s syndrome. Exp Neurol 161:647–663. 10.1006/exnr.1999.7289 [DOI] [PubMed] [Google Scholar]
- Guedj F, Pennings JL, Massingham LJ, Wick HC, Siegel AE, Tantravahi U, Bianchi DW (2016) An integrated human/murine transcriptome and pathway approach to identify prenatal treatments for Down syndrome. Sci Rep 6:32353. 10.1038/srep32353 [DOI] [PMC free article] [PubMed] [Google Scholar]
- Gupta M, Dhanasekaran AR, Gardiner KJ (2016) Mouse models of Down syndrome: gene content and consequences. Mamm Genome 27:538–555. 10.1007/s00335-016-9661-8 [DOI] [PMC free article] [PubMed] [Google Scholar]
- Hao Y, et al. (2021) Integrated analysis of multimodal single-cell data. Cell 184:3573–3587.e29. 10.1016/j.cell.2021.04.048 [DOI] [PMC free article] [PubMed] [Google Scholar]
- Harroch S, Furtado GC, Brueck W, Rosenbluth J, Lafaille J, Chao M, Buxbaum JD, Schlessinger J (2002) A critical role for the protein tyrosine phosphatase receptor type Z in functional recovery from demyelinating lesions. Nat Genet 32:411–414. 10.1038/ng1004 [DOI] [PubMed] [Google Scholar]
- Hazrati A, Soudi S, Malekpour K, Mahmoudi M, Rahimi A, Hashemi SM, Varma RS (2022) Immune cells-derived exosomes function as a double-edged sword: role in disease progression and their therapeutic applications. Biomark Res 10:30. 10.1186/s40364-022-00374-4 [DOI] [PMC free article] [PubMed] [Google Scholar]
- Head E, Lott IT, Wilcock DM, Lemere CA (2016) Aging in Down syndrome and the development of Alzheimer’s disease neuropathology. Curr Alzheimer Res 13:18–29. 10.2174/1567205012666151020114607 [DOI] [PMC free article] [PubMed] [Google Scholar]
- Helguera P, Seiglie J, Rodriguez J, Hanna M, Helguera G, Busciglio J (2013) Adaptive downregulation of mitochondrial function in Down syndrome. Cell Metab 17:132–140. 10.1016/j.cmet.2012.12.005 [DOI] [PMC free article] [PubMed] [Google Scholar]
- Hu N, Zou L (2022) Multiple functions of Hes genes in the proliferation and differentiation of neural stem cells. Ann Anat 239:151848. 10.1016/j.aanat.2021.151848 [DOI] [PubMed] [Google Scholar]
- Huang W, Li ML, Xia MY, Shao JY (2018) Fisetin-treatment alleviates airway inflammation through inhbition of MyD88/NF-κB signaling pathway. Int J Mol Med 42:208–218. 10.3892/ijmm.2018.3582 [DOI] [PMC free article] [PubMed] [Google Scholar]
- Huo HQ, Qu ZY, Yuan F, Ma L, Yao L, Xu M, Hu Y, Ji J, Bhattacharyya A, Zhang SC, Liu Y (2018) Modeling Down syndrome with patient iPSCs reveals cellular and migration deficits of GABAergic neurons. Stem Cell Reports Rep 10:1251–1266. 10.1016/j.stemcr.2018.02.001 [DOI] [PMC free article] [PubMed] [Google Scholar]
- Hyde LA, Frisone DF, Crnic LS (2001) Ts65Dn mice, a model for Down syndrome, have deficits in context discrimination learning suggesting impaired hippocampal function. Behav Brain Res 118:53–60. 10.1016/s0166-4328(00)00313-2 [DOI] [PubMed] [Google Scholar]
- Israel A (2010) The IKK complex, a central regulator of NF-B activation. Cold Spring Harb Perspect Biol 2:a000158. 10.1101/cshperspect.a000158 [DOI] [PMC free article] [PubMed] [Google Scholar]
- Izzo A, Mollo N, Nitti M, Paladino S, Calì G, Genesio R, Bonfiglio F, Cicatiello R, Barbato M, Sarnataro V, Conti A, Nitsch L (2018) Mitochondrial dysfunction in Down syndrome: molecular mechanisms and therapeutic targets. Mol Med 24:2. 10.1186/s10020-018-0004-y [DOI] [PMC free article] [PubMed] [Google Scholar]
- Jagadish N, Gupta N, Agarwal S, Parashar D, Sharma A, Fatima R, Topno AP, Kumar V, Suri A (2016) Sperm-associated antigen 9 (SPAG9) promotes the survival and tumor growth of triple-negative breast cancer cells. Tumour Biol 37:13101–13110. 10.1007/s13277-016-5240-6 [DOI] [PubMed] [Google Scholar]
- Jang DG, Sim HJ, Song EK, Kwon T, Park TJ (2020) Extracellular matrixes and neuroinflammation. BMB Rep 53:491–499. 10.5483/BMBRep.2020.53.10.156 [DOI] [PMC free article] [PubMed] [Google Scholar]
- Jin M, Xu R, Wang L, Alam MM, Ma Z, Zhu S, Martini AC, Jadali A, Bernabucci M, Xie P, Kwan KY, Pang ZP, Head E, Liu Y, Hart RP, Jiang P (2022) Type-I-interferon signaling drives microglial dysfunction and senescence in human IPSC models of Down syndrome and Alzheimer’s disease. Cell Stem Cell 29:1135–1153.e8. 10.1016/j.stem.2022.06.007 [DOI] [PMC free article] [PubMed] [Google Scholar]
- Jin S, Guerrero-Juarez CF, Zhang L, Chang I, Ramos R, Kuan C-H, Myung P, Plikus MV, Nie Q (2021) Inference and analysis of cell-cell communication using CellChat. Nat Commun 12:1088. 10.1038/s41467-021-21246-9 [DOI] [PMC free article] [PubMed] [Google Scholar]
- Jørgensen OS, Brooksbank BWL, Balázs R (1990) Neuronal plasticity and astrocytic reaction in Down syndrome and Alzheimer disease. J Neurol Sci 98:63–79. 10.1016/0022-510x(90)90182-m [DOI] [PubMed] [Google Scholar]
- Kazemi M, Salehi M, Kheirollahi M (2016) Down syndrome: current status, challenges and future perspectives. Int J Mol Cell Med 5:125–133. [PMC free article] [PubMed] [Google Scholar]
- Keller D, Erö C, Markram H (2018) Cell densities in the mouse brain: a systematic review. Front Neuroanat 12:83. 10.3389/fnana.2018.00083 [DOI] [PMC free article] [PubMed] [Google Scholar]
- Khan N, Syed DN, Ahmad N, Mukhtar H (2013) Fisetin: a dietary antioxidant for health promotion. Antioxid Redox Signal 19:151–162. 10.1089/ars.2012.4901 [DOI] [PMC free article] [PubMed] [Google Scholar]
- Kim MJ, Kim WS, Kim DO, Byun JE, Huy H, Lee SY, Song HY, Park YJ, Kim TD, Yoon SR, Choi EJ, Ha H, Jung H, Choi I (2017) Macrophage migration inhibitory factor interacts with thioredoxin-interacting protein and induces NF-κB activity. Cell Signal 34:110–120. 10.1016/j.cellsig.2017.03.007 [DOI] [PubMed] [Google Scholar]
- Kirby L, Jin J, Cardona JG, Smith MD, Martin KA, Wang J, Strasburger H, Herbst L, Alexis M, Karnell J, Davidson T, Dutta R, Goverman J, Bergles D, Calabresi PA (2019) Oligodendrocyte precursor cells present antigen and are cytotoxic targets in inflammatory demyelination. Nat Commun 10:3887. 10.1038/s41467-019-11638-3 [DOI] [PMC free article] [PubMed] [Google Scholar]
- Kobayashi H, Saragai S, Naito A, Ichio K, Kawauchi D, Murakami F (2015) Calm1 signaling pathway is essential for the migration of mouse precerebellar neurons. Dev Camb Engl 142:375–384. [DOI] [PubMed] [Google Scholar]
- Kong XF, et al. (2020) Three copies of four interferon receptor genes underlie a mild type I interferonopathy in Down syndrome. J Clin Immunol 40:807–819. 10.1007/s10875-020-00803-9 [DOI] [PMC free article] [PubMed] [Google Scholar]
- Koutsioumpa M, Drosou G, Mikelis C, Theochari K, Vourtsis D, Katsoris P, Giannopoulou E, Courty J, Petrou C, Magafa V, Cordopatis P, Papadimitriou E (2012) Pleiotrophin expression and role in physiological angiogenesis in vivo: potential involvement of nucleolin. Vasc Cell 4:4. 10.1186/2045-824X-4-4 [DOI] [PMC free article] [PubMed] [Google Scholar]
- Kumari R, Jat P (2021) Mechanisms of cellular senescence: cell cycle arrest and senescence associated secretory phenotype. Front Cell Dev Biol 9:645593. 10.3389/fcell.2021.645593 [DOI] [PMC free article] [PubMed] [Google Scholar]
- Lee CS, Bhaduri A, Mah A, Johnson WL, Ungewickell A, Aros CJ, Nguyen CB, Rios EJ, Siprashvili Z, Straight A, Kim J, Aasi SZ, Khavari PA (2014) Recurrent point mutations in the kinetochore gene KNSTRN in cutaneous squamous cell carcinoma. Nat Genet 46:1060–1062. 10.1038/ng.3091 [DOI] [PMC free article] [PubMed] [Google Scholar]
- Lee NR, Adeyemi EI, Lin A, Clasen LS, Lalonde FM, Condon E, Driver DI, Shaw P, Gogtay N, Raznahan A, Giedd JN (2016) Dissociations in cortical morphometry in youth with Down syndrome: evidence for reduced surface area but increased thickness. Cereb Cortex 26:2982–2990. 10.1093/cercor/bhv107 [DOI] [PMC free article] [PubMed] [Google Scholar]
- Li S, Guan H, Zhang Y, Li S, Li K, Hu S, Zuo E, Zhang C, Zhang X, Gong G, Wang R, Piao F (2021) Bone marrow mesenchymal stem cells promote remyelination in spinal cord by driving oligodendrocyte progenitor cell differentiation via TNFα/Relb-Hes1 pathway: a rat model study of 2,5-hexanedione-induced neurotoxicity. Stem Cell Res Ther 12:436. 10.1186/s13287-021-02518-z [DOI] [PMC free article] [PubMed] [Google Scholar]
- Liu T, Zhang L, Joo D, Sun S-C (2017) NF-κB signaling in inflammation. Signal Transduct Target Ther 2:17023–17023. 10.1038/sigtrans.2017.23 [DOI] [PMC free article] [PubMed] [Google Scholar]
- Lu J, Esposito G, Scuderi C, Steardo L, Delli-Bovi LC, Hecht JL, Dickinson BC, Chang CJ, Mori T, Sheen V (2011) S100B and APP promote a gliocentric shift and impaired neurogenesis in Down syndrome neural progenitors. PLoS One 6:e22126. 10.1371/journal.pone.0022126 [DOI] [PMC free article] [PubMed] [Google Scholar]
- Lu J, Lian G, Zhou H, Esposito G, Steardo L, Delli-Bovi LC, Hecht JL, Lu QR, Sheen V (2012) OLIG2 over-expression impairs proliferation of human Down syndrome neural progenitors. Hum Mol Genet 21:2330–2340. 10.1093/hmg/dds052 [DOI] [PMC free article] [PubMed] [Google Scholar]
- Lyle R, Gehrig C, Neergaard-Henrichsen C, Deutsch S, Antonarakis SE (2004) Gene expression from the aneuploid chromosome in a trisomy mouse model of Down syndrome. Genome Res 14:1268–1274. 10.1101/gr.2090904 [DOI] [PMC free article] [PubMed] [Google Scholar]
- Marisca R, Hoche T, Agirre E, Hoodless LJ, Barkey W, Auer F, Castelo-Branco G, Czopka T (2020) Functionally distinct subgroups of oligodendrocyte pprecursor cells integrate neural activity and execute myelin formation. Nat Neurosci 23:363–374. 10.1038/s41593-019-0581-2 [DOI] [PMC free article] [PubMed] [Google Scholar]
- Marques L, Johnson AA, Stolzing A (2020) Doxorubicin generates senescent microglia that exhibit altered proteomes, higher levels of cytokine secretion, and a decreased ability to internalize amyloid β. Exp Cell Res 395:112203. 10.1016/j.yexcr.2020.112203 [DOI] [PubMed] [Google Scholar]
- McClain CR, Sim FJ, Goldman SA (2012) Pleiotrophin suppression of receptor protein tyrosine phosphatase-β/ζ maintains the self-renewal competence of fetal human oligodendrocyte progenitor cells. J Neurosci 32:15066–15075. 10.1523/JNEUROSCI.1320-12.2012 [DOI] [PMC free article] [PubMed] [Google Scholar]
- Meharena HS, Marco A, Dileep V, Lockshin ER, Akatsu GY, Mullahoo J, Watson LA, Ko T, Guerin LN, Abdurrob F, Rengarajan S, Papanastasiou M, Jaffe JD, Tsai L-H (2022) Down-syndrome-induced senescence disrupts the nuclear architecture of neural progenitors. Cell Stem Cell 29:116–130.e7. 10.1016/j.stem.2021.12.002 [DOI] [PMC free article] [PubMed] [Google Scholar]
- Mei L, Xiong WC (2008) Neuregulin 1 in neural development, synaptic plasticity and schizophrenia. Nat Rev Neurosci 9:437–452. 10.1038/nrn2392 [DOI] [PMC free article] [PubMed] [Google Scholar]
- Mei L, Nave KA (2014) Neuregulin-ERBB signaling in the nervous system and neuropsychiatric diseases. Neuron 83:27–49. 10.1016/j.neuron.2014.06.007 [DOI] [PMC free article] [PubMed] [Google Scholar]
- Mercurio L, Lulli D, Mascia F, Dellambra E, Scarponi C, Morelli M, Valente C, Carbone ML, Pallotta S, Girolomoni G, Albanesi C, Pastore S, Madonna S (2020) Intracellular insulin-like growth factor binding protein 2 (IGFBP2) contributes to the senescence of keratinocytes in psoriasis by stabilizing cytoplasmic p21. Aging (Albany NY) 12:6823–6851. 10.18632/aging.103045 [DOI] [PMC free article] [PubMed] [Google Scholar]
- Mi J, Yang Y, Yao H, Huan Z, Xu C, Ren Z, Li W, Tang Y, Fu R, Ge X (2021) Inhibition of heat shock protein family A member 8 attenuates spinal cord ischemia-reperfusion injury via astrocyte NF-κB/NLRP3 inflammasome pathway: HHSPA8 inhibition protects spinal ischemia-reperfusion injury. J Neuroinflammation 18:170. 10.1186/s12974-021-02220-0 [DOI] [PMC free article] [PubMed] [Google Scholar]
- Mijit M, Caracciolo V, Melillo A, Amicarelli F, Giordano A (2020) Role of p53 in the regulation of cellular senescence. Biomolecules 10:420. 10.3390/biom10030420 [DOI] [PMC free article] [PubMed] [Google Scholar]
- Miranda AM, Herman M, Cheng R, Nahmani E, Barrett G, Micevska E, Fontaine G, Potier M-C, Head E, Schmitt FA, Lott IT, Jiménez-Velázquez IZ, Antonarakis SE, Di Paolo G, Lee JH, Hussaini SA, Marquer C (2018) Excess synaptojanin 1 contributes to place cell dysfunction and memory deficits in the aging hippocampus in three types of Alzheimer’s disease. Cell Rep 23:2967–2975. 10.1016/j.celrep.2018.05.011 [DOI] [PMC free article] [PubMed] [Google Scholar]
- Mo J, Kim C-H, Lee D, Sun W, Lee HW, Kim H (2015) Early growth response 1 (Egr-1) directly regulates GABAA receptor α2, α4, and θ subunits in the hippocampus. J Neurochem 133:489–500. 10.1111/jnc.13077 [DOI] [PubMed] [Google Scholar]
- Molagoda IMN, Jayasingha JACC, Choi YH, Jayasooriya RGPT, Kang CH, Kim GY (2021) Fisetin inhibits lipopolysaccharide-induced inflammatory response by activating β-catenin, leading to a decrease in endotoxic shock. Sci Rep 11:8377. 10.1038/s41598-021-87257-0 [DOI] [PMC free article] [PubMed] [Google Scholar]
- Morabito S, Miyoshi E, Michael N, Shahin S, Martini AC, Head E, Silva J, Leavy K, Perez-Rosendahl M, Swarup V (2021) Single-nucleus chromatin accessibility and transcriptomic characterization of Alzheimer’s disease. Nat Genet 53:1143–1155. 10.1038/s41588-021-00894-z [DOI] [PMC free article] [PubMed] [Google Scholar]
- Mouton-Liger F, Thomas S, Rattenbach R, Magnol L, Larigaldie V, Ledru A, Herault Y, Verney C, Créau N (2011) PCP4 (PEP19) overexpression induces premature neuronal differentiation associated with Ca(2+)/calmodulin-dependent kinase II-δ activation in mouse models of Down syndrome. J Comp Neurol 519:2779–2802. 10.1002/cne.22651 [DOI] [PubMed] [Google Scholar]
- Mukherjee C, Kling T, Russo B, Miebach K, Kess E, Schifferer M, Pedro LD, Weikert U, Fard MK, Kannaiyan N, Rossner M, Aicher M-L, Goebbels S, Nave K-A, Krämer-Albers E-M, Schneider A, Simons M (2020) Oligodendrocytes provide antioxidant defense function for neurons by secreting ferritin heavy chain. Cell Metab 32:259–272.e10. 10.1016/j.cmet.2020.05.019 [DOI] [PMC free article] [PubMed] [Google Scholar]
- Nacarelli T, Liu P, Zhang R (2017) Epigenetic basis of cellular senescence and its implications in aging. Genes 8:343. 10.3390/genes8120343 [DOI] [PMC free article] [PubMed] [Google Scholar]
- Neumann B, Segel M, Ghosh T, Zhao C, Tourlomousis P, Young A, Förster S, Sharma A, Chen CZ-Y, Cubillos JF, Rawji KS, Chalut KJ, Franklin RJM (2021) Myc determines the functional age state of oligodendrocyte progenitor cells. Nat Aging 1:826–837. 10.1038/s43587-021-00109-4 [DOI] [PubMed] [Google Scholar]
- O’Brien RJ, Wong PC (2011) Amyloid precursor protein processing and Alzheimer’s disease. Annu Rev Neurosci 34:185–204. 10.1146/annurev-neuro-061010-113613 [DOI] [PMC free article] [PubMed] [Google Scholar]
- Ogata T, Ueno T, Hoshikawa S, Ito J, Okazaki R, Hayakawa K, Morioka K, Yamamoto S, Nakamura K, Tanaka S, Akai M (2011) Hes1 functions downstream of growth factors to maintain oligodendrocyte lineage cells in the early progenitor stage. Neuroscience 176:132–141. 10.1016/j.neuroscience.2010.12.015 [DOI] [PubMed] [Google Scholar]
- Olmos-Serrano JL, Kang HJ, Tyler WA, Silbereis JC, Cheng F, Zhu Y, Pletikos M, Jankovic-Rapan L, Cramer NP, Galdzicki Z, Goodliffe J, Peters A, Sethares C, Delalle I, Golden JA, Haydar TF, Sestan N (2016) Down syndrome developmental brain transcriptome reveals defective oligodendrocyte differentiation and myelination. Neuron 89:1208–1222. 10.1016/j.neuron.2016.01.042 [DOI] [PMC free article] [PubMed] [Google Scholar]
- Ou Z, Sun Y, Lin L, You N, Liu X, Li H, Ma Y, Cao L, Han Y, Liu M, Deng Y, Yao L, Lu QR, Chen Y (2016) Olig2-targeted G-protein-coupled receptor Gpr17 regulates oligodendrocyte survival in response to lysolecithin-induced demyelination. J Neurosci 36:10560–10573. 10.1523/JNEUROSCI.0898-16.2016 [DOI] [PMC free article] [PubMed] [Google Scholar]
- Pabois A, Devallière J, Quillard T, Coulon F, Gérard N, Laboisse C, Toquet C, Charreau B (2014) The disintegrin and metalloproteinase ADAM10 mediates a canonical notch-dependent regulation of IL-6 through Dll4 in human endothelial cells. Biochem Pharmacol 91:510–521. 10.1016/j.bcp.2014.08.007 [DOI] [PubMed] [Google Scholar]
- Palmer CR, Liu CS, Romanow WJ, Lee MH, Chun J (2021) Altered cell and RNA isoform diversity in aging Down syndrome brains. Proc Natl Acad Sci U S A 118:e2114326118. [DOI] [PMC free article] [PubMed] [Google Scholar]
- Papadimitriou E, Mourkogianni E, Ntenekou D, Christopoulou M, Koutsioumpa M, Lamprou M (2022) On the role of pleiotrophin and its receptors in development and angiogenesis. Int J Dev Biol 66:115–124. 10.1387/ijdb.210122ep [DOI] [PubMed] [Google Scholar]
- Park MH, Jo M, Kim YR, Lee CK, Hong JT (2016) Roles of peroxiredoxins in cancer, neurodegenerative diseases and inflammatory diseases. Pharmacol Ther 163:1–23. 10.1016/j.pharmthera.2016.03.018 [DOI] [PMC free article] [PubMed] [Google Scholar]
- Pecze L, Randi EB, Szabo C (2020) Meta-analysis of metabolites involved in bioenergetic pathways reveals a pseudohypoxic state in Down syndrome. Mol Med Camb Med Mass 26:102. 10.1186/s10020-020-00225-8 [DOI] [PMC free article] [PubMed] [Google Scholar]
- Pinto B, Morelli G, Rastogi M, Savardi A, Fumagalli A, Petretto A, Bartolucci M, Varea E, Catelani T, Contestabile A, Perlini LE, Cancedda L (2020) Rescuing over-activated microglia restores cognitive performance in juvenile animals of the Dp(16) mouse model of Down syndrome. Neuron 108:887–904.e12. 10.1016/j.neuron.2020.09.010 [DOI] [PMC free article] [PubMed] [Google Scholar]
- Ponroy Bally B, Murai KK (2021) Astrocytes in Down syndrome across the lifespan. Front Cell Neurosci 15:702685. 10.3389/fncel.2021.702685 [DOI] [PMC free article] [PubMed] [Google Scholar]
- Ponroy Bally B, Farmer WT, Jones EV, Jessa S, Kacerovsky JB, Mayran A, Peng H, Lefebvre JL, Drouin J, Hayer A, Ernst C, Murai KK (2020) Human iPSC-derived Down syndrome astrocytes display genome-wide perturbations in gene expression, an altered adhesion profile, and increased cellular dynamics. Hum Mol Genet 29:785–802. 10.1093/hmg/ddaa003 [DOI] [PMC free article] [PubMed] [Google Scholar]
- Preciados M, Yoo C, Roy D (2016) Estrogenic endocrine disrupting chemicals influencing NRF1 regulated gene networks in the development of complex human brain diseases. Int J Mol Sci 17:2086. 10.3390/ijms17122086 [DOI] [PMC free article] [PubMed] [Google Scholar]
- Puente-Bedia A, Berciano MT, Martínez-Cué C, Lafarga M, Rueda N (2022) Oxidative-stress-associated proteostasis disturbances and increased DNA damage in the hippocampal granule cells of the Ts65Dn model of Down syndrome. Antioxidants 11:2438. 10.3390/antiox11122438 [DOI] [PMC free article] [PubMed] [Google Scholar]
- Raudvere U, Kolberg L, Kuzmin I, Arak T, Adler P, Peterson H, Vilo J (2019) g:Profiler: a web server for functional enrichment analysis and conversions of gene lists (2019 update). Nucleic Acids Res 47:W191–W198. 10.1093/nar/gkz369 [DOI] [PMC free article] [PubMed] [Google Scholar]
- Ravaioli F, et al. (2022) DNA methylation analysis of ribosomal DNA in adults with Down syndrome. Front Genet 13:792165. 10.3389/fgene.2022.792165 [DOI] [PMC free article] [PubMed] [Google Scholar]
- Reeves RH, Irving NG, Moran TH, Wohn A, Kitt C, Sisodia SS, Schmidt C, Bronson RT, Davisson MT (1995) A mouse model for Down syndrome exhibits learning and behaviour deficits. Nat Genet 11:177–184. 10.1038/ng1095-177 [DOI] [PubMed] [Google Scholar]
- Reiche L, Küry P, Göttle P (2019) Aberrant oligodendrogenesis in Down syndrome: shift in gliogenesis? Cells 8:1591. 10.3390/cells8121591 [DOI] [PMC free article] [PubMed] [Google Scholar]
- Renault-Mihara F, Okano H (2017) STAT3-regulated RhoA drives reactive astrocyte dynamics. Cell Cycle 16:1995–1996. 10.1080/15384101.2017.1377032 [DOI] [PMC free article] [PubMed] [Google Scholar]
- Reynolds LE, et al. (2010) Tumour angiogenesis is reduced in the Tc1 mouse model of Down syndrome. Nature 465:813–817. 10.1038/nature09106 [DOI] [PMC free article] [PubMed] [Google Scholar]
- Rosenberg GA (2002) Matrix metalloproteinases in neuroinflammation. Glia 39:279–291. 10.1002/glia.10108 [DOI] [PubMed] [Google Scholar]
- Sadaie M, Salama R, Carroll T, Tomimatsu K, Chandra T, Young ARJ, Narita M, Pérez-Mancera PA, Bennett DC, Chong H, Kimura H, Narita M (2013) Redistribution of the lamin B1 genomic binding profile affects rearrangement of heterochromatic domains and SAHF formation during senescence. Genes Dev 27:1800–1808. 10.1101/gad.217281.113 [DOI] [PMC free article] [PubMed] [Google Scholar]
- Safaiyan S, Kannaiyan N, Snaidero N, Brioschi S, Biber K, Yona S, Edinger AL, Jung S, Rossner MJ, Simons M (2016) Age-related myelin degradation burdens the clearance function of microglia during aging. Nat Neurosci 19:995–998. 10.1038/nn.4325 [DOI] [PMC free article] [PubMed] [Google Scholar]
- Salminen A, Kaarniranta K (2011) Control of p53 and NF-κB signaling by WIP1 and MIF: role in cellular senescence and organismal aging. Cell Signal 23:747–752. 10.1016/j.cellsig.2010.10.012 [DOI] [PubMed] [Google Scholar]
- Sarver DC, Xu C, Velez LM, Aja S, Jaffe AE, Seldin MM, Reeves RH, Wong GW (2023) Dysregulated systemic metabolism in a Down syndrome mouse model. Mol Metab 68:101666. 10.1016/j.molmet.2022.101666 [DOI] [PMC free article] [PubMed] [Google Scholar]
- Satoh J, Kawana N, Yamamoto Y (2013) Pathway analysis of ChIP-seq-based NRF1 target genes suggests a logical hypothesis of their involvement in the pathogenesis of neurodegenerative diseases. Gene Regul Syst Bio 7:139–152. 10.4137/GRSB.S13204 [DOI] [PMC free article] [PubMed] [Google Scholar]
- Satpathy AT, et al. (2019) Massively parallel single-cell chromatin landscapes of human immune cell development and intratumoral T cell exhaustion. Nat Biotechnol 37:925–936. 10.1038/s41587-019-0206-z [DOI] [PMC free article] [PubMed] [Google Scholar]
- Saul D, Kosinsky RL, Atkinson EJ, Doolittle ML, Zhang X, LeBrasseur NK, Pignolo RJ, Robbins PD, Niedernhofer LJ, Ikeno Y, Jurk D, Passos JF, Hickson LJ, Xue A, Monroe DG, Tchkonia T, Kirkland JL, Farr JN, Khosla S (2022) A new gene set identifies senescent cells and predicts senescence-associated pathways across tissues. Nat Commun 13:4827. [DOI] [PMC free article] [PubMed] [Google Scholar]
- Scheffler JM, Sparber F, Tripp CH, Herrmann C, Humenberger A, Blitz J, Romani N, Stoitzner P, Huber LA (2014) LAMTOR2 regulates dendritic cell homeostasis through FLT3-dependent mTOR signalling. Nat Commun 5:5138. 10.1038/ncomms6138 [DOI] [PMC free article] [PubMed] [Google Scholar]
- Schep AN, Wu B, Buenrostro JD, Greenleaf WJ (2017) ChromVAR: inferring transcription-factor-associated accessibility from single-cell epigenomic data. Nat Methods 14:975–978. 10.1038/nmeth.4401 [DOI] [PMC free article] [PubMed] [Google Scholar]
- Schroder K, Hertzog PJ, Ravasi T, Hume DA (2004) Interferon-γ: an overview of signals, mechanisms and functions. J Leukoc Biol 75:163–189. 10.1189/jlb.0603252 [DOI] [PubMed] [Google Scholar]
- Shipp S (2007) Structure and function of the cerebral cortex. Curr Biol 17:R443–R449. 10.1016/j.cub.2007.03.044 [DOI] [PubMed] [Google Scholar]
- Sidler C, Kovalchuk O, Kovalchuk I (2017) Epigenetic regulation of cellular senescence and aging. Front Genet 8:138. 10.3389/fgene.2017.00138 [DOI] [PMC free article] [PubMed] [Google Scholar]
- Sierra C, De Toma I, Dierssen M (2021) Single nucleus RNA-seq in the hippocampus of a Down syndrome mouse model reveals new key players in memory. bioRxiv 469102. 10.1101/2021.11.18.469102. [DOI] [Google Scholar]
- Souchet B, Guedj F, Sahún I, Duchon A, Daubigney F, Badel A, Yanagawa Y, Barallobre MJ, Dierssen M, Yu E, Herault Y, Arbones M, Janel N, Créau N, Delabar JM (2014) Excitation/inhibition balance and learning are modified by Dyrk1a gene dosage. Neurobiol Dis 69:65–75. 10.1016/j.nbd.2014.04.016 [DOI] [PubMed] [Google Scholar]
- Stagni F, Giacomini A, Emili M, Guidi S, Bartesaghi R (2018) Neurogenesis impairment: an early developmental defect in Down syndrome. Free Radic Biol Med 114:15–32. 10.1016/j.freeradbiomed.2017.07.026 [DOI] [PubMed] [Google Scholar]
- Stogsdill JA, Kim K, Binan L, Farhi SL, Levin JZ, Arlotta P (2022) Pyramidal neuron subtype diversity governs microglia states in the neocortex. Nature 608:750–756. 10.1038/s41586-022-05056-7 [DOI] [PMC free article] [PubMed] [Google Scholar]
- Stuart T, Srivastava A, Madad S, Lareau CA, Satija R (2021) Single-cell chromatin state analysis with Signac. Nat Methods 18:1333–1341. 10.1038/s41592-021-01282-5 [DOI] [PMC free article] [PubMed] [Google Scholar]
- Sturgeon X, Gardiner KJ (2011) Transcript catalogs of human chromosome 21 and orthologous chimpanzee and mouse regions. Mamm Genome 22:261–271. 10.1007/s00335-011-9321-y [DOI] [PubMed] [Google Scholar]
- Suhail TV, Singh P, Manna TK (2015) Suppression of centrosome protein TACC3 induces G1 arrest and cell death through activation of p38-p53-p21 stress signaling pathway. Eur J Cell Biol 94:90–100. 10.1016/j.ejcb.2014.12.001 [DOI] [PubMed] [Google Scholar]
- Sullivan KD, Lewis HC, Hill AA, Pandey A, Jackson LP, Cabral JM, Smith KP, Liggett LA, Gomez EB, Galbraith MD, DeGregori J, Espinosa JM (2016) Trisomy 21 consistently activates the interferon response. Elife 5:e16220. 10.7554/eLife.16220 [DOI] [PMC free article] [PubMed] [Google Scholar]
- Szaflarski W, Leśniczak-Staszak M, Sowiński M, Ojha S, Aulas A, Dave D, Malla S, Anderson P, Ivanov P, Lyons SM (2022) Early rRNA processing is a stress-dependent regulatory event whose inhibition maintains nucleolar integrity. Nucleic Acids Res 50:1033–1051. 10.1093/nar/gkab1231 [DOI] [PMC free article] [PubMed] [Google Scholar]
- Tanaka K (2009) The proteasome: overview of structure and functions. Proc Jpn Acad Ser B Phys Biol Sci 85:12–36. 10.2183/pjab.85.12 [DOI] [PMC free article] [PubMed] [Google Scholar]
- Teller JK, Russo C, Debusk LM, Angelini G, Zaccheo D, Dagna-Bricarelli F, Scartezzini P, Bertolini S, Mann DMA, Tabaton M, Gambetti P (1996) Presence of soluble amyloid Β-peptide precedes amyloid plaque formation in Down’s syndrome. Nat Med 2:93–95. 10.1038/nm0196-93 [DOI] [PubMed] [Google Scholar]
- Tewari BP, Chaunsali L, Prim CE, Sontheimer H (2022) A glial perspective on the extracellular matrix and perineuronal net remodeling in the central nervous system. Front Cell Neurosci 16:1022754. 10.3389/fncel.2022.1022754 [DOI] [PMC free article] [PubMed] [Google Scholar]
- Thomas AL, Lehn MA, Janssen EM, Hildeman DA, Chougnet CA (2022) Naturally-aged microglia exhibit phagocytic dysfunction accompanied by gene expression changes reflective of underlying neurologic disease. Sci Rep 12:19471. 10.1038/s41598-022-21920-y [DOI] [PMC free article] [PubMed] [Google Scholar]
- Ting AK, Chen Y, Wen L, Yin D-M, Shen C, Tao Y, Liu X, Xiong W-C, Mei L (2011) Neuregulin 1 promotes excitatory synapse development and function in GABAergic interneurons. J Neurosci 31:15–25. 10.1523/JNEUROSCI.2538-10.2011 [DOI] [PMC free article] [PubMed] [Google Scholar]
- Utagawa EC, Moreno DG, Schafernak KT, Arva NC, Malek-Ahmadi MH, Mufson EJ, Perez SE (2022) Neurogenesis and neuronal differentiation in the postnatal frontal cortex in Down syndrome. Acta Neuropathol Commun 10:86. 10.1186/s40478-022-01385-w [DOI] [PMC free article] [PubMed] [Google Scholar]
- Wang Q, Li M, Wu T, Zhan L, Li L, Chen M, Xie W, Xie Z, Hu E, Xu S, Yu G (2022) Exploring epigenomic datasets by ChIPseeker. Curr Protoc 2:e585. [DOI] [PubMed] [Google Scholar]
- Wang X (2020) Pleiotrophin: activity and mechanism. Adv Clin Chem 98:51–89. [DOI] [PMC free article] [PubMed] [Google Scholar]
- Waugh KA, et al. (2019) Mass cytometry reveals global immune remodeling with multi-lineage hypersensitivity to type I interferon in Down syndrome. Cell Rep 29:1893–1908.e4. 10.1016/j.celrep.2019.10.038 [DOI] [PMC free article] [PubMed] [Google Scholar]
- Wilcock DM (2012) Neuroinflammation in the aging Down syndrome brain; lessons from Alzheimer’s disease. Curr Gerontol Geriatr Res 2012:170276. 10.1155/2012/170276 [DOI] [PMC free article] [PubMed] [Google Scholar]
- Wilcock DM, Griffin WST (2013) Down’s syndrome, neuroinflammation, and Alzheimer neuropathogenesis. J Neuroinflammation 10:84. 10.1186/1742-2094-10-84 [DOI] [PMC free article] [PubMed] [Google Scholar]
- Xu R, Brawner AT, Li S, Liu JJ, Kim H, Xue H, Pang ZP, Kim WY, Hart RP, Liu Y, Jiang P (2019) OLIG2 drives abnormal neurodevelopmental phenotypes in human iPSC-based organoid and chimeric mouse models of Down syndrome. Cell Stem Cell 24:908–926.e8. 10.1016/j.stem.2019.04.014 [DOI] [PMC free article] [PubMed] [Google Scholar]
- Yao Z, et al. (2021) A taxonomy of transcriptomic cell types across the isocortex and hippocampal formation. Cell 184:3222–3241.e26. 10.1016/j.cell.2021.04.021 [DOI] [PMC free article] [PubMed] [Google Scholar]
- Yeh H, Ikezu T (2019) Transcriptional and epigenetic regulation of microglia in health and disease. Trends Mol Med 25:96–111. 10.1016/j.molmed.2018.11.004 [DOI] [PMC free article] [PubMed] [Google Scholar]
- Yu G, Wang LG, Han Y, He QY (2012) clusterProfiler: an R package for comparing biological themes among gene clusters. OMICS 16:284–287. 10.1089/omi.2011.0118 [DOI] [PMC free article] [PubMed] [Google Scholar]
- Zhang D, Sliwkowski MX, Mark M, Frantz G, Akita R, Sun Y, Hillan K, Crowley C, Brush J, Godowski PJ (1997) Neuregulin-3 (NRG3): a novel neural tissue-enriched protein that binds and activates Erbb4. Proc Natl Acad Sci U S A 94:9562–9567. 10.1073/pnas.94.18.9562 [DOI] [PMC free article] [PubMed] [Google Scholar]
- Zhang K, Chen S, Yang Q, Guo S, Chen Q, Liu Z, Li L, Jiang M, Li H, Hu J, Pan X, Deng W, Xiao N, Wang B, Wang Z, Zhang L, Mo W (2022) The oligodendrocyte transcription factor 2 OLIG2 regulates transcriptional repression during myelinogenesis in rodents. Nat Commun 13:1423. 10.1038/s41467-022-30945-w [DOI] [PMC free article] [PubMed] [Google Scholar]
- Zhang P, Kishimoto Y, Grammatikakis I, Gottimukkala K, Cutler RG, Zhang S, Abdelmohsen K, Bohr VA, Misra Sen J, Gorospe M, Mattson MP (2019) Senolytic therapy alleviates Aβ-associated oligodendrocyte progenitor cell senescence and cognitive deficits in an Alzheimer’s disease model. Nat Neurosci 22:719–728. 10.1038/s41593-019-0372-9 [DOI] [PMC free article] [PubMed] [Google Scholar]
- Zhao H, Ji Q, Wu Z, Wang S, Ren J, Yan K, Wang Z, Hu J, Chu Q, Hu H, Cai Y, Wang Q, Huang D, Ji Z, Li J, Belmonte JCI, Song M, Zhang W, Qu J, Liu GH (2022) Destabilizing heterochromatin by APOE mediates senescence. Nat Aging 2:303–316. 10.1038/s43587-022-00186-z [DOI] [PubMed] [Google Scholar]
- Zheng GXY, et al. (2017) Massively parallel digital transcriptional profiling of single cells. Nat Commun 8:14049. 10.1038/ncomms14049 [DOI] [PMC free article] [PubMed] [Google Scholar]
- Zheng LT, Ock J, Kwon B-M, Suk K (2008) Suppressive effects of flavonoid Fisetin on lipopolysaccharide-induced microglial activation and neurotoxicity. Int Immunopharmacol 8:484–494. 10.1016/j.intimp.2007.12.012 [DOI] [PubMed] [Google Scholar]
- Zhou Q, Anderson DJ (2002) The bHLH transcription factors OLIG2 and OLIG1 couple neuronal and glial subtype specification. Cell 109:61–73. 10.1016/s0092-8674(02)00677-3 [DOI] [PubMed] [Google Scholar]
- Zhou Q, Wang S, Anderson DJ (2000) Identification of a novel family of oligodendrocyte lineage-specific basic helix-loop-helix transcription factors. Neuron 25:331–343. 10.1016/s0896-6273(00)80898-3 [DOI] [PubMed] [Google Scholar]
- Zhu PJ, Khatiwada S, Cui Y, Reineke LC, Dooling SW, Kim JJ, Li W, Walter P, Costa-Mattioli M (2019) Activation of the ISR mediates the behavioral and neurophysiological abnormalities in Down syndrome. Science 366:843–849. 10.1126/science.aaw5185 [DOI] [PMC free article] [PubMed] [Google Scholar]
- Zhu Y, et al. (2015) The Achilles’ heel of senescent cells: from transcriptome to senolytic drugs. Aging Cell 14:644–658. 10.1111/acel.12344 [DOI] [PMC free article] [PubMed] [Google Scholar]
- Zigman WB, Devenny DA, Krinsky‐McHale SJ, Jenkins EC, Urv TK, Wegiel J, Schupf N, Silverman W (2008) Alzheimer’s disease in adults with Down syndrome. Int Rev Res Ment Retard 36:103–145. [DOI] [PMC free article] [PubMed] [Google Scholar]
- Zorrilla de San Martin J, Donato C, Peixoto J, Aguirre A, Choudhary V, De Stasi AM, Lourenço J, Potier M-C, Bacci A (2020) Alterations of specific cortical GABAergic circuits underlie abnormal network activity in a mouse model of Down syndrome. Elife 9:e58731. 10.7554/eLife.58731 [DOI] [PMC free article] [PubMed] [Google Scholar]
- Zusso M, Methot L, Lo R, Greenhalgh AD, David S, Stifani S (2012) Regulation of postnatal forebrain amoeboid microglial cell proliferation and development by the transcription factor Runx1. J Neurosci 32:11285–11298. 10.1523/JNEUROSCI.6182-11.2012 [DOI] [PMC free article] [PubMed] [Google Scholar]
Associated Data
This section collects any data citations, data availability statements, or supplementary materials included in this article.
Supplementary Materials
Quality control (QC) metrics for multiomic single-nucleus data and integration of snATAC-seq and snRNA-seq data for neuronal subsets, related to Figure 1. A, Quality control (QC) metrics for snATAC-seq data, including the percentage of reads in peaks, the number of peak region fragments, transcription start site (TSS) enrichment, blacklist ratio, and nucleosome signal per replicate from six-month Ts65Dn and euploid control (CTL) mice (n = 3 male mice per condition). B, As in A, but depicting QC metrics for snRNA-seq data, including the number of features, total transcript counts, and percent mitochondrial content per replicate. C, UMAP visualization of multiomic integration of snATAC-seq and snRNA-seq datasets colored by originating dataset for the excitatory neuron (ExN) subset. D, As in C, but depicting multiomic integration for the inhibitory neuron (InN) subset. Download Figure 1-1, TIF file (2.2MB, tif) .
Data Availability Statement
Sequencing data have been deposited in GEO under accession code GSE225554. All data generated or analyzed during this study are included in the manuscript and supporting files. The custom code used for this manuscript is available on GitHub at https://github.com/KalishLab/Ts65Dn_OPC_Senescence.