

SUMMARY
Tumor-associated macrophages (TAMs) play an important role in tumor immunity and comprise of subsets that have distinct phenotype, function, and ontology. Transcriptomic analyses of human medulloblastoma, the most common malignant pediatric brain cancer, showed that medulloblastomas (MBs) with activated sonic hedgehog signaling (SHH-MB) have significantly more TAMs than other MB subtypes. Therefore, we examined MB-associated TAMs by single-cell RNA sequencing of autochthonous murine SHH-MB at steady state and under two distinct treatment modalities: molecular-targeted inhibitor and radiation. Our analyses reveal significant TAM heterogeneity, identify markers of ontologically distinct TAM subsets, and show the impact of brain microenvironment on the differentiation of tumor-infiltrating monocytes. TAM composition undergoes dramatic changes with treatment and differs significantly between molecular-targeted and radiation therapy. We identify an immunosuppressive monocyte-derived TAM subset that emerges with radiation therapy and demonstrate its role in regulating T cell and neutrophil infiltration in MB.
In brief
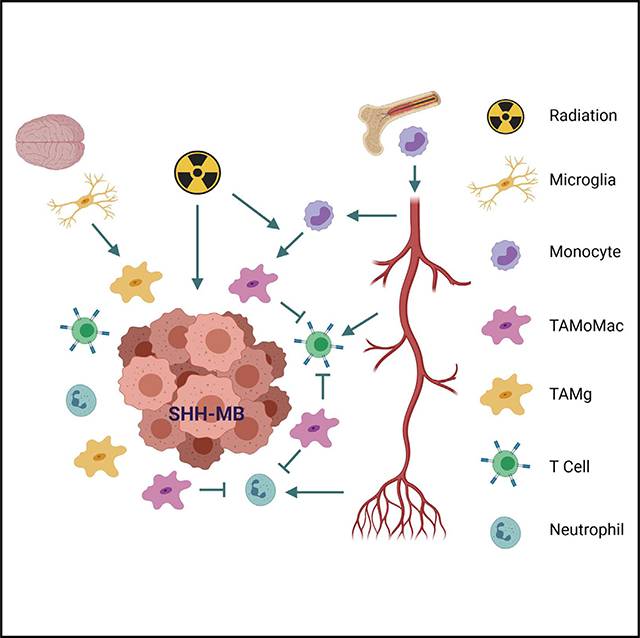
Dang et al. show that the sonic hedgehog subgroup of medulloblastoma (SHH-MB) contains macrophages derived from microglia and circulating monocytes. Radiation therapy, but not treatment targeting the SHH pathway, led to recruitment of immunosuppressive monocyte-derived macrophages that reduced T cells and neutrophils in the tumor microenvironment.
Graphical Abstract
INTRODUCTION
Medulloblastoma (MB) is the most common malignant brain tumor of childhood, accounting for more than 20% of pediatric brain tumors. It is biologically heterogeneous, comprising four major molecular subgroups: WNT, sonic hedgehog (SHH), group 3, and group 4. Given the high-grade nature of this tumor type, treatment is aggressive and involves surgical resection, chemotherapy, and radiation. MB are radiosensitive, but radiation can lead to severe neurological side effects, which limits its use in young children. Prognosis depends on multiple characteristics of the tumor and is worse for patients in the high-risk stratification. Overall survival for these patients has been estimated to be from 50% to 75% (Bouffet, 2021). Recent identification of activating pathways in MB provide opportunities for molecular-targeted therapy. Inhibitors of the SHH pathway, such as GDC-0449 (vismodegib), have shown remarkable efficacy in treating murine SHH-MB and human patients in clinical trials (Robinson et al., 2015; Romer et al., 2004). However, development of resistance to GDC-0449 remains a concern, and the drug is contraindicated in children under the age of 10 because of its negative impact on bone growth (Dijkgraaf et al., 2011; Gajjar et al., 2013; Robinson et al., 2017). Hence, there is an urgent need for novel therapeutics in high-grade MB.
Incorporation of immunotherapy into standard clinical care for several cancer types has stimulated significant interest in the tumor immune microenvironment. Brain tumors often harbor numerous TAMs, but their composition and function remain unclear (Guadagno et al., 2018). Studies in non-CNS solid tumors have shown that anti-inflammatory (M2 polarized) macrophages drive immunosuppression, whereas pro-inflammatory (M1 polarized) macrophages support anti-tumor immunity. TAMs are also emerging as predictors of clinical outcome, and modulation of their function and recruitment by various drugs are in clinical trials (Lee et al., 2018; Müller et al., 2017). Nonetheless, whether macrophages can be targeted for immunotherapy of brain tumors remains unclear. A major barrier is our incomplete understanding of TAMs in the brain. In normal tissue, macrophages display remarkable heterogeneity with regards to function, phenotype, and origin (Gordon and Plüddemann, 2017). Whether TAMs in MB display similar heterogeneity is unknown. Furthermore, most published TAM descriptions relate to steady state, and there is a major gap in our understanding of how the TAM compartment changes under therapy. Addressing these knowledge gaps is key to conceptualizing new immunotherapeutic approaches in brain tumor.
The immune microenvironment varies significantly across tumor types (Binnewies et al., 2018). Most studies of macrophages in brain tumors have been done in gliomas, and we know little about these cells in MB. In addition, most TAM studies are based on immunohistochemistry, flow cytometry, or transcriptional profiling of bulk tumor tissue, methods that have limited capacity to resolve cellular heterogeneity. As an example, a previous study showed increased overall macrophage infiltration in SHH-MB compared with other MB subtypes without further elucidating TAM subsets (Margol et al., 2015). Single-cell RNA sequencing (scRNA-seq) overcomes this limitation and is beginning to provide unprecedented insight into cellular heterogeneity in solid tumors (Chung et al., 2017; Gubin et al., 2018). This is exemplified by scRNA-seq of human MB, which provided new insight into tumor cell heterogeneity, but few macrophages were captured, precluding detailed analyses of TAMs (Hovestadt et al., 2019). Current technical and computational limitations restrict the number of cells that can be simultaneously analyzed by scRNA-seq. Hence, approaches that analyze all cells in the tumor are capable of providing an overview of cellular composition but have limited power to resolve heterogeneity within specific cell types. This is particularly true for cells that are relatively rare compared with tumor cells within the tumor microenvironment. Enrichment and targeted scRNA-seq of the cell type of interest in the tumor microenvironment will help overcome this limitation but has not been explored in MB.
In this study, we first analyzed bulk RNA sequencing (RNA-seq) from human MB collected by the newly established Open Pediatric Brain Tumor Atlas (OpenPBTA) and ascertained significant infiltration by both monocyte- and microglia-derived TAMs. We found SHH-MB to be enriched for TAMs compared with other subtypes. Hence, we used a genetically engineered Ptch1+/−Tp53−/− murine model of SHH-MB to further characterize TAMs in MB. We performed scRNA-seq of myeloid cells from tumor-harboring cerebella of these mice. scRNA-seq is an unbiased approach that can also capture novel and/or rare TAM subsets by sequencing all myeloid cells while analyzing all cerebellar myeloid cells. This overcomes technical hurdles associated with isolating macrophages specifically residing within the tumor microenvironment. We validated key findings from this unbiased approach with various histology-based methods to confirm relevance to the MB microenvironment. Our analyses identified monocyte- and microglia-derived TAMs, revealed significant heterogeneity in transcriptomic profile within both ontological subsets of TAMs, and established specific markers of these subsets. We also uncovered unanticipated differences in TAM composition in response to radiation and molecular-targeted therapy with GDC-0449 in our preclinical model. Further analyses led to the identification of monocyte-derived macrophages with immunosuppressive characteristics that accumulate in the tumor after radiation therapy. Importantly, genetic ablation of circulating monocytes (Mono) prevented emergence of immunosuppressive TAMs and was associated with significantly increased CD8 T cells and neutrophils. Altogether, our study establishes a dataset of a single-cell transcriptional profile of TAMs in SHH-MB at steady state and under distinct treatment modalities, demonstrates the value of this dataset by providing new insight into these TAMs, and uncovers a potential path to combinatorial immunotherapy in MB by revealing an immunoregulatory subpopulation of TAM with radiation therapy.
RESULTS
Human MB displays transcriptional signature of both microglia and monocyte-derived macrophages
Previous immunohistochemistry-based studies suggested enhanced macrophage infiltration in human SHH-MB (Margol et al., 2015). To elucidate TAM composition in MB, we analyzed deconvoluted bulk RNA-seq data from 123 patients comprising all four molecular subtypes of MB. This dataset was generated from biopsy samples of patients as a part of the collaborative OpenPBTA project. To estimate immune infiltration, we used microenvironment cell populations counter (MCP-counter) (Becht et al., 2016), an analysis method that quantifies abundance of eight immune and two stromal cell populations in heterogeneous tissues from RNA data. We found the SHH subtype to be significantly enriched for Mono, macrophages, T cells, and B cells (Figure 1A). In contrast, WNT tumors were enriched for natural killer cells and group 4 tumorswere enrichedfor neutrophils (Figure 1A). We performed similar analyses of the data using two additional methods: xCell and CIBERSORT (Figure S1A). CIBERSORT analysis was consistent with MCP-counter in identifying SHH-MB as the subtype with the highest signature of all macrophage subtypes. As expected with different computational methods, minor discrepancies were noted. For example, xCell estimated that WNT tumors have a higher signature of M2 macrophages, whereas SHH-MBs are highest for M1 macrophage markers.
Figure 1. Human MBs display immune infiltration and variations in myeloid composition.

(A) MCP-counter-based analysis of cellular composition using bulk RNA-seq of 123 human pediatric MBs. SHH-MBs show higher infiltration with lymphocytes and myeloid cells compared with other MB subtypes.
(B) BRETIGEA cell proportion analysis of aforementioned human MB RNA-seq data shows the co-existence of microglia (Mg) and monocytes (Mono) in human MB in varying proportions. OPC, oligodendrocyte precursor cell; Oli, oligodendrocytes; End, endothelial cells; Ast, astrocytes; Neu, neurons.
(C) Surrogate proportion variables (SPVs) of Mono are higher than of those Mg in group 4 MBs, whereas in SHH and WNT groups, Mic SPVs are higher than those of Mono.
See also Figure S1.
Next, we performed analyses using BRETIGEA (McKenzie et al., 2018), an R package that uses cell-type-specific genes for cell-type proportion estimation from bulk RNA-seq, finding that all MBs contain both microglia- and monocyte-derived TAMs at varying proportions (Figure 1B). Based on this analyses, group 4 appeared to harbor more Mono compared with microglia (Mg) (Wilcoxon p = 1.6–5), whereas SHH and WNT subtypes (Wilcoxon p = 0.026 and 0.022, respectively) have more Mg than Mono (Figure 1C). Hence, the extent and composition of TAMs in MB depends on the molecular subtype, with SHH-MB harboring the most TAMs.
Single-cell analyses of myeloid infiltrates in murine SHH-MB
Based on the observed enrichment of TAMs in human SHH-MB, we decided to study these cells in an established Ptch1+/−Tp53−/− murine model of SHH-MB (Goodrich et al., 1997; Wetmore et al., 2001). These mice develop tumors on average by 6 weeks of age. By 8 weeks, 100% of mice display tumors (Figure 2A), and all mice die by 12 weeks of age. Murine SHH-MB contained significantly more macrophages than surrounding normal cerebella tissue based on two established brain macrophage markers, IbaI (p = 0.0023) and F4/80 (p ≤ 0.0001) (Figure 2B). To study macrophage heterogeneity, we performed scRNA-seq (10× genomics) on CD11b+ myeloid cells isolated from the following samples from male Ptch1+/−Tp53−/− mice: (1) pooled cerebella from 3 mice that were 2 weeks old with no to minimal tumors (as control for homeostatic Mg in normal tissue), (2) pooled peripheral blood of the same 3 mice (as the source for control circulating Mono), and (3) two samples of cerebellum of 8-week-old mice harboring large tumors (as the source of tumor-associated myeloid cells). We chose to analyze young Ptch1+/−Tp53−/− mice, before they developed MB, for the control Mg and Mono instead of age-matched wild-type (WT) mice to maintain a consistent genotype across all samples. Data were analyzed using Seurat v.3.2.2 (Butler et al., 2018; Stuart et al., 2019). We identified the major immune cell types using SingleR (Aran et al., 2019), an annotation method that uses a user-provided reference dataset of cell-type-specific gene expression to label cells. We used the Immgen microarray database, which contains 830 samples representing 20 main hematopoietic and immune cell types, as our reference dataset for SingleR (Heng et al., 2008).
Figure 2. Murine SHH-MBs display abundant macrophages in the tumor microenvironment.

(A) MRI of a representative Ptch1+/−Tp53−/− tumor at 8 weeks of age.
(B) Immunohistochemistry with Iba1 and F4/80 showing significantly higher macrophages in tumors compared with surrounding normal cerebellum. Student’s t test. n = 3 animals. Results are expressed as mean ± SEM. **p < 0.01, ****p < 0.0001. Field: 4,345 × 3,260 μm. Scale bar: 500 and 200 μM.
Analyses of peripheral blood CD11b+ cells with SingleR identified the expected myeloid cells, including Mono (Figure S1B). Analyses of myeloid cells of normal cerebella of 2-week-old mice confirmed Mg as the dominant population (Figure S1C). Next, we aggregated these datasets with the two samples of myeloid cells isolated from tumor-bearing cerebella of 8-week-old mice. The unfiltered aggregate of all four datasets is shown in Figure S1D, and myeloid cells from two tumor samples are shown separately in Figure S1E. Data are displayed in uniform manifold approximation and projection (UMAP) dimension reduction (Figures S1D and S1E). Clustering of aggregated data using a resolution of 0.6 in Seurat identified 17 clusters. Cluster 3 contained Mono, and those expressing high levels of Ly6c2 and Ccr2 were identified as classical Mono (Figure S1F). Among Mono, the classical subset (compared with patrolling Mono) preferentially infiltrates tumors and inflamed tissue (Olingy et al., 2019). Consistent with this, classical Mono were close to TAMs in UMAP displays, suggesting an ontological relationship (Figures 3A and 3B). Given our focus on TAM and its Mono precursor, we removed all circulating myeloid cells, except classical Mono, from our aggregated dataset for further analyses. Mono assigned to cluster 3 were present in both tumor samples (Figure S1E). For downstream analysis, we preserved peripheral Mono in cluster 3 and removed Mono that came from tumors. Similarly, cells annotated as Mg from tumor samples in cluster 0 were removed to retain only Mg from cerebellum of young mice. This filtering was performed to disentangle the impact of the tumor on gene expression in Mono and Mg. All other myeloid cells from the tumors were retained. The filtered aggregate labeled by sample type is shown in Figure 3A, and Seurat-based clustering is shown in Figure 3B.
Figure 3. Single-cell RNA sequencing demonstrates myeloid heterogeneity in murine SHH-MB.

(A) UMAP plot colored by sample. Pink cells are Mic from 2-week Ptch1+/−Tp53−/− cerebella. Green cells are classical Mono from peripheral blood of same-age mice. Blue cells are from adult, tumor-bearing Ptch1+/−Tp53−/− mice.
(B) Seurat-based clustering of each subpopulation.
(C) SingleR annotation of subpopulations showing clusters 2 and 4 are microglia, clusters 8 and 1 are monocytes or macrophages, and cluster 6 comprises some cells most similar to macrophages and some cells more similar to microglia.
(D and E) Heatmap of the expression of the top 30 (D) and 4 select (E) genes of each reference label by myeloid cells in the test dataset, which are assigned that label to demonstrate confidence in the label assignment.
(F) Unbiased Monocle-based pseudotime analysis of the scRNA-seq data showing cells of clusters 2 and 4 are more similar to microglia (MG) and cells of clusters 1, 8, and 6 are more similar to monocytes (Mono).
See also Figures S1–S4.
We performed cell annotation of this filtered aggregate using SingleR (Figure 3C). As expected, this identified cluster 0 as Mg and cluster 3 as Mono. In addition, clusters 2 and 4, which are close to cluster 0, were identified as being most similar to Mg. Clusters 1, 8, and 6 were proximal to Mono. Cluster 8 contains a mixture of cells assigned as Mono and macrophages, whereas most of cluster 1 is similar to macrophages. The term macrophages is used here for cells identified by SingleR to display a gene expression signature generic to all macrophages. In contrast, Mg is a specialized brain-resident macrophage and is identified based on genes that are selectively expressed in Mg. Interestingly, cluster 6 contained a mix of cells that were similar to either Mg or macrophages. After macrophages, Mg, and Mono, the largest myeloid cluster was identified as neutrophils (Figure 3C). As validation of the cellular identity assigned by SingleR, we confirmed the expression pattern of the top 30 genes specific to the four major myeloid clusters (Figure 3D). We also showed expression of four genes that are considered hallmarks of these cell types (Figure 3E).
To examine relationships among cell clusters, we analyzed the filtered dataset using Monocle (v.2) pseudotime analysis (Trapnell et al., 2014), which plots all cells along a linear trajectory based on transcriptomic similarity. We performed this analysis in an unbiased manner without prior assignment of specific genes. Consistent with the aforementioned findings, clusters 2 and 4 were most similar to Mg of cluster 0, whereas clusters 1, 8, and 6 were most similar to Mono of cluster 3 (Figure 3F). Hence, SHH-MB significantly alters the composition of cerebellar macrophages and induces the appearance of TAMs with a gene expression signature suggestive of Mono and Mg origins.
Distinct ontological subsets of TAM display characteristic genetic markers and differentiation trajectory
Based on the aforementioned Seurat clustering and UMAP dimensional reduction, cell annotation by SingleR, and Monocle analysis, we define clusters 1, 8, and 6 as TAMs most similar to Mono or monocyte-derived TAMs (TAMoMacs) and clusters 2 and 4 as TAMs most similar to Mg (TAMgs) (Figure 4A). Adult tissue macrophages originate from two major sources: embryonic precursors or circulating Mono (Gordon and Plüddemann, 2017). Mg is a prototypical embryonic-derived macrophage, but injury and inflammation can recruit monocyte-derived macrophages in brain (Ginhoux et al., 2013). Histologically, resting Mg has a characteristic ramified appearance but upon activation changes its morphology to an amoeboidal form, becoming indistinguishable from monocyte-derived macrophages. Previous studies have proposed markers to distinguish these ontological subsets. Studies in normal brain and in diseases such as Alzheimer and neuroinflammation have put forth marker genes such as Tmem119, P2ry12, Siglech, Fcrls, Olfml3, and Sparc for Mg and Ms4a7 and Clec12a for monocyte-derived macrophages (Bennett et al., 2016, 2018; Butovsky et al., 2014; Konishi et al., 2017). Within brain tumors specifically, studies in glioma proposed P2ry12, Tmem119, Slc2a5, and Fcrls for tumor-infiltrating Mg and Itga4, Emilin2, Gda, Hp, and Sell for tumor-infiltrating, monocyte-derived macrophages (Bowman et al., 2016; Haage et al., 2019). Whether these markers change with tumor types or disease contexts is unclear. Hence, we examined their expression in our scRNA-seq dataset. Unexpectedly, we found that most of these proposed markers did not distinguish the two ontological subsets in SHH-MB because either TAMoMacs did not highly express the Mono-associated markers or a large portion of TAMoMacs also expressed the Mg-associated markers (Figure S2A). Thus, we aimed to identify better markers of TAM origins in SHH-MB using our dataset.
Figure 4. Tumor-associated macrophages are heterogeneous.

(A) Seurat-based cluster (left) and heatmap of top candidate genes distinguishing tumor-associated microglia (TAMg) from monocyte-derived macrophages.
(B) Cells of cluster 6 have the highest expression of microglia-specific genes.
(C) RNAvelocity analysis of a tumor-associated, monocyte-derived macrophage showing sequential differentiation of monocytes of cluster 3 to macrophages of cluster 8, cluster 1, and finally cluster 6.
(D) Dotplot demonstrating expression of microglia- and monocyte-specific markers by the various clusters.
(E) qRT-PCR of selected genes specific to microglia and monocyte in CD11b+CD45hiLy6G−Ly6chi (predicted to correspond to cluster 8) and CD11b+CD45hiLy6G−Ly6clo cells (predicted to correspond to clusters 1 and 6) is consistent with scRNA-seq data. Student’s t test. n = 3 animals. Results are expressed as mean ± SEM. *p ≤ 0.05, **p ≤ 0.01.
(F) Violin plots (left graph) from scRNA-seq data showing lower Siglech and higher Clec12a by TAMoMacs. RNAscope in situ (micrograph, middle) with Siglech (black) and Clec12 (red) probes of tumor tissue shows predominant mutually exclusive detection of each within cells. Student’s t test. n = 3 animals. Results are expressed as mean ± SEM. *p ≤ 0.05, **p ≤ 0.01. Field: 3,190 × 1,974 μm. Scale bar: 50 μM.
(G) Heatmaps of TAMs showing TAMoMacs have higher expression than TAMgs of genes associated with antigen presentation, interferon signaling, and activation of IRF by cytosolic recognition receptors.
See also Figures S2 and S4.
Our first step was to create a list of genes differentially expressed between Mg or circulating classical Mono cells using the FindMarkers function in Seurat with all default settings, including a logfc threshold of 0.25, use of Wilcoxon rank-sum test, and the min.pct set at 0.1. From this list, we identified Mg- or Mono-associated candidate genes by first selecting only those that showed at least 2-fold change between the cell types. We then asked what percentage of normal Mg or Mono expressed each of these genes. Mg-associated gene candidates were identified as those that were expressed in ≥50% more cells in the Mg population compared with the Mono population, and the converse were identified for the Mono-associated candidates. 84 genes met these criteria for Mono-associated genes, and 115 genes met these criteria for Mg-associated genes.
In the second step, we compared the expression levels of the 84 Mono-associated genes between TAMgs and TAMoMacs. Mono-specific genes that were expressed in greater than 50% of TAMoMacs but less than 10% of TAMgs were designated as markers for monocyte-derived macrophages (Mono specific). Nine genes met these criteria (Ccr2, Clec4a3, Clec12a, Ly6c2, Plbd1, S100a11, S100a6, Tgfbi, and Vim) (Figure 4A). However, this approach/criteria to narrow Mg-specific markers among the Mg-associated genes was not successful, because most of them were also expressed by at least 30% of TAMoMacs (Figure S2B). This may suggest that when Mono enter the brain and differentiate into macrophages, the brain environment induces expression of genes normally seen in resident Mg. This notion of microenvironmental impact on brain macrophage gene expression is consistent with prior reports (Bennett et al., 2018; Bowman et al., 2016). We next elected to analyze the top 10 genes (Olfml3, Siglech, Tmem119, Hpgds, Gpr34, P2ry12, Fcrls, Serpine2, Ttr, and Sparc) (Figure 4A) that were most different between Mg and Mono for their expression in TAMgs and TAMoMacs. This list includes six previously identified Mg-specific genes (Olfml3, Siglech, Tmem119, P2ry12, Fcrls, and Sparc). We noted that cluster 6 showed the highest expression of Mg-like genes among TAMoMacs (Figure 4B).
To examine the ontological relationships among the various clusters within the identified ontological subsets (TAMoMacs and TAMgs), and more specifically to examine whether cluster 6 cells are monocyte derived, we performed RNAvelocity analysis. This method analyzes the balance between production of spliced mRNA from unspliced mRNA and mRNA degradation to estimate the rate and direction of change of the entire transcriptome during a dynamic process such as cellular differentiation (La Manno et al., 2018). For this analysis, we used Mono in the brain for cluster 3 (instead of circulating Mono) to more accurately examine the differentiation trajectory within the tumor-bearing brain tissue. The results suggest that Mono of cluster 3 progressively differentiate into macrophages of clusters 8 and 1, followed by Mg-like cells of cluster 6 (Figures 4C and S2C). However, RNAvelocity analysis was unable to establish a lineage relationship between Mg and TAMg (Figure S2C). Pathway analysis of differentially expressed genes in TAMg versus Mg (described further in later sections), showed higher metabolic activity, proliferation, and protein translation in TAMg. This violates the basic assumption made in RNAvelocity that rate of splicing and degradation are the same in all cells analyzed, which may underlie the inability of this approach to establish a relationship between Mg and TAMg.
Next, we sought to validate the aforementioned markers of ontogeny identified by computational analyses. Among the Mg-associated genes identified earlier, Siglech and Ttr displayed the lowest expression in TAMoMacs (Figure 4D). However, Ttr is also expressed by neurons (Li et al., 2011). Among the Mono-associated genes, Clec12a displayed significant expression in all TAMoMac clusters, including cluster 6, which generally expresses low levels of other Mono markers (Figure 4D). We validated some of these Mg- and Mono-specific genes by performing qRT-PCR on CD11b+CD45hiLy6G−Ly6chi cells (predicted to contain cluster 8) and CD11b+CD45hiLy6G−Ly6clo cells (predicted to contain clusters 1 and 6) isolated from the cerebellum of tumor-harboring mice. Consistent with scRNA-seq predictions, Fcrls is higher in Ly6clo cells, whereas levels of P2ry12 and Tmem119 were not significantly different between the two isolated fractions (Figure 4E). Likewise, we confirmed lower expression of Ccr2 and Clec4a3 in Ly6clo cells. qRT-PCR comparisons between these Ly6chi and Ly6clo populations and CD11b+CD45lo (likely representing Mg) show Fcrls, P2ry12, Siglech, and Tmem119 are highest in this population, as expected (Figure S2D).
We selected Siglech and Clec12a for validation as markers for Mg and Mono origin, respectively, in SHH-MB. Given the vagaries of antibody-based detection, we used RNAscope in situ analysis, which confirmed expression of Siglech and Clec12a in tumor tissue. As predicted, Siglech, but not Clec12a, was expressed in Mg of the normal cerebellum (Figure S2E). Both markers were only expressed in Iba1-positive cells in the tumor, confirming their specific expression in macrophages. Clec12a-positive cells were scattered throughout the tumor tissue, with a somewhat higher concentration around the vasculature. Dual staining showed a largely mutually exclusive pattern of expression of these markers in most macrophages in the tumor (Figure 4F). Altogether, our findings suggest that the combination of staining for Clec12a and Siglech RNA can reliably distinguish the two major ontological brain macrophage subsets in which Siglech+Clec12a− cells represent Mg or TAMg and Siglech−Clec12a+ cells represent monocyte-derived cells in the brain.
Ontogeny and microenvironment influence TAM gene expression
Having established distinct ontology, we next analyzed the gene expression pattern of TAMg and TAMoMac subpopulations to gain insight into potential functional differences. Ingenuity Pathway Analysis (IPA) showed that TAMoMacs are enriched for pathways associated with antigen presentation, interferon signaling, and activation of interferon regulatory factors (IRFs) downstream of cytosolic pattern-recognition receptors (Figure 4G). The top 20 distinguishing genes among TAMoMac clusters (clusters 1, 6, and 8) and their Mono precursor (cluster 3) showed enrichment for genes associated with antigen presentation in cluster 1 and interferon-signaling-associated genes in cluster 8 (Figure S3A). Consistent with our previously described findings, cells of cluster 6 were enriched for Mg-associated genes. In addition, cluster 6 cells had higher expression of genes associated with phagocytosis, such as Gas6, suggesting that maturing TAMoMacs begin to adopt functions associated with tissue macrophages (Figure S3A). Finally, Mono comprising cluster 3 were enriched for genes and pathways associated with cellular migration, proliferation, and differentiation. We identified high expression of several S100 genes that are calcium-binding cytosolic proteins that are highly expressed in Mono and neutrophils, are essential to their transmigration, and are downregulated in Mono once they differentiate (Xia et al., 2018). Altogether, these findings suggest an immunoregulatory role of TAMoMacs.
TAMg subpopulations displayed downregulation of several Mg-associated markers, such as Csf1r, P2ry12, Cx3cr1, and Tmem119 (Figure S3B). The top 20 distinguishing genes among Mg and TAMg (clusters 2 and 4) showed enrichment for genes associated with antigen presentation in cluster 2 and genes involved in cell cycling in cluster 4 (Figures S3B and S3C). IPA showed that both TAMg subpopulations are more metabolically active, with higher expression of oxidative phosphorylation genes compared with homeostatic Mg. Cluster 2 had significantly higher expression of many ribosomal genes in the EIF2 signaling pathway, which is associated with activation of Mg (Cabilly et al., 2012; Ryan et al., 2020). Cluster 4 showed enrichment of genes associated with cycle cycling, particularly through the G2/M checkpoint, suggesting that they are more highly proliferative than resident Mg. These findings together suggest that TAMg is more activated and proliferative than resident Mg.
A hallmark of embryonic precursor-derived tissue macrophages, such as Mg, is their ability to maintain their local population size by proliferation. In contrast, monocyte-derived macrophages are generally considered non-proliferative (Röszer, 2018). Consistent with this notion, we found that cluster 4 enriched for mitosis-associated genes compared with not just TAMg subclusters but also all TAMoMac subclusters (data not shown). This also suggests that Mg may be induced to proliferate in the presence of a tumor.
We additionally analyzed the dataset using known markers for inflammatory (interferon gamma [IFNγ] and lipopolysaccharide [LPS]-induced pathways) and anti-inflammatory (glucocorticoid, transforming growth factor β [TGF-β], and interleukin [IL]-4 pathways) myeloid cells (Figure S4A). Mono and TAMoMacs clusters 6 and 8 have higher expression of several anti-inflammatory markers that are lost in TAMoMac cluster 1. Homeostatic Mg have higher expression of two markers of anti-inflammation, Adora3 and Tgfbr2, that are decreased in TAMgs. Cluster 3 and 8 TAMoMacs have higher expression of several genes associated with inflammation (Figure S4B), thus showing that cells of the same cluster can have increased expression of both inflammatory and anti-inflammatory genes in comparison to other cell clusters. An interesting observation was higher expression of Trem2 (triggering the receptor expressed on myeloid cells) and Apoe (apolipoprotein E) in both TAMgs and TAMoMacs compared with homeostatic Mg and peripheral Mono (Figure S4C). These two genes have been previously associated with activated Mg in neurodegenerative pathologies such as amyotrophic lateral sclerosis, multiple sclerosis, and Alzheimer disease (Krasemann et al., 2017). This may indicate some degree of functional overlap of pathologically activated Mg in neurodegenerative diseases and tumors.
To examine the relationship between TAMs and homeostatic brain myeloid cells, we compared our data with a recently published scRNA-seq dataset of murine brain macrophages and Mono (Li et al., 2019). Using the gene expression signatures of Mg and Mono subsets identified by Li and colleagues as the reference library for SingleR, we found good concordance between homeostatic Mg in the two independent datasets (Figure S4D) (Li et al., 2019). Highly proliferating TAMg cells (clusters 2 and 4, as well as a subset of cluster 6) in our data were identified as being most similar to S phase Mg in their dataset. Mono of our cluster 3 and a subset of cluster 8 cells were annotated as being closest to G2/M Mg in their dataset. Nonetheless, most cells in our clusters 8, 1, and 6 were annotated to be most similar to CD209a+ Mono in their dataset.
Finally, we wished to compare our scRNA-seq findings to another brain tumor model, selecting scRNA-seq data from a mouse model of an atypical teratoid rhabdoid tumor (ATRT) (Melcher et al., 2020). Like MB, ATRT is an embryonal tumor. We selected CD68+ cell clusters (macrophages) from the ATRT dataset and annotated these clusters with SingleR, using our dataset as the reference library (Figure S4E). This approach identified cluster 4 in ATRT as Mg and composed of cells that were similar to MB TAMg (clusters 2 and 4). Most monocyte-derived macrophages in ATRT resembled cells of MB TAMoMac clusters 8 and 1. These findings support the existence of ontologically and functionally similar TAMs in two embryonal brain tumor models.
Treatment modality alters TAM composition in SHH-MB
There is a great deal of interest among oncologists and tumor immunologists in characterizing the intratumoral immune responses to radiation, chemotherapy, and molecular-targeted therapy. The overarching goal is to identify opportunities to combine existing treatments with emerging immunotherapeutic approaches. However, almost nothing is known about how TAMs respond to treatment in brain tumors, especially SHH-MB. Hence, we next investigated TAM responses to two distinct treatment modalities: SHH-pathway inhibitor GDC-0449 that is currently in clinical trial and radiation that is a part of the current standard of care for all MB subtypes.
We followed a previously published GDC-0449 treatment regimen (4 days of twice-daily treatment at 100 mg/kg/dose) that was shown to reduce proliferation (Ki67 staining, reduced from 70% to 10%) and increase apoptosis (TUNEL staining, increased from 3% to 8%) within tumors of the same SHH-MB murine model (Romer et al., 2004). Importantly, these effects were accompanied by a clear survival advantage in which all untreated mice died by 10 weeks of age, whereas 50% of treated mice were still alive at 21 weeks of age (Romer et al., 2004). To examine the impact of radiation therapy in Ptch1+/−p53−/− tumors, we performed MRI of mice before and after radiation to determine the effects on tumor size, cell proliferation (Ki67+), and apoptosis (caspase-3). 7-week-old tumor-bearing mice were imaged at baseline and 5 days later to measure tumor growth. Mice then received a single dose of 10 Gy radiation and were re-imaged 5 days later to measure tumor response. This analyses clearly showed significant reduction in tumor size post-radiation (Figure S5A). Analyses of tumor samples also showed significantly reduced cell proliferation (p ≤ 0.05) and increased apoptosis (p ≤ 0.01) with radiation (Figure S5B). Thus, both radiation and GDC-0449 therapy are associated with tumor regression, reduced cell proliferation, and enhanced apoptosis in murine SHH-MB.
Next, we examined TAMs in irradiated and GDC-0449-treated tumor samples using immunohistochemical (IHC) staining with F4/80, finding dramatic increase in TAM infiltration with radiation (p ≤ 0.01, Figure 5A). We then performed scRNA-seq on CD11b+ myeloid cells isolated from tumor-harboring cerebellum of mice receiving each of the two treatment modalities, radiation or GDC-0449, and aggregated data from two samples of each treatment with batch correction (Figure 5B). Using SingleR to annotate cells, we found that radiation induces a larger relative proportion of Mono recruitment compared with GDC-0449. We also used gene signatures of the different myeloid cell clusters identified in our previous analyses of untreated tumors as the reference dataset for SingleR (Figures 5B and S5C). Clusters 0, 1, and 3 are Mono and monocyte-derived TAMs in treated tumors that are similar to clusters 1, 6, and 8, respectively, in TAMoMacs of untreated tumors. Cluster 5 of treated tumors appears to contain macrophages, Mono, and neutrophils (Figures 5B and S5C). Clusters 2 and 6 of treated TAMs resemble those of cluster 2 in untreated tumors. Cluster 4 of untreated tumors is reduced after GDC-0449 treatment.
Figure 5. The composition of tumor-associated macrophages varies with treatment modality.

(A) Immunohistochemical staining with F4/80 shows a dramatic increase in macrophages with radiation therapy. Student’s t test. n = 3 animals per treatment group. Rsssssesults are expressed as mean ± SEM. **p < 0.01. Field: 3,190 × 1,974 μm. Scale bar: 200 μM.
(B) UMAP plots of myeloid cells from treated tumors show higher microglia-derived and monocyte-derived macrophages with GDC-0449 and radiation treatment, respectively.
(C) RNAscope in situ (micrograph, right) with Siglech (black) and Clec12 (red) probes show the large increase in Clec12a-expressing, monocyte-derived macrophages with radiation that is consistent with scRNA-seq data (UMAP, left). Scale bar: 50 μM.
(D) Heatmap of TAMs from irradiated tumors shows clusters 3 and 5 have higher expression of genes associated with migration of the cells from the vasculature and IL-10 signaling.
(E) Distribution (UMAP, left) and expression (violin plot, right) of Ly6c2 and Ccr2 show high levels in monocyte-derived clusters that accumulate after radiation.
(F) T cell proliferation assay shows Cd11b+Cd45hiLy6G−Ly6chi, but not Cd11b+Cd45hiLy6G−Ly6clo, from irradiated Ccr2WT tumors suppresses proliferation of CD3/CD28-stimulated splenic CD8+ cells. The x axis shows carboxyfluorescein succinimidyl ester (CFSE)-associated fluorescence in CD8+ T cells. Student’s t test. n = 3 (triplicate samples from one mouse). An additional two mice were analyzed to confirm differences in suppression of T cell proliferation between the two cell types. Results are expressed as mean ± SEM. ***p < 0.001.
See also Figure S5.
Using the ontological markers we previously identified, clusters 4, 2, and 6 were labeled as Mg derived in treated tumors and displayed high expression of Siglech (Figure 5C). Likewise, clusters 0, 1, 3, and 5 were annotated as Mono/macrophages in treated tumors and showed higher expression of Clec12a (Figure 5C). We also performed in situ hybridization with Siglech and Clec12a probes on tumor tissue to confirm the scRNA-seq findings of radiation-induced enhancement of monocyte-derived TAMs (Figure 5C) and quantified the probe staining (Figure S5D).
Because TAMoMacs were significantly increased with radiation, we examined the gene expression profile of TAMoMac clusters after radiation therapy. Clusters 3 and 5 showed significant enhancement for pathways related to cell adhesion, diapedesis, and IL-10 signaling (Figure 5D). Enrichment of adhesion and diapedesis pathways and high levels of Ly6c2 and Ccr2 (Figure 5E) support the notion that these cells are newly recruited from circulating Mono. IL-10 signaling in myeloid cells is frequently associated with an immunosuppressive phenotype (Avdic et al., 2013; Mittal et al., 2015). Hence, we examined immunemodulatory properties of radiation-induced, monocyte-derived cells by performing an in vitro T cell proliferation assay. We relied on a previously published flow-cytometry-based method of identifying monocyte-derived macrophages from Mg based on their higher expression of CD45 (Crotti and Ransohoff, 2016; Lewis et al., 2014). We isolated CD11b+CD45hiLy6−GLy6chi cells (enriched for Ly6c-high TAMoMacs) and CD11b+CD45hiLy6G−Ly6clo cells (enriched for Ly6c-low TAMoMacs) (Figure S5E) from cerebella of irradiated tumor-bearing mice and co-cultured them with splenic T cells stimulated with anti-CD3/CD28. Remarkably, CD8+ T cell proliferation was significantly inhibited by CD11b+CD45hiLy6G−Ly6chi cells, but not CD11b+CD45hiLy6G−Ly6clo cells (Figure 5F). CD11b+CD45lo cells that correspond to TAMg also did not inhibit T cell proliferation (Figure S5F). Altogether, these findings show accumulation of a monocyte-derived immunosuppressive population with radiation, but not molecular-targeted therapy.
Reducing monocyte-derived TAMs promotes neutrophil and CD8 T cell accumulation in irradiated tumors
Given the immunosuppressive signature of the Ly6c2+/Ccr2+ monocyte-derived macrophages and their ability to suppress T cell proliferation in vitro, we next sought to determine the impact of reducing these cells on the overall tumor immune microenvironment. We attempted to reduce intratumoral Mono in our SHH-MB model by breeding the Ptch1+/−Tp53−/− mice to the Ccr2−/− mice that are deficient in circulating Mono (Boring et al., 1997) (Figure 6A) to generate Ptch1+/− p53−/− Ccr2−/− (henceforth Ccr2KO). Tumor growth in these mice were similar to Ptch1+/− p53−/− Ccr2 WT (henceforth Ccr2WT) (Figure S6A). We also did not see a survival difference between Ccr2WT and Ccr2KO. Mono deficiency in the absence of Ccr2 was reported to correlate with reduced survival in a genetically distinct Smo mouse model of SHH-MB (Maximov et al., 2019). SHH-MB tumor progression in our Ptch1+/− p53−/− model is far more aggressive than the Smo model used by Maximov and colleagues, which may underlie this discrepant observation (Maximov et al., 2019). Nonetheless, we found that Ccr2KO mice are similarly responsive to radiation (average of 25% tumor volume reduction) in comparison to Ccr2WT (average of 20% volume reduction) (Figure S6A).
Figure 6. Decreasing monocyte-derived macrophages enhances CD8 T cell and neutrophil infiltration.

(A) Ptch1+/−Tp53−/− (Ccr2WT) and Ccr2−/− mice were bred to produce Ptch1+/−Tp53−/−Ccr2−/− (Ccr2KO) mice.
(B) Flow cytometry of cerebellar myeloid cells showing reduced Cd11b+Cd45hiLy6G−Ly6chi cells in irradiated Ccr2KO mice. Student’s t test. N = 8 Ccr2WT mice, 6 Ccr2KO mice. Results are expressed as mean ± SEM. *p ≤ 0.05.
(C) UMAP plots of scRNA-seq of cerebellar leukocytes from irradiated Ccr2WT and Ccr2KO showing reduced monocyte-derived macrophages and enhancedneutrophils in the latter.
(D) RNAscope in situ with Siglech (black) and Clec12 (red) probes showing reduced accumulation of Clec12a-positive cells in irradiated Ccr2KO in comparison to Ccr2WT of Figure 5C. Scale bar: 50 μM.
(E and F) Immunohistochemical staining with Ly6G (E) and CD8 (F) antibody showing an increase in neutrophil and CD8+ T cells in irradiated tumors from Ccr2KO (right plots) compared with Ccr2WT (left plots). Student’s t test. n = 3 animals per treatment group. Results are expressed as mean ± SEM. **p ≤ 0.01, ***p ≤ 0.001. Field: 3,190 × 1,974 μm. Scale bar: 200 μM.
See also Figure S6.
Flow cytometry showed a significantly lower percentage, but not depletion, of cerebellar CD45+CD11b+Ly6chi cells in Ccr2KO compared with Ccr2WT mice (Figure 6B). This is consistent with prior reports that Mono recruitment to the tumor is not exclusively Ccr2 dependent (Bennett et al., 2018). We measured absolute quantities of cells and observed a trend of decreased CD11b+CD45hiLy6G−Ly6chi and CD11b+CD45hiLy6G−Ly6clo cells with increased CD11b+CD45hiLy6G+ neutrophils cells per cubic millimeter of tumor (Figure S6B).
Next, we performed scRNA-seq on three samples each of irradiated Ccr2WT and Ccr2KO to study changes in the composition of immune infiltrates upon Mono deficiency in SHH-MB (Figure 6C). For sequencing, some samples were enriched for CD11b+ and some were enriched for CD45+ cells. To quantify the proportion of major immune cell types, we compared scRNA-seq of CD45+-enriched cells from a pair of Ccr2WT and Ccr2KO. As expected, tumor-bearing Ccr2KO cerebella had reduced accumulation of Mono and macrophages (23% in Ccr2KO and 65% in Ccr2WT) (Figure 6C). Consistent with this, Clec12a-expressing TAMoMacs were reduced in Ccr2KO (Figures 6D, 5C, and S6C). We found no differences in the accumulation of suppressive Foxp3-expressing regulatory T cells (Tregs) (Figure S6D). Strikingly, more than 50% of infiltrating myeloid cells in irradiated Ccr2KO cerebella were composed of neutrophils. We confirmed this in the tumor microenvironment via IHC with anti-Ly6G antibodies, finding a nearly 8-fold increase in neutrophil infiltration of Ccr2KO tumors (Figure 6E). Compared with circulating neutrophils and neutrophils that infiltrate Ccr2WT tumor-harboring cerebella, we found that tumor-associated neutrophils (TANs) in Ccr2KO expressed higher levels of genes associated with IL-10 signaling (Figure S6E). Hence, these TANs may be immunoregulatory, akin to previously described neutrophilic MDSCs (myeloid-derived suppressor cells) (Gabrilovich and Nagaraj, 2009). Finally, we examined the frequency of CD8 T cells, finding a nearly 5-fold increase in CD8 T cell infiltration within the tumors of Ccr2KO mice (Figure 6F). Despite the accumulation of neutrophils/granulocytic MDSCs, CD8+ T cell increases within tumors in Ccr2KO suggests that perhaps monocyte-derived macrophages or monocytic MDSCs are more immunosuppressive compared with neutrophils/granulocytic MDSCs in our system.
Altogether, these data show accumulation of an immunosuppressive monocyte-derived macrophage upon radiation therapy in SHH-MB. Reducing this population appeared to engender an immunostimulatory tumor microenvironment marked by increased CD8 T cell infiltration. However, further immune responses may be restrained by the accumulation of immunosuppressive neutrophils.
DISCUSSION
TAMs play an important role in the pathobiology of solid tumors. Pro-inflammatory TAMs support, whereas anti-inflammatory TAMs suppress, anti-tumor immune responses. TAMs can also produce factors that promote tumor growth, angiogenesis, and metastasis (Lee et al., 2018; Maximov et al., 2019). Studies in many types of solid tumors show that TAMs are heterogeneous and their composition varies among tumors (Alshetaiwi et al., 2020; Gubin et al., 2018; Melcher et al., 2020). Despite increasing interest in TAMs as therapeutic targets, most studies have been performed on tumors outside the brain. The brain microenvironment is unique from an immunological perspective; hence, findings from other solid tumors may not be fully applicable to TAMs in brain tumors. Furthermore, the few TAM studies in brain mostly relate to gliomas and one recent study employing single-cell analysis on atypical teratoid rhabdoid tumors (Melcher et al., 2020), leaving a major gap in our understanding of these cells in other types of brain tumors. Hence, the scRNA-seq of murine SHH-MB generated in this study will be a useful resource for the larger neuro-oncology community. Another resource described here is the OpenPBTA dataset of human MB RNA-seq, which is newly established, well curated, and publicly available. The new insight into TAMs described here highlights the value of these datasets in understanding the immune microenvironment of SHH-MB.
Our findings regarding TAM ontogeny align with previous notions regarding dual origins of brain tumor macrophages and extend these by identifying markers of ontologically distinct TAMs. Nonetheless, further studies are needed to confirm whether Siglech and Clec12a mark Mg and Mono origins of TAMs in other types of brain tumors. Our analyses of monocyte-derived TAMs identified the distinct maturation states as Mono differentiate into TAMs in the brain. Notably, these monocyte-derived cells begin to acquire expression of genes typically associated with Mg, underscoring the impact of the brain microenvironment on macrophage gene expression. An intriguing observation relates to the proliferative nature of microglia-derived TAMs, but not monocyte-derived TAMs. This is consistent with previous observations that tissue macrophages derived from embryonic precursors, like Mg, have significantly higher proliferative capacity compared with monocyte-derived macrophages (Röszer, 2018). However, why TAMg is more proliferative than its precursor Mg is unclear at present and warrants further investigation.
Our findings regarding the impact of treatment modality on TAM heterogeneity are particularly interesting, with important implications in immunotherapy. GDC-0449 and radiation induced distinct changes in TAM composition, and in this study, we mostly focus on radiation that induced a large and distinct population of monocyte-derived TAMs with immunosuppressive hallmarks. Nonetheless, changes induced upon GDC-0449 treatments are significant and might inform future attempts to combine immunotherapy with molecular-targeted approaches. Radiation therapy may induce release of damage-associated molecular patterns from cancer cells that can recruit Mono via the chemokine CCL2, which may explain the selective recruitment of TAMoMacs with radiation, but not GDC-0449 therapy (Liang et al., 2017).
The dramatic infiltration of neutrophils post-radiation in the absence of TAMoMacs suggest an inhibitory role of TAMoMacs on neutrophil infiltration. Perhaps a more important question is whether these neutrophils promote or inhibit anti-tumor immune responses. The depletion in Ccr2 leading to a compensatory increase in neutrophils has been previously shown in a few non-CNS tumors (Nywening et al., 2018; Pahler et al., 2008; Sawanobori et al., 2008). The correlation between TAMoMacs and neutrophil infiltration is highly intriguing, but its mechanistic basis and functional implications remain unclear. Indeed, the function of TANs remains unclear, especially in brain tumors, with evidence reported for both anti- and pro-tumor activity (Piccard et al., 2012; Powell and Huttenlocher, 2016; Takeshima et al., 2016). If these neutrophils in SHH-MB are immunosuppressive, perhaps dual depletion of neutrophils and monocyte-derived macrophages may engender a more robust adaptive immune response with radiation therapy.
In summary, we present comprehensive myeloid-focused analysis of bulk RNA-seq of human MB and scRNA-seq of murine SHH-MB and demonstrate the value of this dataset as a discovery tool.
STAR★METHODS
RESOURCE AVAILABILITY
Lead contact
Further information and request for resources and reagents should be directed to and will be fulfilled by the lead contact, Malay Haldar (mhaldar@pennmedicine.upenn.edu)
Materials availability
This study did not generate new unique reagents.
Data and code availability
The accession number for all new scRNA-Seq data reported in this paper is [GEO: GSE166691].
EXPERIMENTAL MODEL AND SUBJECT DETAILS
Human samples
Brain tumor samples were collected for the Pediatric Brain Tumor Atlas, a collaborative effort by Children’s Brain Tumor Tissue Consortium and Pacific Pediatric Neuro-Oncology Consortium with patients and their families. Data in this atlas include matched tumor/normal tissue, whole genome sequencing, exome sequencing, and RNA-seq, proteomics, and miRNA along with longitudinal clinical data, pathology reports, and imaging data. A manuscript detailing the establishment of this dataset is currently in preparation and can be found at https://alexslemonade.github.io/OpenPBTA-manuscript/.
Animals
Three genetically engineered models purchased from Jackson Laboratory were used: Ptch+/− (stock no. 030494), Tp53−/− (stock no. 002101), Ccr2−/− (004999). Ptch1+/−Tp53−/− mice were bred and Ccr2−/− genotyping was performed as previously reported (Boring et al., 1997; Wetmore et al., 2001). Both males and females of both Ptch1+/−Tp53−/− and Ptch1+/−Tp53−/−Ccr2−/− were used for this study. Mice were bred and maintained in specific pathogen free facilities at the University of Pennsylvania. Mice were group-housed (21°C; 12h:12h light: dark cycle) and given ad libitum access to standard rodent diet. Mice used for source of homeostatic microglia and peripheral myeloid cells were 2 weeks old. Mice for all other experiments were 7 to 8 weeks old. All animal procedures were conducted according to National Institutes of Health guidelines and approved by the Institutional Animal Care and Use Committee at the University of Pennsylvania.
Mice were treated with SMO inhibitor, GDC-0449 (Chemitek, suspended in 0.5% methylcellulose and 0.2% Tween 80) at a dose of 100mg/kg twice a day for 4 days. Brains were resected and analyzed 12 hours after the 8th dose.
Radiation treatment was completed on a Small Animal Radiation Research Platform that delivers photon radiation with CT-guided location. Mice were anesthesized with 2% isoflurane in a carrier gas of medical grade air utilizing an induction chamber connected to anesthesia machine (Matrx). Once the mouse reached the desired plane of anesthesia (~2 minutes), the animal was placed on the SARRP’s (Xstrahl Life Sciences) irradiation platform with the nose of the mouse in a nosecone where flow of administered isoflurane (maintained at 2%) was remotely controlled using Somnosuite (Kent Scientific) anesthesia system. The mouse tumor was targeted manually with the help of onboard positioning lasers of the SARRP. 10Gy doses were delivered using 10 mm diameter collimated beam of X-rays with tube potential of 220kVp, 13mA current and dose rate of ~2Gy/min. Mice that were used for scRNA-Seq received 3 doses of 10Gy radiation on consecutive days. Whole cerebellum was resected for TAM isolation 5 days after the last dose of radiation. Tissues from irradiated mice for all other experiments received 1 dose of 10Gy radiation and tissues were analyzed 5 days after radiation.
METHOD DETAILS
RNaseq analysis of human tumors
Collapsed RNA-Seq data from 123 human medulloblastoma tissues were obtained through data release V13 of the OpenPBTA project (https://github.com/AlexsLemonade/OpenPBTA-analysis), a global open science collaborative efforts of the Children’s Brain Tumor Tissue Consortium, Pediatric Neuro-oncology Consortium, Alex’s Lemonade Stand Foundation’s Childhood Cancer Data Lab, and the Center for Data-Driven Discovery in Biomedicine at the Children’s Hospital of Philadelphia.
Microenvironment Cell Populations-counter (MCP-Counter), xCell, and CIBERSORT methods from the R package immunedeconv (Becht et al., 2016; Chen et al., 2018; Aran et al., 2017) were used to deconvolute the tumor microenvironment of 123 human medulloblastoma RNA-Seq samples consisting of four molecular subtypes i.e., Group 3 (n = 15), WNT (n = 11), Group 4 (n = 67) and SHH (n = 31). Analysis represents cell type enrichment as abundance scores that are correlated to actual cell type proportions. To visualize the subtype specific enrichment, we created a heatmap of average immune scores per cell type across each molecular subtype.
BRETIGEA (McKenzie et al., 2018) method was used to find surrogate proportion variables (SPV) of brain cells astrocytes, endothelial cells, microglia, neurons, oligodendrocytes, and oligodendrocyte precursor cells, derived from each of human, mice, and combination human/mouse datasets. In addition to that, we added monocyte marker genes from prior published work and monocyte marker genes from xCell (Aran et al., 2017) to calculate surrogate proportion variables for monocyte cell types in brain samples. The results should be considered as preliminary data which needs further validation by correlating SPV to true monocyte cell proportions in control datasets. We ran function findCells() using SVD method to calculate SPVs and all 1000 marker genes for brain cell types provided in BRETIGEA package along with 317 genes for monocyte. All cell type SPVs were then plotted for each sample as stacked bar plots.
Magnetic resonance imaging and analysis of tumor volume
Images were obtained with a 9.4 Tesla 31 cm horizontal bore MR System using ParaVision acquisition software. During the scan the mouse laid in a prone position within the coil. Body temperature was maintained at 37°C. Mice were anesthetized throughout the experiment by a gaseous mixture of isoflurane and oxygen. The respiration rate was continuously measured using the Small Animal Monitoring and Gating System (SA Instrument). After obtaining a series of localizers, contiguous image slices capturing the entire brain volume were obtained in the coronal directions. Fifteen slices of 0.5 mm thickness were acquired inter-leaved with a FOV of 20 × 20 mm. Other conditions were as follow: echo time 2ms, repetition time 200ms, averages of 1, repetitions 1. The time of acquisition was approximately 5 minutes. Volumetric analysis was carried out using ITK-SNAP (Yushkevich et al., 2006; http://www.itksnap.org/pmwiki/pmwiki.php).
scRNA-sequencing and analysis
Whole cerebellar tissue were mechanically homogenized in RPMI medium. Immune cells were purified using a 70/30 Percoll (Sigma Aldrich, 17–0891-02) gradient spun for 30 minutes at 500G. Cells at the interface were collected and further purified with CD11b+ magnetic microbeads (Miltenyi Biotec, 130–092-636) or CD45 beads (Miltenyi Biotec, 130–052-301) through two consecutive LS columns (Miltenyi Biotec, 130–042-401). Peripheral blood was collected in heparinized tubes and spun down to collect cellular components. Red blood cells were lysed (ACK lysing buffer). Remaining lymphocytes were isolated with CD11b+ magnetic beads.
Next-generation sequencing libraries and sequencing were conducted at the Center for Applied Genomics Core at the Children’s Hospital of Philadelphia. Libraries were prepared using the 10x Genomics Chromium Single Cell 3′ Reagent kit v2 per manufacturer’s instructions. Libraries were uniquely indexed using the Chromium i7 Sample Index Kit, pooled, and sequenced on an Illumina HiSeq sequencer in a paired-end, single indexing run. Sequencing for each library targeted 20,000 mean reads per cell. Data was processed using the Cellranger pipeline (10x genomics, v.3.0.2) for demultiplexing and alignment of sequencing reads to the mm10 transcriptome and creation of feature-barcode matrices. Individual single cell RNaseq libraries were aggregated using the cellranger aggr pipeline. Libraries were normalized for sequencing depth across all libraries during aggregation. Secondary analysis on the aggregated feature barcode matrices was performed using the Seurat package (v.3.0) within the R computing environment. Briefly, cells expressing less than 200 or more than 4000 genes were excluded from further analysis. Additionally, cells expressing greater than 10% mitochondrial genes were excluded from the dataset. Batch correction was performed using a comprehensive integration algorithm (Stuart et al., 2019). Log normalization and scaling of features in the dataset was performed prior to principal component dimensionality reduction, clustering, and visualization using UMAP. Generally, 15 PCAs were used in each analysis and resolution was set at 0.6. Differentially expressed genes and identification of cluster or cell type specific markers were identified using a Wilcoxon rank sum test between each defined group. P value adjustment was performed using Bonferroni correction based on total number of genes in the aggregated dataset.
The Monocle2 package in R was used to determine pseudotime trajectories in separate cell subpopulations (Trapnell et al., 2014). SingleR (Aran et al., 2019) in R was used to annotate cells in test dataset. Reference cells were pulled from Immgen database that is available within the SingleR package. The program package Velocyto (La Manno et al., 2018) was used to analyze expression dynamics in the myeloid cells of untreated tumors The program enables estimations of expression dynamics by distinguishing unspliced and spliced mRNA reads in the cellranger single cell RNaseq output. Velocyto was run on each 10x sample using an implementation of python (v.3.6.8, cite python). Resulting loom files were aggregated using loompy. The aggregated loom file was converted to a Seurat object in R (v.3.6.2), where cell filtering, QC, and dimensional reduction were performed. The velocyto.R library was used on the subsetted Seurat object to estimate RNA velocities of the single cells. Expression trajectories were overlaid on the Seurat UMAP for visualization. Analysis of differential genes between clusters were performed using Ingenuity Pathway Analysis software.
Immunohistochemistry
Whole mouse brain tissues were fixed in 4% formaldehyde for 7 days and standard paraffinization was performed. Sections were cut to 5 um thickness. Sections were rehydrated in xylene and serial ethanol concentrations. Antigen retrieval was achieved with sodium citrate buffer (ph7 or 9) in a pressure cooker. Sections were incubated overnight at 4°C with primary antibody. Anti-mouse primary antibodies used include the following: IbaI (Wako Chemicals, 019–19741), F4/80 (Life Technologies, MF48000), CD8 (Abcam, ab203035), Ly6G (StemCell Technologies 60031), caspase 3 (R&D Systems, AF835), Ki67 (Abcam, ab16667), and FoxP3 (eBioscience, 14–5773). Tissues were then incubated with secondary anti-rabbit biotinylated (Vector Labs, BA-1000) or anti-rat biotinylated secondary antibody (Vector Labs, BA-4001) for 30 minutes at room temperature. Signal was amplified with avidin/biotin ABC complex (Vector Labs, PK-6102) and stained with DAB substrate chromogen (DAKO, 2016–10). NIS Elements BR 3.0 software was used to capture and analyze the images. Quantification of positive CD8, F4/80, Ly6G, FoxP3, Ki67, and caspase 3 cells were done in Imagescope. Counts are averages of 3 animals per treatment group. Two fields from each section and minimally two sections spaced at least 100 microns apart were averaged for each animal. Tumor area for IbaI and F4/80 staining in untreated aniamls was 4345um × 3260um and for the remainder of the stains 3190um × 1974um.
RNA in situ hybridization
For Chromogenic InSitu Hybridization (CISH) staining fresh slides were sectioned, air-dried, and baked within 48hrs of staining. Staining was performed on a Bond RXm automated staining system (Leica Biosystems). For dual CISH probe staining Mm-Siglech (Advanced Cell Diagnostics, ref#528248) and Mm-Clec12a probes (Advanced Cell Diagnostics, ref#514358-C2) were used along with the RNAscope 2.5 LS Duplex Reagent Kit (Advanced Cell Diagnostics, 32240). Standardized protocols from Advanced Cell Diagnostics were used without modifications. For dual CISH + IHC Mm-Siglech (same as above) or Mm-Clec12a probes (Advanced Cell Diagnostics ref#514358) were used along with IbaI antibody (Wako 019–19741) at a 1:1K dilution with no additional retrieval steps. For the IHC portion, a Bond Refine staining kit (Leica Biosystems, DS9800) was used with a standard protocol minus the peroxide blocking step which was deleted. After staining slides were air-dried, coverslipped, and scanned at 40x magnification with an Aperio CS-O slide scanner (Leica Biosystems). Two methods for quantification were performed. Cells positive for both IbaI and Siglech or Clec12a probe staining were manually counted per field (3190um × 1974um). For quantification of dual Siglech and Clec12a probes, we elected to use ImageJ (Trainable Weka Segmentation Plugin) to quantify pixel size and count as a surrogate for cell count because macrophages and microglia were embedded in a field with tumor cells. The software could only discern nuclei of tumor cells and not the immune cells, thus precluding our ability to accurately count actual probe positive cells without IbaI staining to identify discrete immune cells.
Flow cytometry
Whole cerebellar tissue were homogenized and myelin was removed using myelin removal beads (Miltenyi Biotec, 130–096-733). Samples were incubated for 10 minutes with CD16/32 Fc Block (BD Biosciences, 553142) and stained on ice with primary-fluorophore conjugated antibodies for identification of cell populations by FACS. Flow cytometry was performed on an LSR II Flow Cytometer (BD Biosciences) and analyzed using FlowJo software (Treestar). Antibodies used include the following: CD45 (BioLegend, clone 30-F11), CD11b (BioLegend, clone CBRM1/5), Ly6C (BioLegend, clone HK1.4), Ly6G (BioLegend, 1A8), CD8 (BioLegend, 53.6.7), CD3 (BioLegend, 17A2). Count beads were from ThermoFisher (C36950).
RNA isolation and qPCR analysis for gene for gene expression
CD11b+CD45hiLy6Chi and CD11b+CD45hiLy6Clo cells were sorted on FACSAria Fusion Sorter at the Children’s Hospital of Philadelphia Flow Cytometry Core Laboratories. RNA was isolated using Trizol™ (Thermo Fisher, 15596026). Reverse transcription was performed using High
Capacity RNA to cDNA Kit (Life Technologies). qRT-PCR was performed using ViiA7 Real-Time PCR machine. TaqMan probes used for gene specific amplification (purchased from ThermoFisher Scientific) are listed below: Hprt (Mm03024075_m1), Clec12a (Mm00624579_m1), Clec4a3 (Mm00462705_m1), Ccr2 (Mm04207877_m1), Fcrls (Mm00472833_m1), P2ry12 (Mm00446026_m1), Tmem119 (Mm00525305_m1), Siglech (Mm00618627_m1).
T cell suppression assay
Mouse splenic T cells were isolated from Ptch1+/−Tp53−/− mice using Pan T cell isolation Kit (Miltenyi Biotec). 4 × 10⁴ mouse T cells were labeled with CFSE (Life Technologies, C34554) and cultured for 3 days at 37C with 1ul of αCD3/28 bead (Thermo Fisher Scientific, 11131D) and 15U recombinant human IL-2 (Peprotech, Inc. 200–02). CD11b+CD45hiLy6Chi, CD11b+CD45hiLy6C, and CD11b+CD45lo cells isolated from tumors post-radiation were sorted on FACSAria Fusion Sorter. T cell proliferation was determined by measuring CFSE signal in CD45+CD3+CD8+ cells.
QUANTIFICATION AND STATISTICAL ANALYSIS
Statistical analyses of data were carried out using the unpaired two-tailed Student’s t test for comparison between two experimental groups. Wilcoxon signed-rank test was used in the BRETIGEA human data analysis.
Supplementary Material
KEY RESOURCES TABLE.
| REAGENT or RESOURCE | SOURCE | IDENTIFIER |
|---|---|---|
|
| ||
| Antibodies | ||
|
| ||
| IbaI unconjugated antibody | Wako Chemicals | 019-19741; RRID:AB_839504 |
| F4/80 unconjugated antibody | Thermo Fisher Scientific | MF48000; RRID:AB_10376289 |
| CD8 unconjugated antibody | Abcam | ab203035 |
| Ly6G unconjugated antibody | StemCell Technologies | 60031; RRID:AB_2877150 |
| Caspase 3 unconjugated antibody | R&D Systems | AF835; RRID:AB_2243952 |
| Ki67 unconjugated antibody | Abcam | ab16667; RRID:AB_302459 |
| FoxP3 unconjugated antibody | eBioscience | 14-5773-95; RRID:AB_2865134 |
| Anti-rabbit biotinylated secondary antibody | Vector Labs | BA-1000; RRID:AB_2313606 |
| Anti-rat biotinylated secondary antibody | Vector Labs | BA-4001; RRID:AB_10015300 |
| BV510 CD45 anti-mouse antibody | BioLegend | 103138; RRID:AB_2563061 |
| PE-Cy7 Cd11b anti-mouse antibody | Fisher Scientific | 25-0112-82; RRID:AB_469588 |
| Ly-6C fluorescent AF488 Ly-6C anti-mouse antibody | BioLegend | 128021; RRID:AB_10640820 |
| PerCp/Cy5.5 Ly-6G anti-mouse antibody | BioLegend | 127615; RRID:AB_1877272 |
| AF594 CD8a anti-mouse antibody | BioLegend | 100758; RRID:AB_2563237 |
|
| ||
| Chemicals, peptides, and recombinant proteins | ||
|
| ||
| GDC-0449 | Chemitek | CT-G0449 |
| Methylcellulose | Sigma | M0512 |
| Tween 80 | Sigma | P1754 |
| Isofluorane | Sigma | 792632 |
| Percoll | Sigma | 17-0891-02 |
| CD11b+ magnetic microbeads | Miltenyi Biotec | 130-092-636 |
| CD45+ magnetic microbeads | Miltenyi Biotec | 130-052-301 |
| LS columns | Miltenyi Biotec | 130-042-401 |
| ACK lysing buffer | ThermoFisher | A1049201 |
| Chromium Single Cell 3′ Reagent kit v2 | 10xGenomics | 120234 |
| Chromium i7 Sample Index Kit | 10xGenomics | PN-120262 |
| CFSE | Life Technologies | C34554 |
| Avidin/biotin ABC complex | Vector Labs | PK-6102; RRID:AB_2336821 |
| DAB substrate chromogen | DAKO | SK-4100; RRID:AB_2336382 |
| Mm-Siglech CISH probe | Advanced Cell Diagnostics | ref#432678 |
| Mm-Clec12a CISH probe | Advanced Cell Diagnostics | ref#514358 |
| Mm-Clec12a-C2 CISH probe | Advanced Cell Diagnostics | ref#514358-C2 |
| RNAscope 2.5 LS Duplex Reagent Kit | Advanced Cell Diagnostics | 32240 |
| Bond Refine staining kit | Leica Biosystems | DS9800 |
| Collagenase B, from Clostridium histolyticum | Sigma-Aldrich | 11088815001 |
| DNaseI | Sigma-Aldrich | D4527-200KU |
| CD16/32 Fc Block | BD Biosciences | 553142; RRID:AB_394657 |
| αCD3/28 beads | ThermoFisher Scientific | 11131D |
| Recombinant human IL-2 | Peprotech, Inc. | 200-02 |
| Hprt Taqman Q-PCR probe | ThermoFisher Scientific | Mm03024075_m1 |
| Clec12a Taqman Q-PCR probe | ThermoFisher Scientific | Mm00624579_m1 |
| Clec4a3 Taqman Q-PCR probe | ThermoFisher Scientific | Mm00462705_m1 |
| Ccr2 Taqman Q-PCR probe | ThermoFisher Scientific | Mm04207877_m1 |
| Fcrls Taqman Q-PCR probe | ThermoFisher Scientific | Mm00472833_m1 |
| P2ry12 Taqman Q-PCR probe | ThermoFisher Scientific | Mm00446026_m1 |
| Tmem119 Taqman Q-PCR probe | ThermoFisher Scientific | Mm00525305_m1 |
| Siglech Taqman Q-PCR probe | ThermoFisher Scientific | Mm00618627_m1 |
| CD11b magnetic microbeads, human/mouse | Miltenyi Biotec | 130-093-636 |
| CD45 magnetic microbeads, mouse | Miltenyi Biotec | 130-052-301 |
| LS columns | Miltenyi Biotec | 130-042-401 |
| Myelin Removal Beads II, human, mouse, rat | Miltenyi Biotec | 130-096-733 |
| CountBright Absolute Counting Beads | ThermoFisher Scientific | C36950 |
| Pan T cell isolation kit II | Miltenyi Biotec | 130-095-130 |
|
| ||
| Experimental models: organisms/strains | ||
|
| ||
| Mouse: Ptch+/− | Jackson Laboratory | 030494 |
| Mouse: Ccr2−/− | Jackson Laboratory | 004999 |
| Mouse: Tp53−/− | Jackson Laboratory | 002101 |
|
| ||
| Uploaded data | ||
|
| ||
| Raw and analyzed data | This paper | GEO: GSE166691 |
|
| ||
| Software and algorithms | ||
|
| ||
| Seurat package (v.3.0) | Satija et al., 2015 | https://satijalab.org/seurat/ |
| Monocle2 | Trapnell et al., 2014 | http://cole-trapnell-lab.github.io/monocle-release/ |
| Velocyto | La Manno et al., 2018 | http://velocyto.org/ |
| MCP-Counter | Becht et al., 2016 | https://github.com/ebecht/MCPcounter |
| BRETIGEA | McKenzie et al., 2018 | https://cran.r-project.org/web/packages/BRETIGEA/index.html |
| SingleR | Aran et al., 2019 | https://bioconductor.org/packages/release/bioc/html/SingleR.html |
| FlowJo software | FlowJo™ Software, 2019 | https://www.flowjo.com/solutions/flowjo |
| ImageJ | Schindelin et al., 2012 | https://imagej.nih.gov/ij/ |
| ITK-SNAP | Yushkevich et al., 2006 | http://www.itksnap.org/pmwiki/pmwiki.php |
| xCell | Chen et al., 2018 | https://xcell.ucsf.edu/ |
| CIBERSORT | Aran et al., 2017 | https://cibersort.stanford.edu/ |
Highlights.
Sonic Hedgehog (SHH) subgroup of medulloblastoma (MB) recruits diverse macrophages
Radiation or molecular-targeted therapy alters macrophage distribution in SHH-MB
Radiation recruits immunosuppressive monocyte-derived macrophages (TAMoMacs) in SHH-MB
Radiation-induced TAMoMacs regulate CD8 T cell and neutrophil numbers in SHH-MB
ACKNOWLEDGMENTS
This work was supported by National Institutes of Health NIAID-KO8AI106953, Burroughs Wellcome Fund CAMS award, and American Society of Hematology scholar award (to M.H.); Training Program in Neurodevelopmental Disabilities T32NS007413, Child Neurologist Career Development Training Program 1K12NS098482, Wylie’s Day Foundation, Musella Foundation, and Gray Matters Foundation (to M.T.D.); Alex’s Lemonade Stand Foundation Young Investigator and Catalyst Awards (to J.L.R.); and Alex’s Lemonade Stand Foundation (CCDL). We thank Drs. Weixia Liu and Stephen Pickup for their assistance with MRI, Dr. Khayrullo Shoniyozov and Denisa Goia for their assistance with radiation, Drs. Jay Storm and Adam Resnick for their dedication to the generation of human patient date used in the OpenPBTA project, Dr. Mateusz Koptyra for his helpful suggestions, and Dr. Chi Van Dang for his invaluable insight.
Footnotes
DECLARATION OF INTERESTS
The authors declare no competing interests.
SUPPLEMENTAL INFORMATION
Supplemental information can be found online at https://doi.org/10.1016/j.celrep.2021.108917.
REFERENCES
- Alshetaiwi H, Pervolarakis N, McIntyre LL, Ma D, Nguyen Q, Rath JA, Nee K, Hernandez G, Evans K, Torosian L, et al. (2020). Defining the emergence of myeloid-derived suppressor cells in breast cancer using single-cell transcriptomics. Sci. Immunol. 5, eaay6017. [DOI] [PMC free article] [PubMed] [Google Scholar]
- Aran D, Hu Z, and Butte AJ (2017). xCell: digitally portraying the tissue cellular heterogeneity landscape. Genome Biol. 18, 220. [DOI] [PMC free article] [PubMed] [Google Scholar]
- Aran D, Looney AP, Liu L, Wu E, Fong V, Hsu A, Chak S, Naikawadi RP, Wolters PJ, Abate AR, et al. (2019). Reference-based analysis of lung single-cell sequencing reveals a transitional profibrotic macrophage. Nat. Immunol. 20, 163–172. [DOI] [PMC free article] [PubMed] [Google Scholar]
- Avdic S, Cao JZ, McSharry BP, Clancy LE, Brown R, Steain M, Gottlieb DJ, Abendroth A, and Slobedman B (2013). Human cytomegalovirus interleukin-10 polarizes monocytes toward a deactivated M2c phenotype to repress host immune responses. J. Virol. 87, 10273–10282. [DOI] [PMC free article] [PubMed] [Google Scholar]
- Becht E, Giraldo NA, Lacroix L, Buttard B, Elarouci N, Petitprez F, Selves J, Laurent-Puig P, Sautès-Fridman C, Fridman WH, and de Reyniès A (2016). Estimating the population abundance of tissue-infiltrating immune and stromal cell populations using gene expression. Genome Biol. 17, 218. [DOI] [PMC free article] [PubMed] [Google Scholar]
- Bennett ML, Bennett FC, Liddelow SA, Ajami B, Zamanian JL, Fernhoff NB, Mulinyawe SB, Bohlen CJ, Adil A, Tucker A, et al. (2016). New tools for studying microglia in the mouse and human CNS. Proc. Natl. Acad. Sci. USA 113, E1738–E1746. [DOI] [PMC free article] [PubMed] [Google Scholar]
- Bennett FC, Bennett ML, Yaqoob F, Mulinyawe SB, Grant GA, Hayden Gephart M, Plowey ED, and Barres BA (2018). A Combination of Ontogeny and CNS Environment Establishes Microglial Identity. Neuron 98, 1170–1183.e8. [DOI] [PMC free article] [PubMed] [Google Scholar]
- Binnewies M, Roberts EW, Kersten K, Chan V, Fearon DF, Merad M, Coussens LM, Gabrilovich DI, Ostrand-Rosenberg S, Hedrick CC, et al. (2018). Understanding the tumor immune microenvironment (TIME) for effective therapy. Nat. Med. 24, 541–550. [DOI] [PMC free article] [PubMed] [Google Scholar]
- Boring L, Gosling J, Chensue SW, Kunkel SL, Farese RV Jr., Broxmeyer HE, and Charo IF (1997). Impaired monocyte migration and reduced type 1 (Th1) cytokine responses in C-C chemokine receptor 2 knockout mice. J. Clin. Invest. 100, 2552–2561. [DOI] [PMC free article] [PubMed] [Google Scholar]
- Bouffet E (2021). Management of high-risk medulloblastoma. Neurochirurgie 67, 61–68. [DOI] [PubMed] [Google Scholar]
- Bowman RL, Klemm F, Akkari L, Pyonteck SM, Sevenich L, Quail DF, Dhara S, Simpson K, Gardner EE, Iacobuzio-Donahue CA, et al. (2016). Macrophage Ontogeny Underlies Differences in Tumor-Specific Education in Brain Malignancies. Cell Rep. 17, 2445–2459. [DOI] [PMC free article] [PubMed] [Google Scholar]
- Butler A, Hoffman P, Smibert P, Papalexi E, and Satija R (2018). Integrating single-cell transcriptomic data across different conditions, technologies, and species. Nat. Biotechnol. 36, 411–420. [DOI] [PMC free article] [PubMed] [Google Scholar]
- Butovsky O, Jedrychowski MP, Moore CS, Cialic R, Lanser AJ, Gabriely G, Koeglsperger T, Dake B, Wu PM, Doykan CE, et al. (2014). Identification of a unique TGF-β-dependent molecular and functional signature in microglia. Nat. Neurosci. 17, 131–143. [DOI] [PMC free article] [PubMed] [Google Scholar]
- Cabilly Y, Barbi M, Geva M, Marom L, Chetrit D, Ehrlich M, and Elroy-Stein O (2012). Poor cerebral inflammatory response in eIF2B knock-in mice: implications for the aetiology of vanishing white matter disease. PLoS ONE 7, e46715. [DOI] [PMC free article] [PubMed] [Google Scholar]
- Chen B, Khodadoust MS, Liu CL, Newman AM, and Alizadeh AA (2018). Profiling tumor infiltrating immune cells with CIBERSORT. Methods Mol. Biol. 1711, 243–259. [DOI] [PMC free article] [PubMed] [Google Scholar]
- Chung W, Eum HH, Lee H-O, Lee K-M, Lee H-B, Kim K-T, Ryu HS, Kim S, Lee JE, Park YH, et al. (2017). Single-cell RNA-seq enables comprehensive tumour and immune cell profiling in primary breast cancer. Nat. Commun. 8, 15081. [DOI] [PMC free article] [PubMed] [Google Scholar]
- Crotti A, and Ransohoff RM (2016). Microglial Physiology and Pathophysiology: Insights from Genome-wide Transcriptional Profiling. Immunity 44, 505–515. [DOI] [PubMed] [Google Scholar]
- Dijkgraaf GJP, Alicke B, Weinmann L, Januario T, West K, Modrusan Z, Burdick D, Goldsmith R, Robarge K, Sutherlin D, et al. (2011). Small molecule inhibition of GDC-0449 refractory smoothened mutants and downstream mechanisms of drug resistance. Cancer Res. 71, 435–444. [DOI] [PubMed] [Google Scholar]
- FlowJo™ Software (2019). FlowJo™ Software (for Windows or for Mac) [software application], Version 9 (Becton, Dickinson and Company; ). [Google Scholar]
- La Manno G, Soldatov R, Zeisel A, Braun E, Hochgerner H, Petukhov V, Lidschreiber K, Kastriti ME, Lönnerberg P, Furlan A, et al. (2018). RNA velocity of single cells. Nature 560, 494–498. [DOI] [PMC free article] [PubMed] [Google Scholar]
- Gabrilovich DI, and Nagaraj S (2009). Myeloid-derived suppressor cells as regulators of the immune system. Nat. Rev. Immunol. 9, 162–174. [DOI] [PMC free article] [PubMed] [Google Scholar]
- Gajjar A, Stewart CF, Ellison DW, Kaste S, Kun LE, Packer RJ, Goldman S, Chintagumpala M, Wallace D, Takebe N, et al. (2013). Phase I study of vismodegib in children with recurrent or refractory medulloblastoma: a pediatric brain tumor consortium study. Clin. Cancer Res. 19, 6305–6312. [DOI] [PMC free article] [PubMed] [Google Scholar]
- Ginhoux F, Lim S, Hoeffel G, Low D, and Huber T (2013). Origin and differentiation of microglia. Front. Cell. Neurosci. 7, 45. [DOI] [PMC free article] [PubMed] [Google Scholar]
- Goodrich LV, Milenković L, Higgins KM, and Scott MP (1997). Altered neural cell fates and medulloblastoma in mouse patched mutants. Science 277, 1109–1113. [DOI] [PubMed] [Google Scholar]
- Gordon S, and Plüddemann A (2017). Tissue macrophages: heterogeneity and functions. BMC Biol. 15, 53. [DOI] [PMC free article] [PubMed] [Google Scholar]
- Guadagno E, Presta I, Maisano D, Donato A, Pirrone CK, Cardillo G, Corrado SD, Mignogna C, Mancuso T, Donato G, et al. (2018). Role of Macrophages in Brain Tumor Growth and Progression. Int. J. Mol. Sci. 19, 1005. [DOI] [PMC free article] [PubMed] [Google Scholar]
- Gubin MM, Esaulova E, Ward JP, Malkova ON, Runci D, Wong P, Noguchi T, Arthur CD, Meng W, Alspach E, et al. (2018). High-Dimensional Analysis Delineates Myeloid and Lymphoid Compartment Remodeling during Successful Immune-Checkpoint Cancer Therapy. Cell 175, 1014–1030.e19. [DOI] [PMC free article] [PubMed] [Google Scholar]
- Haage V, Semtner M, Vidal RO, Hernandez DP, Pong WW, Chen Z, Hambardzumyan D, Magrini V, Ly A, Walker J, et al. (2019). Comprehensive gene expression meta-analysis identifies signature genes that distinguish microglia from peripheral monocytes/macrophages in health and glioma. Acta Neuropathol. Commun. 7, 20. [DOI] [PMC free article] [PubMed] [Google Scholar]
- Heng TS, and Painter MW; Immunological Genome Project Consortium (2008). The Immunological Genome Project: networks of gene expression in immune cells. Nat. Immunol. 9, 1091–1094. [DOI] [PubMed] [Google Scholar]
- Hovestadt V, Smith KS, Bihannic L, Filbin MG, Shaw ML, Baumgartner A, DeWitt JC, Groves A, Mayr L, Weisman HR, et al. (2019). Resolving medulloblastoma cellular architecture by single-cell genomics. Nature 572, 74–79. [DOI] [PMC free article] [PubMed] [Google Scholar]
- Konishi H, Kobayashi M, Kunisawa T, Imai K, Sayo A, Malissen B, Crocker PR, Sato K, and Kiyama H (2017). Siglec-H is a microglia-specific marker that discriminates microglia from CNS-associated macrophages and CNS-infiltrating monocytes. Glia 65, 1927–1943. [DOI] [PubMed] [Google Scholar]
- Krasemann S, Madore C, Cialic R, Baufeld C, Calcagno N, El Fatimy R, Beckers L, O’Loughlin E, Xu Y, Fanek Z, et al. (2017). The TREM2-APOE pathway drives the transcriptional phenotype of dysfunctional microglia in neurodegenerative diseases. Immunity 47, 566–581.e9. [DOI] [PMC free article] [PubMed] [Google Scholar]
- Lee C, Lee J, Choi SA, Kim S-K, Wang K-C, Park S-H, Kim SH, Lee JY, and Phi JH (2018). M1 macrophage recruitment correlates with worse outcome in SHH Medulloblastomas. BMC Cancer 18, 535. [DOI] [PMC free article] [PubMed] [Google Scholar]
- Lewis ND, Hill JD, Juchem KW, Stefanopoulos DE, and Modis LK (2014). RNA sequencing of microglia and monocyte-derived macrophages from mice with experimental autoimmune encephalomyelitis illustrates a changing phenotype with disease course. J. Neuroimmunol. 277, 26–38. [DOI] [PubMed] [Google Scholar]
- Li X, Masliah E, Reixach N, and Buxbaum JN (2011). Neuronal production of transthyretin in human and murine Alzheimer’s disease: is it protective? J. Neurosci. 31, 12483–12490. [DOI] [PMC free article] [PubMed] [Google Scholar]
- Li Q, Cheng Z, Zhou L, Darmanis S, Neff NF, Okamoto J, Gulati G, Bennett ML, Sun LO, Clarke LE, et al. (2019). Developmental Heterogeneity of Microglia and Brain Myeloid Cells Revealed by Deep Single-Cell RNA Sequencing. Neuron 101, 207–223.e10. [DOI] [PMC free article] [PubMed] [Google Scholar]
- Liang H, Deng L, Hou Y, Meng X, Huang X, Rao E, Zheng W, Mauceri H, Mack M, Xu M, et al. (2017). Host STING-dependent MDSC mobilization drives extrinsic radiation resistance. Nat. Commun. 8, 1736. [DOI] [PMC free article] [PubMed] [Google Scholar]
- Margol AS, Robison NJ, Gnanachandran J, Hung LT, Kennedy RJ, Vali M, Dhall G, Finlay JL, Erdreich-Epstein A, Krieger MD, et al. (2015). Tumor-associated macrophages in SHH subgroup of medulloblastomas. Clin. Cancer Res. 21, 1457–1465. [DOI] [PMC free article] [PubMed] [Google Scholar]
- Maximov V, Chen Z, Wei Y, Robinson MH, Herting CJ, Shanmugam NS, Rudneva VA, Goldsmith KC, MacDonald TJ, Northcott PA, et al. (2019). Tumour-associated macrophages exhibit anti-tumoural properties in Sonic Hedgehog medulloblastoma. Nat. Commun. 10, 2410. [DOI] [PMC free article] [PubMed] [Google Scholar]
- McKenzie AT, Wang M, Hauberg ME, Fullard JF, Kozlenkov A, Keenan A, Hurd YL, Dracheva S, Casaccia P, Roussos P, and Zhang B (2018). Brain Cell Type Specific Gene Expression and Co-expression Network Architectures. Sci. Rep. 8, 8868. [DOI] [PMC free article] [PubMed] [Google Scholar]
- Melcher V, Graf M, Interlandi M, Moreno N, de Faria FW, Kim SN, Kastrati D, Korbanka S, Alfert A, Gerß J, et al. (2020). Macrophage-tumor cell interaction promotes ATRT progression and chemoresistance. Acta Neuropathol. 139, 913–936. [DOI] [PubMed] [Google Scholar]
- Mittal SK, Cho K-J, Ishido S, and Roche PA (2015). Interleukin 10 (IL-10)-mediated Immunosuppression: MARCH-I INDUCTION REGULATES ANTIGEN PRESENTATION BY MACROPHAGES BUT NOT DENDRITIC CELLS. J. Biol. Chem. 290, 27158–27167. [DOI] [PMC free article] [PubMed] [Google Scholar]
- Müller S, Kohanbash G, Liu SJ, Alvarado B, Carrera D, Bhaduri A, Watchmaker PB, Yagnik G, Di Lullo E, Malatesta M, et al. (2017). Single-cell profiling of human gliomas reveals macrophage ontogeny as a basis for regional differences in macrophage activation in the tumor microenvironment. Genome Biol. 18, 234. [DOI] [PMC free article] [PubMed] [Google Scholar]
- Nywening TM, Belt BA, Cullinan DR, Panni RZ, Han BJ, Sanford DE, Jacobs RC, Ye J, Patel AA, Gillanders WE, et al. (2018). Targeting both tumour-associated CXCR2+ neutrophils and CCR2+ macrophages disrupts myeloid recruitment and improves chemotherapeutic responses in pancreatic ductal adenocarcinoma. Gut 67, 1112–1123. [DOI] [PMC free article] [PubMed] [Google Scholar]
- Olingy CE, Dinh HQ, and Hedrick CC (2019). Monocyte heterogeneity and functions in cancer. J. Leukoc. Biol. 106, 309–322. [DOI] [PMC free article] [PubMed] [Google Scholar]
- Pahler JC, Tazzyman S, Erez N, Chen Y-Y, Murdoch C, Nozawa H, Lewis CE, and Hanahan D (2008). Plasticity in tumor-promoting inflammation: impairment of macrophage recruitment evokes a compensatory neutrophil response. Neoplasia 10, 329–340. [DOI] [PMC free article] [PubMed] [Google Scholar]
- Piccard H, Muschel RJ, and Opdenakker G (2012). On the dual roles and polarized phenotypes of neutrophils in tumor development and progression. Crit. Rev. Oncol. Hematol. 82, 296–309. [DOI] [PubMed] [Google Scholar]
- Powell DR, and Huttenlocher A (2016). Neutrophils in the Tumor Microenvironment. Trends Immunol. 37, 41–52. [DOI] [PMC free article] [PubMed] [Google Scholar]
- Robinson GW, Orr BA, Wu G, Gururangan S, Lin T, Qaddoumi I, Packer RJ, Goldman S, Prados MD, Desjardins A, et al. (2015). Vismodegib Exerts Targeted Efficacy Against Recurrent Sonic Hedgehog-Subgroup Medulloblastoma: Results From Phase II Pediatric Brain Tumor Consortium Studies PBTC-025B and PBTC-032. J. Clin. Oncol 33, 2646–2654. [DOI] [PMC free article] [PubMed] [Google Scholar]
- Robinson GW, Kaste SC, Chemaitilly W, Bowers DC, Laughton S, Smith A, Gottardo NG, Partap S, Bendel A, Wright KD, et al. (2017). Irreversible growth plate fusions in children with medulloblastoma treated with a targeted hedgehog pathway inhibitor. Oncotarget 8, 69295–69302. [DOI] [PMC free article] [PubMed] [Google Scholar]
- Romer JT, Kimura H, Magdaleno S, Sasai K, Fuller C, Baines H, Connelly M, Stewart CF, Gould S, Rubin LL, and Curran T (2004). Suppression of the Shh pathway using a small molecule inhibitor eliminates medulloblastoma in Ptc1(+/−)p53(−/−) mice. Cancer Cell 6, 229–240. [DOI] [PubMed] [Google Scholar]
- Röszer T (2018). Understanding the Biology of Self-Renewing Macrophages. Cells 7, 103. [DOI] [PMC free article] [PubMed] [Google Scholar]
- Ryan SK, Gonzalez MV, Garifallou JP, Bennett FC, Williams KS, Sotuyo NP, Mironets E, Cook K, Hakonarson H, Anderson SA, and Jordan-Sciutto KL (2020). Neuroinflammation and EIF2 Signaling Persist despite Antiretroviral Treatment in an hiPSC Tri-culture Model of HIV Infection. Stem Cell Reports 14, 703–716. [DOI] [PMC free article] [PubMed] [Google Scholar]
- Satija R, Farrell JA, Gennert D, Schier AF, and Regev A (2015). Spatial reconstruction of single-cell gene expression data. Nat. Biotechnol. 33, 495–502. [DOI] [PMC free article] [PubMed] [Google Scholar]
- Sawanobori Y, Ueha S, Kurachi M, Shimaoka T, Talmadge JE, Abe J, Shono Y, Kitabatake M, Kakimi K, Mukaida N, and Matsushima K (2008). Chemokine-mediated rapid turnover of myeloid-derived suppressor cells in tumor-bearing mice. Blood 111, 5457–5466. [DOI] [PubMed] [Google Scholar]
- Schindelin J, Arganda-Carreras I, Frise E, Kaynig V, Longair M, Pietzsch T, Preibisch S, Rueden C, Saalfeld S, Schmid B, et al. (2012). Fiji: an open-source platform for biological-image analysis. Nat. Methods 9, 676–682. [DOI] [PMC free article] [PubMed] [Google Scholar]
- Stuart T, Butler A, Hoffman P, Hafemeister C, Papalexi E, Mauck WM 3rd, Hao Y, Stoeckius M, Smibert P, and Satija R (2019). Comprehensive Integration of Single-Cell Data. Cell 177, 1888–1902.e21. [DOI] [PMC free article] [PubMed] [Google Scholar]
- Takeshima T, Pop LM, Laine A, Iyengar P, Vitetta ES, and Hannan R (2016). Key role for neutrophils in radiation-induced antitumor immune responses: Potentiation with G-CSF. Proc. Natl. Acad. Sci. USA 113, 11300–11305. [DOI] [PMC free article] [PubMed] [Google Scholar]
- Trapnell C, Cacchiarelli D, Grimsby J, Pokharel P, Li S, Morse M, Lennon NJ, Livak KJ, Mikkelsen TS, and Rinn JL (2014). The dynamics and regulators of cell fate decisions are revealed by pseudotemporal ordering of single cells. Nat. Biotechnol. 32, 381–386. [DOI] [PMC free article] [PubMed] [Google Scholar]
- Wetmore C, Eberhart DE, and Curran T (2001). Loss of p53 but not ARF accelerates medulloblastoma in mice heterozygous for patched. Cancer Res. 61, 513–516. [PubMed] [Google Scholar]
- Xia C, Braunstein Z, Toomey AC, Zhong J, and Rao X (2018). S100 Proteins As an Important Regulator of Macrophage Inflammation. Front. Immunol. 8, 1908. [DOI] [PMC free article] [PubMed] [Google Scholar]
- Yushkevich PA, Piven J, Hazlett HC, Smith RG, Ho S, Gee JC, and Gerig G (2006). User-guided 3D active contour segmentation of anatomical structures: significantly improved efficiency and reliability. Neuroimage 31, 1116–1128. [DOI] [PubMed] [Google Scholar]
Associated Data
This section collects any data citations, data availability statements, or supplementary materials included in this article.
Supplementary Materials
Data Availability Statement
The accession number for all new scRNA-Seq data reported in this paper is [GEO: GSE166691].