Abstract
Myeloid cells, specifically microglia and macrophages, are activated in retinal diseases and can improve or worsen retinopathy outcomes based on their inflammatory phenotype. However, assessing the myeloid cell response after retinal injury in mice remains challenging due to the small tissue size and the challenges of distinguishing microglia from infiltrating macrophages. In this protocol paper, we describe a flow cytometry–based protocol to assess retinal microglia/macrophage and their inflammatory phenotype after injury. The protocol is amenable to the incorporation of other markers of interest to other researchers.
Key features
This protocol describes a flow cytometry–based method to analyze the myeloid cell response in retinopathy mouse models.
The protocol can distinguish between microglia- and monocyte-derived macrophages.
It can be modified to incorporate markers of interest.
We show representative results from three different retinopathy models, namely ischemia-reperfusion injury, endotoxin-induced uveitis, and oxygen-induced retinopathy.
Keywords: Retinopathy, Mouse retina, Flow cytometry, Myeloid cells, Microglia, Macrophages
Background
Retinal injury is associated with activation of microglia and infiltration of bone marrow–derived macrophages and other leukocytes. This immune cell accumulation/activation is known to play a vital role in retinal injury progression and repair. While fluorescent immunolabeling coupled with confocal microscopy imaging of retina flatmounts or sections can be used to assess the retinal immune response, it is often limited by the number of antibodies that can be multiplexed, and quantification tends to be tedious and time-consuming due to the need for staining multiple sections. Furthermore, most myeloid cell markers used in imaging studies such as Iba1 and CD68 are expressed by both microglia and macrophages; also, the markers that are thought to be microglia-specific, such as P2RY12 and TMEM119, can be downregulated in activated microglia, thus complicating interpretation of the results (van Wageningen et al., 2019; Honarpisheh et al., 2020). Alternatively, flow cytometry offers a robust quantitative method to analyze immune cell response in retinal injury models. Using flow cytometry, microglia can be distinguished from myeloid leukocytes based on the relative expression of the CD45 marker coupled with the marker CD11b, where microglia are CD11b+/CD45low while myeloid leukocytes are CD11b+/CD45hi. Furthermore, flow cytometers allow for multicolor staining and hence identification of various markers of interest using the same sample. However, conducting flow cytometry on retina tissue is challenging due to the small tissue size and low cell yield. In this methods paper, we describe a step-by-step protocol to obtain high yield of viable cells and analyze different immune cell populations after retina injury. A panel of antibodies is included to identify the immune cell subsets and myeloid cell inflammatory phenotype using proinflammatory (M1-like) marker, CD11c, and the anti-inflammatory (M2-like) marker, CD206. We present representative flow cytometry results from three different retina injury models—retinal ischemia-reperfusion (IR) injury, endotoxin-induced uveitis (EIU), and oxygen-induced retinopathy (OIR)—that model ischemic retinopathy, uveitis, and retinopathy of prematurity, respectively. The IR and EIU are induced in adult mice and represent two different injury modalities, with the latter leading to a stronger immune response. The OIR model assesses the murine pup’s retina response to hypoxia, which involves vascular regression followed by neovascularization.
Materials and reagents
Ketamine 100 mg/mL (Hikma, NDC 0143-9509-01); note that ketamine is a controlled substance and needs a special Drug Enforcement Administration license to be obtained
Xylazine 100 mg/mL (Covertus, catalog number: 1XYL006)
Sodium chloride for injection vial USP (0.9% saline, 50 mL) (Hospira, NDC 0409-4888-06)
Sodium chloride for injection USP IV bag (0.9% saline, 250 mL) (Baxter, NDC 0338-0049-02)
Bovine serum albumin (BSA) (GeminiBio, catalog number: 700-100P)
DNase I (Sigma-Aldrich, catalog number: NC1539905)
Ethylenediaminetetraacetic acid (EDTA), 0.5 M (Thermo Fisher, catalog number: AM9260G)
Dulbecco’s modified Eagle medium (DMEM), high glucose, GlutaMAXTM supplement, pyruvate (Thermo Fisher, catalog number: 10569010)
Fetal bovine serum (FBS) (Thermo Fisher, catalog number: 10438026)
Phosphate buffered saline (PBS, 10×) (Thermo Fisher, catalog number: 70-011-044)
Hank’s balanced salt solution (HBSS) with calcium and magnesium (Thermo Fisher, catalog number: 14025076)
HEPES buffer solution (Millipore Sigma, catalog number 83264)
LiberaseTM (Sigma, catalog number: NC1179175)
Zombie VioletTM Fixable Viability kit (BioLegend, catalog number: 423113)
Jackson Immuno Research Labs normal rat serum (Fisher, catalog number: NC9834724)
RBC lysis buffer for mouse (Thermo Fisher, catalog number: J62150.AK)
FisherbrandTM round-bottom polystyrene test tubes without cap, FACS tubes (Thermo Fisher, catalog number: FB149563A)
Fluorescent conjugated primary antibodies and unconjugated blocking antibodies (CD16/32) (Table 1)
Table 1. Antibody panel used in this protocol.
| Antibody | Conc. | Fluorophore | Clone | Host | Company | Catalog # | Dilution |
|---|---|---|---|---|---|---|---|
| CD11b | 0.2 mg/mL | PerCP | M1/70 | Rat | BioLegend | 101230 | 1:100 |
| CD11c | 0.2 mg/mL | Brilliant Violet 605TM | N418 | Armenian Hamster | BioLegend | 117334 | 1:100 |
| CD206 | 0.5 mg/mL | FITC | C068C2 | Rat | BioLegend | 141704 | 1:100 |
| CD45 | 0.5 mg/mL | Alexa Fluor® 700 | 30-F11 | Rat | BioLegend | 103127 | 1:100 |
| F4/80 | 0.5 mg/mL | PE | C1:A3-1 | Rat | Cedarlane | CL8940PE | 1:100 |
|
Gr-1 (Ly-6G/ Ly-6C) |
0.2 mg/mL | APC | RB6-8C5 | Rat | BD Bioscience | 561083 | 1:100 |
| CD16/CD32 | 0.5 mg/mL | Used as (FC block) | 2.4G2 | Rat | BD Bioscience | 553142 | 1:100 |
Solutions
Anesthesia cocktail (see Recipes)
Digestion buffer (see Recipes)
Flow cytometry staining buffer (FACS/EDTA buffer) (see Recipes)
Recipes
-
Anesthesia cocktail
Mix 2 mL of ketamine (100 mg/mL), 0.2 mL of xylazine (100 mg/mL), and 1.8 mL of 0.9% saline to achieve a final solution of 50 mg ketamine and 5 mg xylazine per 1 mL.
-
Digestion buffer
Supplement HBSS with 5% FBS prepared from frozen stock (triple filtered by the manufacturer through a 0.1 μm filter) and 10 mM HEPES, 0.5 mg/mL of liberase, and 0.1 mg/mL of DNase I. Mix gently for 5 min at 4 °C and keep protected from light until needed. Make sure that the FBS used in the digestion buffer is filtered. If not, filter the entire digestion buffer through a 0.22 μm filter to avoid any cellular aggregation that may occur due to potential debris in the unfiltered FBS.
-
Flow cytometry staining buffer (FACS/EDTA buffer)
Prepare by adding 1 mL of 0.5 M EDTA to 50 mL of 5% BSA in 1× PBS.
Equipment
BD LSRFortessa flow cytometer; analyzes up to 16 colors (BD Biosciences)
Digital Peri-StarTM Pro peristaltic perfusion pump (World Precision Instruments)
Eppendorf benchtop centrifuges (for 2, 15, and 50 mL tubes at room temperature and 4 °C)
Lab ArmorTM 37 °C bead bath (Fisher)
Invitrogen Countess III cell counter and counting chamber slides (Thermo Fisher)
Bench-top vortex (Fisher)
Dissection tools (World Precision Instruments, catalog number: MOUSEKIT)
General lab supplies: tubes, pipettes, tips, etc.
Insulin syringes (U-30, short needle, 30 gauge) for ketamine/xylazine administration (MHC medical)
Surgical blades, No. 10 (Medline, catalog number: MDS15010)
Weighing balance (Jscale, catalog number: CJ-4000)
30 G needle (TURMO, catalog number: NN3025R)
25 G needle (Air-Titn, catalog number: 830003786)
Hemostat (World Precision Instruments, catalog number: 15920)
Styrofoam or wood surgical station
Software
FlowJo (software package for analyzing flow cytometry data), https://www.flowjo.com/
Procedure
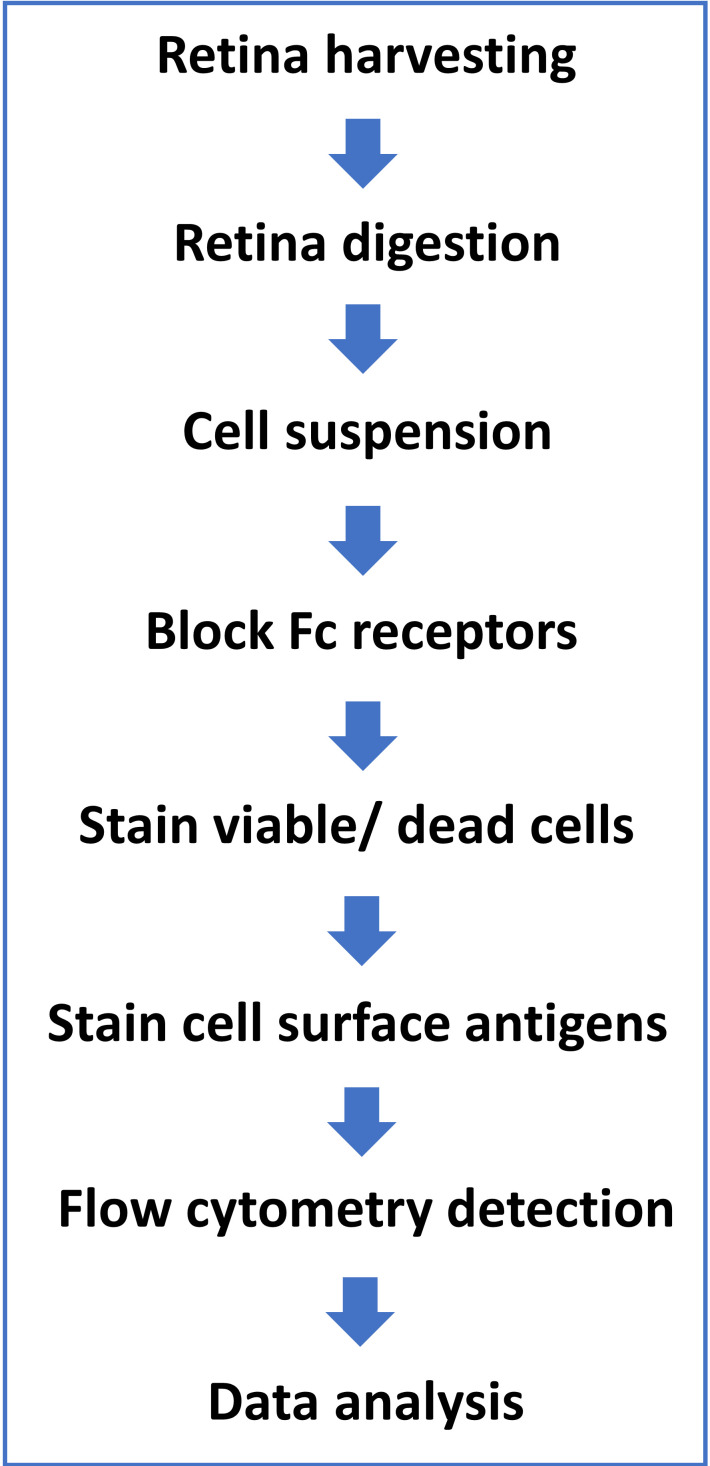
Ethics Statement: all procedures were performed in accordance with the Association for Research in Vision and Ophthalmology (ARVO) and University of Arkansas for Medical Sciences (UAMS) Institutional Animal Care and Use Committee guidelines. A protocol flowchart is provided in Figure 1.
Figure 1. Protocol flowchart.
-
Euthanasia and retina harvesting
Anesthesia: determine the mouse’s body weight to the nearest gram and inject intraperitoneally 40–50 μL of the anesthesia cocktail for a 25 g mouse, for a dose of 80–100 mg/kg ketamine and 5–10 mg/kg xylazine. Wait a few minutes until the mouse is completely anesthetized as measured by loss of response to toe pinch.
-
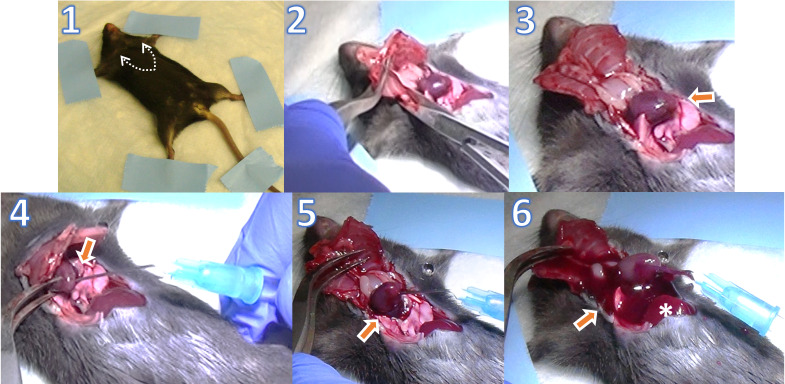
Transcardial perfusion (Figure 2):
Mount the mouse in supine position on Styrofoam or wood surgical station using tape or pins on its four paws.
Expose the xiphoid by making a skin incision on the chest; then, make lateral incisions beneath the ribcage using tissue scissors. Carefully cut through both sides of the rib cage up to the collarbone using tissue scissors.
Pin the sternum up over the head of the mouse with a hemostat. Clear the pericardial sac and any other tissues/organs covering the heart using dissecting forceps to provide a clear view of the heart and vessels.
Make a small incision in the right atrium using iris scissors to create a perfusion outlet. Perform transcardial perfusion using a 25 G needle inserted into the left ventricle with 1× PBS at a constant speed of ~1.5 mL/min using a perfusion pump until the fluid exiting the right atrium is entirely clear. The rate of 1.5 mL/min depends on the pump speed and tube size. It can be adjusted by timing the drip into a 2 mL tube before the experiment and adjusting the pump speed accordingly. It is important that the heart remains beating during the perfusion process to achieve complete perfusion. Inject each mouse with the correct dose of anesthesia cocktail right before perfusion, as giving a high dose or waiting a long time after the cocktail injection may cause the heart to stop and perfusion to fail.
The perfusion step is essential to clear retina vessels from any residual blood, to limit analysis to retinal resident and infiltrating immune cells and exclude cells in the blood circulation.
-
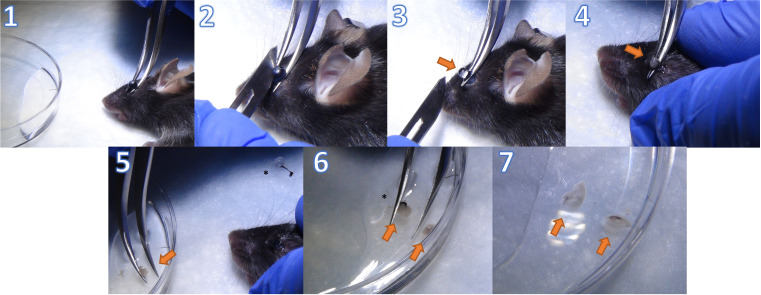
Retina tissue collection (Figure 3):
Put the mouse in prone position.
Place Dumont #7 curved forceps around the rear part of the eyeball close to the optic nerve and apply gentle pressure to protrude the eye.
Make a wide cut in the cornea along the equator using a sharp blade while holding the eyeball with forceps from beneath.
-
Gently remove the lens and vitreous body with the tip of the blade; then, extract the retina from the eyecup by pulling the forceps upwards.
Note that the retina is an off-white translucent tissue. Make sure that the retina is detached from the retinal pigment epithelium by removing any black tissue that comes out with the isolated retina.
Place the retina from both eyes in 2–3 mL of cold HBSS in a 10 mm Petri dish.
-
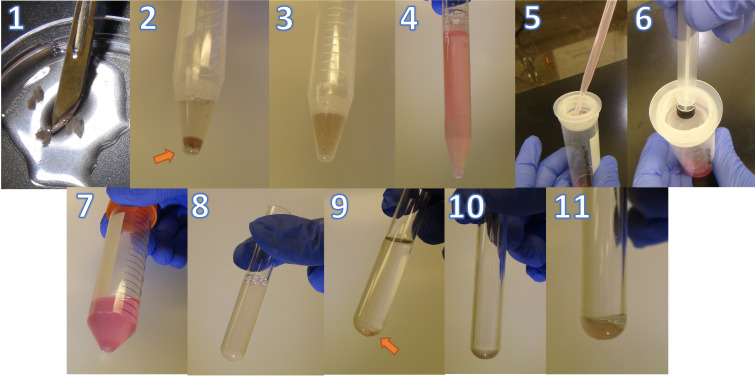
Retina digestion and single-cell suspension (Figure 4)
Use a scalpel to dice the retinas into pieces < 1 mm in HBSS; then, transfer to a 15 mL conical tube and centrifuge at 400× g for 5 min at room temperature.
-
Resuspend the pelleted tissue in a total of 500 μL of digestion buffer.
Note: You can add an additional step to eliminate any red blood cells (RBC) in the samples by incubating the digested tissue in 1 mL of RBC lysis buffer for 5 min at room temperature.
Place the tubes on a rack and place the rack into a 37 °C water (or dry beads) bath for 30 min. Vortex gently every 10 min.
Add 10 mL of DMEM containing 10% FBS to the reaction to inhibit the enzymatic digestion and increase the cell yield.
Gently strain each sample three times through a 40 μm cell strainer and wash the strainer with 1 mL of PBS after each strain. Use the rubber end of a syringe plunger to gently press the samples through the mesh.
Spin down at 400× g for 5 min at 4 °C.
Resuspend the pelleted tissues in 3 mL of PBS and count the cells. One can start by pooling two to four whole retinas per sample and reduce the number in subsequent experiments based on the cell yield.
-
Cells can be counted on an automated cell counter or manually using a hemocytometer under a microscope.
Note: Cell counts are approximately 1.5 × 10⁶ cells per three retinas, which is sufficient for each staining panel/sample. Consider pooling more retinas for fluorescence minus one (FMO) and control samples.
-
Divide the cell samples into the 5 mL FACS test tubes with proper cell number and groups. At least 1.5 million cells per tube are required for further processing. The tube groups should include the following controls along with sample groups: A) negative/unstained cells; B) single stain controls for each color; and C) FMOs for each color. For our antibody panel, we used the following groups: unstained cells, cells + PerCP only, cells + APC only, cells + PE only, cells + FITC only, cells + AF700 only, cells + BV605 only, cells + viability dye only, FITC FMO- cells with all stains except FITC, PE FMO- cells with all stains except PE, APC FMO- cells with all stains except APC, PerCP FMO- cells with all stains except PerCP, AF700 FMO- cells with all stains except AF700, BV605 FMO- cells with all stains except BV605, and viability dye FMO- cells with all stains except viability dye.
Note: Controls are needed to set instrument voltages and compensate the samples, while the FMOs are used to set the positive and negative gates for each color (fluorophore) in the analysis. Controls can be done the first time the samples are run and omitted for subsequent experiments if the same conditions and protocols for tissue lysis and staining are followed.
Spin down at 400× g for 5 min at 4 °C.
Carefully aspirate the supernatant in each tube without disturbing the pellet until approximately 100 μL are remaining. Next, add another 100 μL of PBS and resuspend the pellet immediately to avoid clumping.
Cells are then ready to be stained for flow cytometry. Cells should be protected from light throughout staining and storage.
-
Staining for flow cytometry
-
Stain for viability (live/dead stain) by diluting the fixable Zombie Violet UVTM dye at 1:100–1:1,000 in PBS and resuspend 1.0 × 10⁶ cells in diluted 100 μL of Zombie UVTM solution. Incubate the samples for 30 min on ice in the dark. To minimize background staining of live cells, titrate the volume of dye and/or number of cells per 100 μL for optimal performance.
Note: Titrate the dye volume that will be used in preliminary studies to minimize background staining of live cells.
Wash by adding 2–3 mL of FACS/EDTA buffer and spin down at 400× g for 5 min at 4 °C. Gently aspirate supernatant without disrupting the cell pellet.
Block with 1 μg/mL of Fc block anti-mouse CD16/32 and 20% normal rat serum at a volume of 50 mL of PBS/sample for 10 min at room temperature or 20 min at 4 °C.
Without washing, add the appropriate volume of antibodies for surface staining to evaluate the different cell populations. For this protocol, we used the antibody panel listed in Table 1.
Protect samples from light and incubate them as per the antibody manufacturer’s instructions, which is typically 20 min at 4 °C.
Add 1 mL of FACS/EDTA buffer and spin down at 400× g for 5 min at 4 °C.
Gently aspirate the supernatant.
Resuspend the cell pellet in 300 μL of FACS/EDTA buffer and cover the samples with foil for same-day run on the flow cytometer.
Alternatively, samples can be fixed by resuspending in 0.4% PFA and kept overnight at 4 °C and protected from light for next-day run on the flow cytometer. However, we recommend running the sample immediately after staining to avoid any loss of yield or signal.
-
Figure 2. Transcardial perfusion.
1. Mouse mounted in supine position with arrows indicating the incision line to open the chest cavity. 2. The heart is exposed by making lateral incisions on both sides of the ribcage using tissue scissors. 3. Heart is exposed after clearing the pericardium with the arrow pointing to the apex. It is important that the heart remains beating during the perfusion process to achieve complete perfusion. 4. Insert a 25 G needle connected to the perfusion pump tubing into the left ventricle through the apex of the heart. 5. Make a small incision in the right atrium using iris scissors to create a perfusion outlet. 6. Turn on the perfusion pump to perform transcardial perfusion with 1× PBS at a constant speed of ~1.5 mL/min, until the fluid exiting the right atrium is entirely clear and the liver (denoted by asterisk) becomes pale.
Figure 3. Retina tissue collection.
1. Put the mouse in prone position and hold the eyeball from beneath to cause the eye to protrude. 2. Make a wide cut in the cornea along the equator using a sharp blade while holding the eyeball with the forceps from beneath. 3. Grip the dissected eyeball with forceps to remove the lens and vitreous denoted by arrow. 4. Squeeze the remaining eye cup to extract the retina from the eyeball. 5. Move the retina (off-white translucent tissue) to 2–3 mL of cold HBSS. Asterisk denotes the discarded lens with the vitreous and iris. 6. Remove any remaining retinal pigment epithelium (black tissue, denoted by asterisk). 7. Retinas from both eyes in HBSS are ready for further processing.
Figure 4. Representative images of retina digestion protocol.
1. Diced retinas using a scalpel. 2. Retinas resuspend in digestion buffer. 3. Digested retinas after incubation for 30 min at 37 °C. 4. Digested retinas after adding 10 mL of DMEM + 10% FBS. 5. Straining the suspension through a mesh. 6. Using the rubber end of a syringe plunger to gently press the samples through the mesh. 7. Cell pellet after centrifugation. 8. Cell suspension in a 5 mL FACS tube. 9. Cell pellet after spinning down. 10. Remaining pellet in 100 μL of PBS after aspiration. 11. Resuspended cells ready for staining.
Data analysis
Data analysis, gating strategy, and identification of immune cells subsets
-
Selecting cells and excluding debris
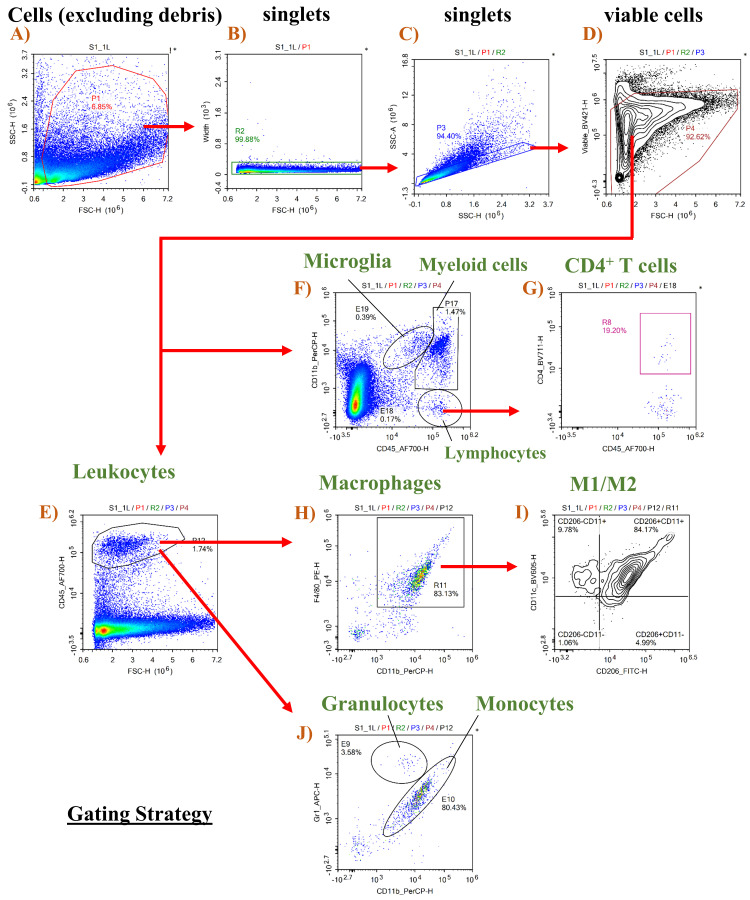
Use Forward versus Side Scatter (FSC vs. SSC) density plot (Figure 5A) to identify the cell population and exclude debris. FSC indicates cell size, while SSC indicates cell complexity or granularity. Cell debris is excluded by creating a gate that excludes the bottom left corner (debris).
-
Selecting singlets and excluding doublets
Use Side Scatter Height versus Side Scatter Area (SSC-H vs. SSC-A) density plot to exclude doublets. A Forward Scatter Height versus Forward Scatter Area (FSC-H vs. FSC-A) plot can also be used (Figure 5B and 5C).
-
Selecting viable cells
This is achieved by using a viability dye vs. FSC-H density plot and excluding cells stained with the dye (Figure 5D).
Note: Viability dyes are impermeable to live cells and therefore stain only dead cells.
-
Identifying populations with specific markers
The general leukocyte marker CD45 is used to identify immune cell populations (Figure 5E). Gating on CD45 and CD11b (myeloid cell marker) is used to distinguish microglia (CD11b+ CD45low), myeloid leukocytes (CD11b+ CD45hi), and lymphocytes (CD11bneg CD45hi), as shown in Figure 5F. T-helper cells can be identified as CD4+ (Figure 5G). Microglia (CD11b+ CD45low) and macrophages (CD45hi CD11b+ F4/80+) can be further characterized as M1-like CD11c+ CD206- and M2-like CD11c- CD206+ cells (Figures 5H, 5I). Monocytes and granulocytes were characterized as CD11b+ Gr-1int. and CD11b+ Gr-1hi, respectively (Figure 5J).
Note: Another approach is to distinguish classical pro-inflammatory monocytes (CD11b+ CD45hi Ly6Chi Ly6Gneg) from non-classical anti-inflammatory monocytes or monocyte-derived macrophages (CD11b+ CD45hi Ly6Cneg Ly6Gneg) using antibodies specific for Ly6C and Ly6G, as described in Abcouwer et al. (2021).
Figure 5. Gating strategy for retinal immune cells.
Gating strategy is shown in various panels, with panels E and F showing the cell population of interest as a percentage of viable cells in panel D, while panels G–J show the cell populations as a percentage of the gated population in the preceding panel.
Validation of protocol
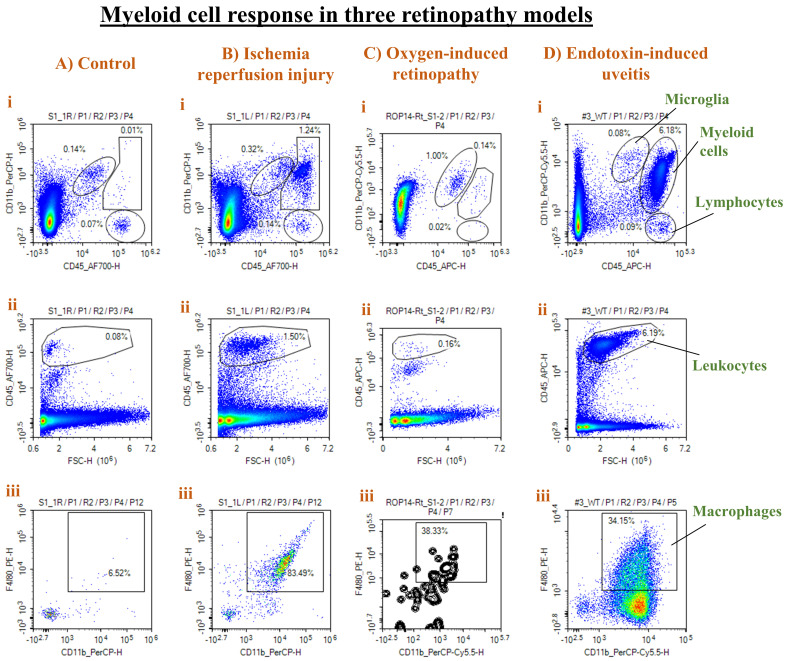
Representative results from different injury models are presented in Figure 6.
Figure 6. Representative results from three different retinal injury models.
Panels from control (A), ischemia-reperfusion (IR) injury (B), oxygen-induced retinopathy (OIR) (C), and endotoxin-induced uveitis (EIU) (D) show density plots of CD11b vs. CD45 to distinguish microglia from myeloid cells and lymphocytes (i), CD45hi leukocytes (ii), and F4/80+ CD11b+ macrophages as a percentage of CD45hi cells (iii). A strong leukocyte and macrophage infiltration was observed in both the IR and EIU models, with a stronger response in the EIU model. On the other hand, the OIR model was associated with more microglial (CD11b+ CD45low) proliferation.
Injury models
Retinal IR injury model was achieved under anesthesia by raising the eye intraocular pressure (IOP) to 110 mm Hg for 60 min unilaterally. The anterior chamber of one eye is cannulated with a 30 G needle attached to a line infusing sterile saline. The IOP is raised to 110 mm Hg to achieve ischemia by elevating the saline reservoir. After 60 min, the needle is withdrawn to allow reperfusion and initiate IR injury.
EIU was induced by intraperitoneal injection of lipopolysaccharide from Salmonella typhimurium (LPS, 4 mg/kg in PBS, Sigma-Aldrich).
OIR model was induced by subjecting 1-week-old mice litters along with their nursing dams to hyperoxia of 75% oxygen in sealed chamber, starting at postnatal day 7 (P7) for five days until P12, and then followed by normoxia or room air. Here in this protocol, we subjected the pups to two days of normoxia (P12–P14).
We used 8–10-week-old male C57BL6J mice for the control, IR-injury, and EIU data, and P14 pups for the OIR model. The IR model was induced as described in Fouda et al. (2018), the EIU was induced as described in Zhang et al. (2009), and OIR was induced as described in Fouda et al. (2022).
Acknowledgments
This work was supported by the following grants from the National Institute of Health (NIH): R01-EY11766 to RBC, and R00 EY029373-03 to AYF. Our protocol is modified/adapted from previously published work by Abcouwer et al. (2021) and O’Koren et al. (2016).
Competing interests
The authors declare no competing interests.
Ethical considerations
All studies were approved by the Augusta University and University of Arkansas for Medical Sciences IACUC committee.
References
- 1.Abcouwer S. F., Shanmugam S., Muthusamy A., Lin C. M., Kong D., Hager H., Liu X. and Antonetti D. A.(2021). Inflammatory resolution and vascular barrier restoration after retinal ischemia reperfusion injury. J Neuroinflammation 18(1): 186. [DOI] [PMC free article] [PubMed] [Google Scholar]
- 2.Fouda A. Y., Xu Z., Suwanpradid J., Rojas M., Shosha E., Lemtalsi T., Patel C., Xing J., Zaidi S. A., Zhi W., et al.(2022). Targeting proliferative retinopathy: Arginase 1 limits vitreoretinal neovascularization and promotes angiogenic repair. Cell Death Dis 13(8): 745. [DOI] [PMC free article] [PubMed] [Google Scholar]
- 3.Fouda A. Y., Xu Z., Shosha E., Lemtalsi T., Chen J., Toque H. A., Tritz R., Cui X., Stansfield B. K., Huo Y., et al.(2018). Arginase 1 promotes retinal neurovascular protection from ischemia through suppression of macrophage inflammatory responses. Cell Death Dis 9(10): 1001. [DOI] [PMC free article] [PubMed] [Google Scholar]
- 4.Honarpisheh P., Lee J., Banerjee A., Blasco-Conesa M. P., Honarpisheh P., J. d’Aigle, Mamun A. A., Ritzel R. M., et al.(2020). Potential caveats of putative microglia-specific markers for assessment of age-related cerebrovascular neuroinflammation. J Neuroinflammation 17(1): 366. [DOI] [PMC free article] [PubMed] [Google Scholar]
- 5. O'Koren EG, Mathew R, Saban DR. Fate mapping reveals that microglia and recruited monocyte-derived macrophages are definitively distinguishable by phenotype in the retina. Sci Rep. 2016;6:20636. [DOI] [PMC free article] [PubMed]
- 6.Van Wageningen T. A., Vlaar E., Kooij G., Jongenelen C. A. M., Geurts J. J. G. and van Dam A. M.(2019). Regulation of microglial TMEM119 and P2RY12 immunoreactivity in multiple sclerosis white and grey matter lesions is dependent on their inflammatory environment. Acta Neuropathol Commun 7(1): 206. [DOI] [PMC free article] [PubMed] [Google Scholar]
- 7.Zhang W., Baban B., Rojas M., Tofigh S., Virmani S. K., Patel C., Behzadian M. A., Romero M. J., Caldwell R. W. and Caldwell R. B.(2009). Arginase activity mediates retinal inflammation in endotoxin-induced uveitis. Am J Pathol 175(2): 891-902. [DOI] [PMC free article] [PubMed] [Google Scholar]


