Abstract
Metformin is used by women during pregnancy to manage diabetes and crosses the placenta, yet its effects on the fetus are unclear. We show that the liver is a site of metformin action in fetal sheep and macaques, given relatively abundant OCT1 transporter expression and hepatic uptake following metformin infusion into fetal sheep. To determine the effects of metformin action, we performed studies in primary hepatocytes from fetal sheep, fetal macaques, and juvenile macaques. Metformin increases AMP-activated protein kinase (AMPK) signaling, decreases mammalian target of rapamycin (mTOR) signaling, and decreases glucose production in fetal and juvenile hepatocytes. Metformin also decreases oxygen consumption in fetal hepatocytes. Unique to fetal hepatocytes, metformin activates stress pathways (e.g., increased PGC1A gene expression, NRF-2 protein abundance, and phosphorylation of eIF2α and CREB proteins) alongside perturbations in hepatokine expression (e.g., increased growth/differentiation factor 15 [GDF15] and fibroblast growth factor 21 [FGF21] expression and decreased insulin-like growth factor 2 [IGF2] expression). Similarly, in liver tissue from sheep fetuses infused with metformin in vivo, AMPK phosphorylation, NRF-2 protein, and PGC1A expression are increased. These results demonstrate disruption of signaling and metabolism, induction of stress, and alterations in hepatokine expression in association with metformin exposure in fetal hepatocytes.
Article Highlights
The major metformin uptake transporter OCT1 is expressed in the fetal liver, and fetal hepatic uptake of metformin is observed in vivo.
Metformin activates AMPK, reduces glucose production, and decreases oxygen consumption in fetal hepatocytes, demonstrating similar effects as in juvenile hepatocytes.
Unique to fetal hepatocytes, metformin activates metabolic stress pathways and alters the expression of secreted growth factors and hepatokines.
Disruption of signaling and metabolism with increased stress pathways and reduced anabolic pathways by metformin in the fetal liver may underlie reduced growth in fetuses exposed to metformin.
Graphical Abstract
Introduction
Metformin is a prevalent oral agent therapy for type 2 diabetes in adults, whose use by women during pregnancy has recently increased (1,2). Importantly, metformin crosses the placenta and equilibrates in fetal circulation (3,4). Fetal exposure to metformin has been considered safe (1,5); however, several studies report reduced birth weight, with an increased associated risk of adverse metabolic outcomes in offspring exposed to metformin (6–13). Specifically, meta-analyses and the Metformin in Women with Type 2 Diabetes study (NCT01353391) identified that neonates exposed to metformin in utero had lower birth weights and higher occurrence of small for gestational age birth weight (7,13). Furthermore, fetuses exposed to metformin from normal-weight mothers are born smaller (10). The association between maternal metformin use and birth weight perturbance extends into childhood, with a paradoxical increase in body weight, adiposity, and metabolic dysfunction observed preadolescence (7–9,11,14). Studies in mice also demonstrate decreased fetal growth and increased adiposity in metformin-exposed offspring (15,16). Collectively, these studies identify previously unrecognized growth and metabolic effects in association with maternal metformin use, emphasizing a critical need for studies to examine the fetal origins of this phenomenon.
Metformin’s mechanism of action as a glycemic agent for treating diabetes is mediated, in part, by reductions in hepatic glucose production (17). Organic cation transporter (OCT) 1 is the major transporter for hepatic metformin uptake (18,19). Metformin’s mechanisms of action in the adult liver include activation of 5′ AMP-activated protein kinase (AMPK) (20), suppression of mitochondrial complex I and ATP production (21,22), decreased hepatic energy state (23), inhibition of cAMP signaling (24), and decreased mitochondrial:cytosolic redox state (25). Little is known about metformin’s effects on fetal cells and tissues. Fetal exposure to metformin at adult doses may have different outcomes, since the fetal liver is metabolically immature with lower antioxidant defenses (26,27). Specifically, hepatic gluconeogenesis is not active until birth because the fetus has a continuous supply of glucose from the mother (28). However, suppression of gluconeogenic substrate flux by metformin may have broader impacts on central carbon metabolism and anabolic pathways (29). Further, fetal sheep with growth restriction have an early activation of hepatic glucose production (30), yet the combined effects of metformin exposure and growth restriction in the setting of premature gluconeogenesis are not known.
In this study, we first evaluated whether the liver is a potential site of metformin action in the fetus. Next, we tested the effects of metformin in primary hepatocytes from unexposed fetal sheep and fetal macaques, with comparisons to juvenile hepatocytes, to explore mechanisms related to fetal growth and metabolism. Finally, we examined the effects in vivo in liver tissue from fetal sheep following fetal infusions of metformin.
Research Design and Methods
Animal Cohorts for Tissue and Cell Studies
Pregnant Columbia-Rambouillet sheep were studied at the University of Colorado, and rhesus and Japanese macaques were studied at the Oregon National Primate Research Center, both accredited by the American Association for the Accreditation of Laboratory Animal Care International. Experiments were conducted following the Animal Research: Reporting of In Vivo Experiments (ARRIVE) guidelines (31). For spatial tissue expression, samples were obtained from fetal sheep (n = 2 with 12 tissues) at 0.9 gestation (day 132 of gestation) and from fetal rhesus macaque (n = 8 with 7 tissues) at 0.65 gestation (day 130 of gestation) (32,33). Primary hepatocytes (described below), preadipocytes, and myocytes were obtained from four other normal fetal sheep. Adipose and muscle tissue precursor cells were isolated from perirenal adipose and biceps femoris tissue, respectively, and collected in growth media in passages 2–4 using established protocols (34,35). For comparisons between fetal and juvenile liver tissue, samples were used from Japanese macaque fetuses at 0.65 gestation (n = 4) and preadolescent rhesus macaque juveniles at 1 or 3 years of age (n = 8) (36,37). Primary hepatocytes were isolated from fetal sheep (n = 9), fetal rhesus macaques (n = 6) (nonhuman primate [NHP]), and juvenile Japanese macaques NHPs (n = 4) as described (30,32,36). Studies were performed in different sets of hepatocytes as stated in the figure legends.
Metformin Fetal Infusion
Surgeries were performed in pregnant sheep (0.9 gestation, n = 4) to place fetal infusion and sampling catheters as described (30,38). Metformin (Sigma no. D1590959) was prepared fresh in saline and infused with 0.2-micron syringe filtering continuously for 48–96 h into a fetal venous (lower inferior vena cava) catheter at 0.5–4.0 mg/h or 0.14–0.58 mg/h/kg adjusted for fetal weight. Fetal arterial (descending aorta) blood samples were obtained before and at the end of the infusion, followed by necropsy and collection of liver, perirenal adipose tissue, and biceps femoris skeletal muscle tissue. Metformin plasma concentrations and tissue content was quantitated with ultraviolet high-performance liquid chromatography using liquid-liquid extraction and internal standards (39). Plasma glucose and lactate and blood oxygen content were measured (38). Measurements in liver tissue samples were compared with samples obtained from age-matched normal fetuses from other studies (38).
Primary Hepatocytes and Metformin Treatment
Fetal sheep hepatocytes were isolated within 1 h of tissue collection. Fetal and juvenile NHP hepatocytes were isolated within 24 h after overnight shipment of a piece of liver tissue perfused with Viaspan solution. We used our established protocols to isolate viable hepatocytes (30,36). Briefly, a piece of the right lobe was perfused with collagenase digestion solution. Dissociated cells were filtered and spun to pellet hepatocytes. Fetal sheep and NHP hepatocytes were plated in DMEM with 1.1 mmol/L glucose and other nutrients representing fetal concentrations as described (30). Postnatal hepatocytes were plated in William’s E media (11 mmol/L glucose, 2 mmol/L glutamine, 0.23 mmol/L pyruvate, 1× penicillin-streptomycin) with 10 nmol/L insulin, 100 mmol/L dexamethasone, and 10% FBS. After attachment, cells were incubated overnight in serum-free media plus 0.2% BSA. The next day, hepatocytes were treated with 0, 250, and 1,000 μmol/L metformin (Sigma no. D150959, prepared in PBS) for 24 h in duplicate wells in serum-free media as described below.
Western Blot Analysis
Samples were lysed using whole cell lysis buffer, and Western blotting was performed (30). Antibodies used and their dilutions are provided in Supplementary Table 1. Protein expression was visualized using IR-Dye IgG secondary antibody (LI-COR) and quantified using Image Studio (LI-COR). Protein loading was verified using Total Protein Stain (LI-COR). Results are expressed as a ratio of phosphorylated to total protein (or Total Protein Stain).
RNA Isolation and Real-Time PCR
RNA was isolated from tissue and cell samples and used for quantitative reverse transcription PCR using previously described methods (30,32). A listing of the genes measured is provided (Supplementary Table 2). Results were normalized to ribosomal protein S15 (RPS15) mRNA expression. Transporter expression is shown relative to expression in the fetal liver and on a log scale to accommodate the range. All results in hepatocytes are expressed relative to the mean of the basal condition.
RNA Sequencing
RNA from fetal sheep hepatocytes incubated with 0 or 1,000 μmol/L metformin was used for RNA sequencing at the University of Colorado Cancer Center’s Genomics and Microarray Core with library preparation, sequencing, and customized pipeline analysis as described (37) Sequences were mapped to the Ovis Aries genome (Oar_v3.1) using gSNAP. Sequences of <40 base pairs were eliminated. Genes were filtered and excluded if the mean fragments per kilobase of transcript per million mapped reads was <5 in both basal and metformin groups and if the difference (delta) in mean values between groups was <5; 6,032 genes met these criteria. Genes were declared differentially expressed when a false discovery rate–adjusted q was <0.05 and the absolute linear fold-change was >1.5. Functional annotation of the differentially expressed genes (DEGs) was performed using Database for Annotation, Visualization, and Integration Discovery (DAVID, version 6.8; https://david.ncifcrf.gov/) to identify Kyoto Encyclopedia of Genes and Genomes (KEGG) pathway term enrichment and in Ingenuity Pathway Analysis (IPA; Qiagen) to identify canonical pathways and putative upstream regulators.
Glucose Production
Hepatocytes were treated in glucose production assay media with 2 mmol/L sodium pyruvate and 20 mmol/L sodium lactate under basal and stimulated conditions using 500 nmol/L dexamethasone and 100 μmol/L db-cAMP for 24 h (30). Results are expressed as milligrams of glucose produced per milligram of protein.
Oxygen Consumption
A mitochondrial stress test assay was performed using the Seahorse XF96 Analyzer according to manufacturer’s recommendations. Three hours prior to the experiment, hepatocytes were incubated with 0, 250, and 1,000 μmol/L metformin in DMEM representing fetal substrates (30,38) with 5 mmol/L glucose, 2 mmol/L lactate, 2 mmol/L glutamine, 1 mmol/L pyruvate, and 1× nonessential amino acids. Oxygen concentration was measured basally and following 2 μmol/L oligomycin, 1 μmol/L carbonyl cyanide 4-(trifluoromethoxy)phenylhydrazone, and 5 μmol/L Rotenone with 10 μmol/L Antimycin A injections. Oxygen consumption rates were normalized to cellular density per well determined using sulforhodamine B (40).
Thiobarbituric Acid-Reactive Substances
Thiobarbituric acid-reactive substances (TBARS) were measured in protein lysates obtained from fetal sheep hepatocyte glucose production assay (32).
Statistical Analyses
Data were analyzed as a one-way ANOVA (GraphPad Prism version 7) with adjustments for unequal variance (Friedman test) when appropriate. Posttest comparisons for 250 and 1,000 μmol/L metformin compared with basal were performed using Fisher least significant difference test. For glucose production and oxygen consumption, differences between groups are denoted with different letters. Samples from pre– and post–metformin infusion were analyzed by paired t test. Means ± SE are shown. Significance was considered when P ≤ 0.05.
Data and Resource Availability
RNA-sequencing (RNA-seq) data are available within National Center for Biotechnology Information’s Gene Expression Omnibus (GSE224387, https://www.ncbi.nlm.nih.gov/geo/query/acc.cgi?acc=GSE224387). Other data generated or analyzed during this study are included in the published article (and its Supplementary Material).
Results
Metformin Transporter Expression
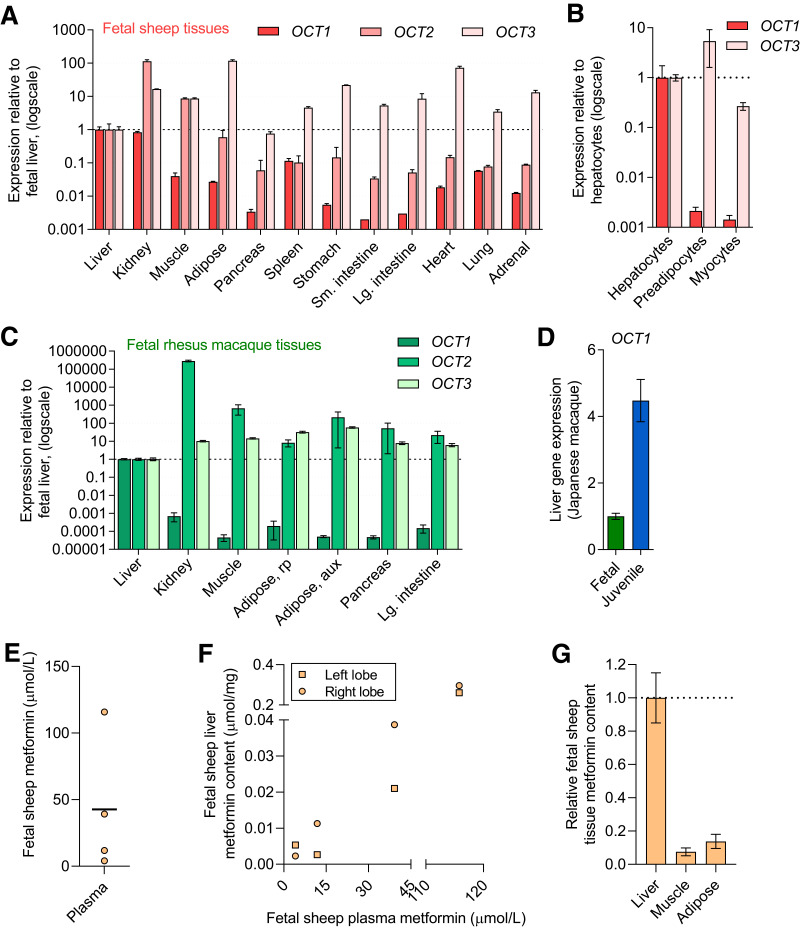
The major transporters for metformin uptake are encoded by OCT1, OCT2, and OCT3 genes (18,19). In fetal sheep tissues, OCT1 was expressed at relatively higher levels in the liver and kidney (>25-fold) compared with other tissues (Fig. 1A). Expression of OCT2 was highest in the kidney, followed by skeletal muscle and liver. OCT3 expression was higher across nearly all tissues examined compared with the liver. In primary cells from fetal sheep, OCT1 expression was nearly 500-fold higher in hepatocytes compared with preadipocytes and myocytes. OCT2 expression was below the limit of detection, and OCT3 expression was similar between the cell types (within 10-fold relative magnitude) (Fig. 1B). Similar results were seen in NHP fetal tissues, with OCT1 being highest in liver tissue and OCT2 and OCT3 being more broadly expressed across tissues (Fig. 1C). While OCT1 expression in fetal hepatic tissue was lower compared with juvenile hepatic tissue, the relative magnitude was similar (Fig. 1D). Multidrug and toxin extrusion protein (MATE) 1 and 2 are additional transporters involved in metformin release and excretion. In fetal sheep tissue, expression of MATE1 and MATE2 was higher in liver and kidney compared with other tissues (Supplementary Fig. 1A). In fetal NHP tissues, MATE2 was highest in the kidney and MATE1 was high in the kidney and liver (Supplementary Fig. 1B). To assess, relative expression among the transporters, the average crossing point value for fetal liver tissue expression for each transporter is shown in Supplementary Table 3.
Figure 1.
Expression of metformin transporters and metformin uptake in fetal tissue. OCT1, OCT2, and OCT3 gene expression in fetal sheep tissue (tissues from two fetuses) (A) and primary cells (from four fetuses) (B). OCT1, OCT2, and OCT3 gene expression in fetal primate (rhesus macaque) tissue (from eight fetuses) (C). OCT1 expression in fetal (n = 4, Japanese macaque) compared with juvenile primate (n = 8, Japanese macaque) liver tissue (D). Results for each transporter are shown relative to expression in the liver or hepatocyte and on a log scale. Metformin plasma concentrations (mean and individual values) in fetal sheep following metformin infusion (n = 4) (E). Relationship between metformin concentration in plasma and liver following metformin infusion in fetal sheep (F). Relative metformin content in fetal sheep tissue following metformin infusion (G). Means ± SE are shown.
Metformin Uptake in Fetal Tissue
Metformin infusion at 0.14–0.58 mg/h/kg for 48–96 h in fetal sheep produced metformin plasma concentrations from ∼5 to 120 μmol/L (Fig. 1E), achieving clinically relevant concentrations (17,41). In liver tissue from both right and left liver lobes, metformin content ranged from ∼0.002 to 0.2 μmol/mg and paralleled plasma metformin concentrations (Fig. 1F). Metformin content in muscle and adipose tissues was at ∼10% of metformin content relative to the liver (Fig. 1G).
AMPK and mTOR Signaling in Metformin-Exposed Fetal Hepatocytes
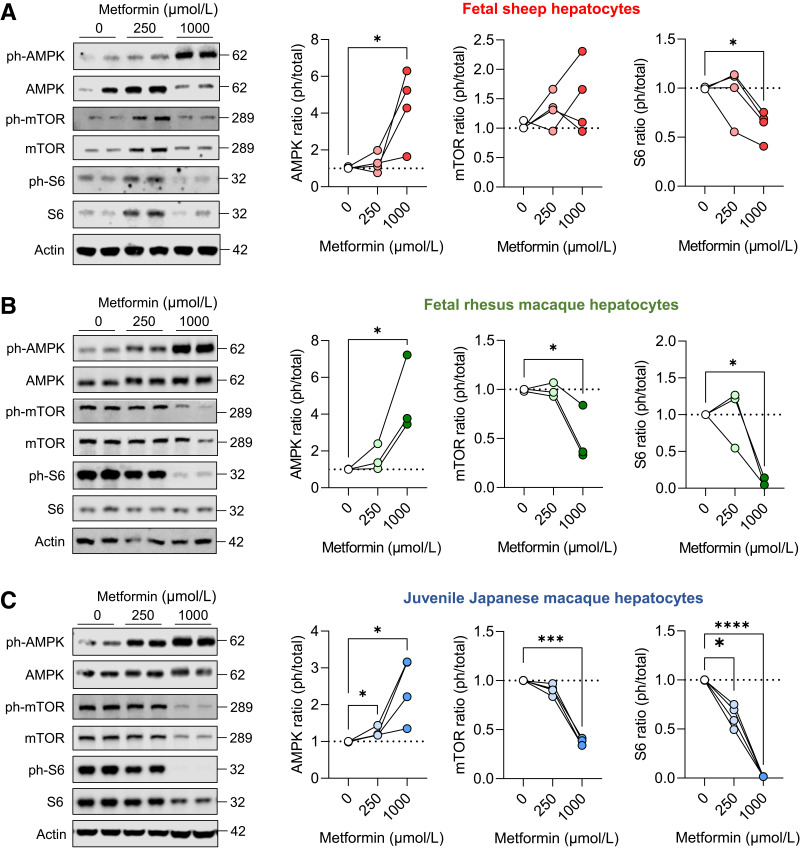
In primary hepatocytes, 250- and 1,000-μmol/L metformin doses were used to test metformin exposure representing metformin accumulation in liver tissue (19,42,43). Metformin exposure increased phosphorylation of AMPK in both fetal sheep and NHP hepatocytes (Fig. 2A and B). Metformin exposure decreased phosphorylation of mTOR in hepatocytes from fetal NHP, but not fetal sheep. Despite these inconsistencies, metformin decreased phosphorylation of S6, a target of mTOR complex 1 in both fetal sheep and NHP hepatocytes. Similar experiments were performed in juvenile NHP hepatocytes, and metformin robustly increased AMPK phosphorylation and decreased mTOR and S6 phosphorylation (Fig. 2C).
Figure 2.
Metformin activates AMPK and suppresses mTOR signaling in fetal and juvenile hepatocytes. Hepatocytes were treated with 0, 250, or 1,000 μmol/L metformin for 24 h, and AMPK (T172), mTOR (Y2448), and S6 (S235/6) protein phosphorylation and total abundance were measured using Western blot analysis in primary hepatocytes collected from fetal sheep (A), fetal rhesus macaque (B), and juvenile Japanese macaque (C). Representative Western blot images of duplicate treatments are shown for hepatocytes from one animal. Each experiment was performed in hepatocytes isolated from three or four different animals, as indicated by connected lines and dots representing the mean of treatment duplicates within a set of hepatocytes expressed relative to the basal treatment within each set of hepatocytes. Protein molecular weights are indicated. Actin protein expression is shown to demonstrate equality of loading (see quantification in Supplementary Fig. 2). Means ± SE are shown. *P < 0.05 compared with basal.
Metformin Lowered Glucose Production and Oxygen Consumption in Fetal Hepatocytes
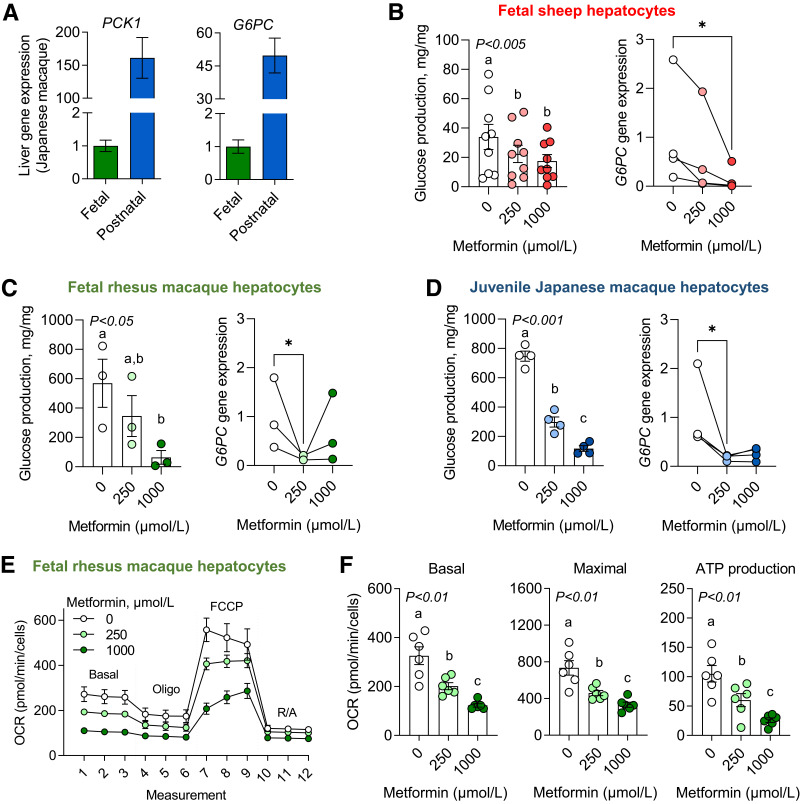
Expression of the major gluconeogenic genes phosphoenolpyruvate carboxykinase 1 (PCK1) and glucose-6-phosphatase, catalytic subunit (G6PC) were ∼150- and 50-fold higher in juvenile compared with fetal NHP liver tissue (Fig. 3A). Despite lower gluconeogenic gene expression in fetal liver tissue, isolated fetal sheep and NHP hepatocytes produced glucose in vitro with production rates ∼10-fold higher in NHP compared with sheep fetal hepatocytes (Fig. 3B and C). Metformin dose-dependently suppressed glucose production (Fig. 3B and C). Metformin also decreased glucose production rates under stimulated conditions in the presence of dexamethasone and cAMP (Supplementary Fig. 3). Expression of G6PC dose-dependently decreased with metformin under basal and stimulated conditions in fetal sheep hepatocytes (Fig. 3B) and with 250 μmol/L metformin in fetal NHP hepatocytes (Fig. 3C). Metformin did not suppress PCK1 expression in either fetal sheep or NHP hepatocytes at 250 μmol/L and actually increased PCK1 with the 1,000-μmol/L dose in fetal sheep hepatocytes (Supplementary Fig. 3). In juvenile NHP hepatocytes, metformin robustly suppressed glucose production rates and G6PC, but not PCK1, expression (Fig. 3D and Supplementary Fig. 3).
Figure 3.
Glucose production and oxygen consumption in metformin-exposed fetal and juvenile hepatocytes. Expression of major gluconeogenic genes, PCK1 and G6PC, in fetal (n = 4) and postnatal (n = 8) Japanese macaque liver tissue (A). Glucose production was measured in the presence of substrates (lactate, pyruvate) and in response to metformin at 0-, 250-, and 1,000-μmol/L doses in fetal sheep (n = 9 hepatocyte preparations) (B), fetal rhesus macaque (n = 3) (C), and juvenile Japanese macaque (n = 4) (D) hepatocytes. G6PC gene expression was also measured in hepatocytes that were treated with 0, 250, and 1,000 μmol//L metformin for 24 h (n = 3 or 4, as shown). A mitochondrial stress test was performed, and oxygen consumption rates (OCR) were measured by Seahorse XF analysis using concentrations of 2 μmol/L oligomycin, 1 μmol/L FCCP, and 5 μmol/L rotenone with 10 μmol/L antimycin A in fetal rhesus macaque hepatocytes (E). Basal and maximal OCR and ATP production were measured in response to metformin exposure (n = 6) (F). Each experiment was performed in three to nine sets of hepatocytes isolated from different animals. For gene expression, the connected lines and dots represent the mean of treatment duplicates within a set of hepatocytes (from one animal), and results are relative to the average of the basal treatment across all sets of hepatocytes. Means ± SE are shown. *P < 0.05 compared with basal.
A mitochondrial stress test was performed to measure oxygen consumption in fetal NHP hepatocytes (Fig. 3E). Metformin dose-dependently decreased basal and maximal mitochondrial respiration in fetal NHP hepatocytes (Fig. 3F). Metformin also dose-dependently decreased ATP production. In fetal sheep hepatocytes, oxygen consumption was not measured; however, metformin treatment decreased carnitine palmitoyltransferase 1A (CPT1A) expression, consistent with a suppressive effect on substrate oxidation (Supplementary Fig. 4A). Metformin treatment was not accompanied by increased lactate dehydrogenase-A (LDHA) expression or TBARS (Supplementary Fig. 4B–D).
Global Transcriptomics in Fetal Hepatocytes Exposed to Metformin
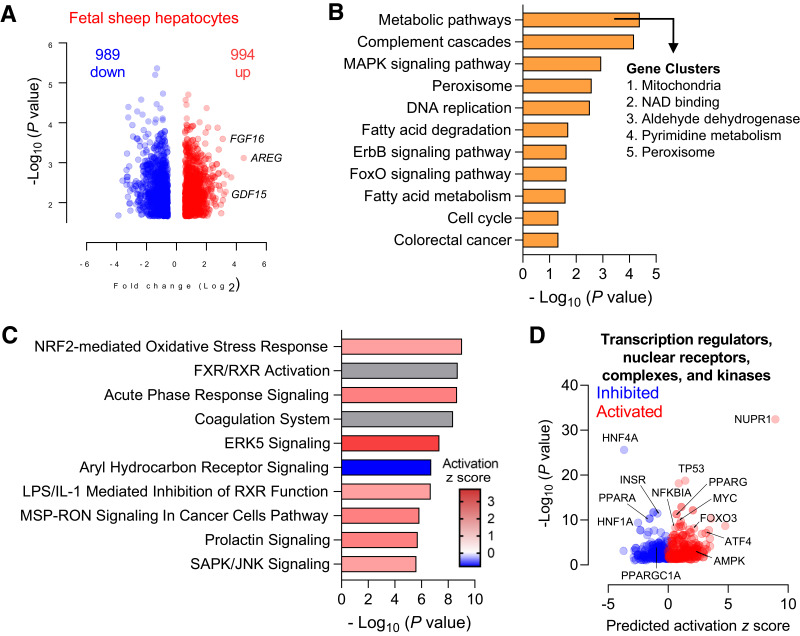
To determine putative mechanisms of action and other pathways affected in fetal sheep hepatocytes, we used unbiased RNA-seq in hepatocytes exposed to maximal doses of metformin (1,000 μmol/L) (44). Volcano plot analysis showed 989 upregulated and 954 downregulated genes (Fig. 4A and Supplementary Table 4). KEGG pathway analysis revealed that the top pathway term enriched in these DEGs was “metabolic pathways” (Fig. 4B). The 225 DEGs associated with this term are involved in mitochondrial function, NAD+ binding, dehydrogenase activity, pyrimidine metabolism, and peroxisome function (Fig. 4B and Supplementary Table 5). Other KEGG terms associated with metformin-regulated DEGs include complement cascades, DNA replication, fatty acid degradation/metabolism, cell cycle, cancer metabolism, and MAPK, ErbB, and FOXO signaling pathways (Fig. 4B). Canonical pathway analysis of DEGs showed enrichment of pathways related to oxidative stress (Supplementary Table 6), FXR/RXR activation, acute phase response signaling, coagulation, ERK5 signaling, aryl hydrocarbon signaling, inhibition of RXR function, MSP-RON signaling, prolactin signaling, and SAPK/JNK signaling (Fig. 4C). We next looked at the predicted upstream regulators in our DEGs. Factors related to the regulation of metabolism and oxidative stress are indicated (Fig. 4D).
Figure 4.
Global transcriptomics in fetal hepatocytes exposed to metformin. Fetal sheep hepatocytes were incubated with 0 μmol/L metformin (basal) or 1,000 μmol/L metformin for 24 h (n = 4). Volcano plot analysis with a false discovery rate–adjusted q value of <0.05 and absolute fold change of >1.5 (A). KEGG analysis of pathways enriched in the set of DEGs following treatment with metformin was performed using DAVID. Gene clusters within the “metabolic pathway” term were identified using the cluster analysis tool for functional annotation terms in DAVID (B). Canonical pathway enrichment of the DEGs was performed using IPA (C). Volcano plot of predicted upstream regulators from IPA with predicted activation z score and P value indicated. Relevant factors are indicated as shown (D).
Metformin Induced Stress Response in Fetal Hepatocytes
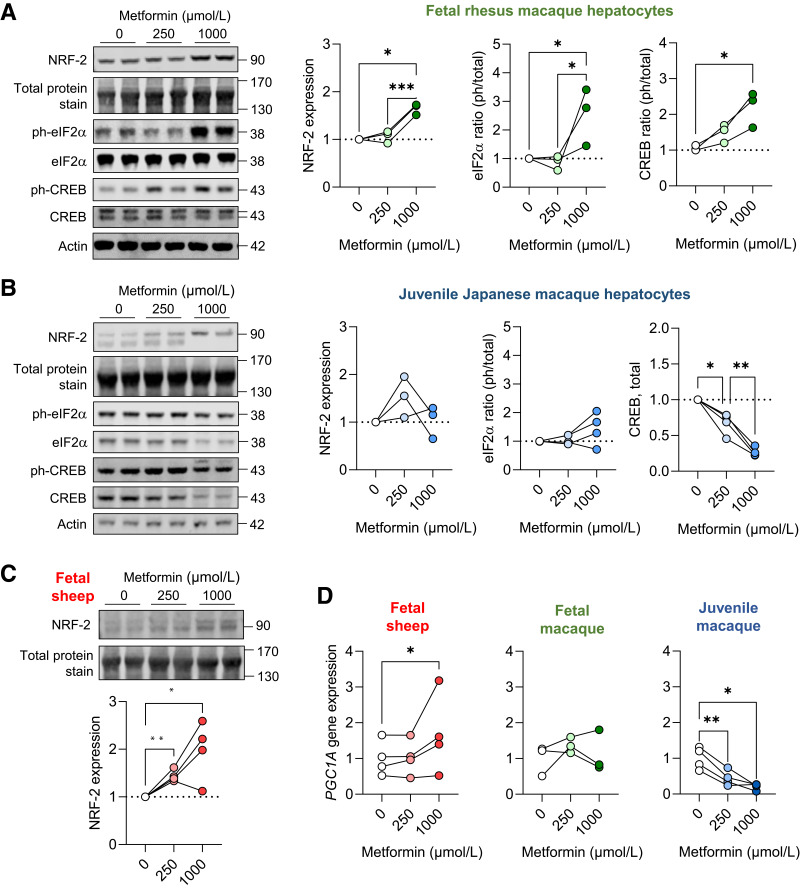
In fetal NHP and sheep hepatocytes, metformin treatment increased protein abundance of nuclear factor erythroid 2–related factor (NRF-2), an oxidative stress-regulated transcription factor (Fig. 5A and C). In juvenile NHP hepatocytes, there was no difference in NRF-2 protein abundance as measured by the sum of the doublet protein bands at ∼90 kDa, yet a visible shift in abundance of the higher molecular weight band was detected (Fig. 5B). Metformin exposure robustly increased phosphorylation of eukaryotic initiation factor 2a (eIF2α), a stress-related protein, in fetal NHP hepatocytes (Fig. 5A), but this effect was not found in juvenile NHP hepatocytes (Fig. 5B). In fetal NHP hepatocytes, metformin exposure increased phosphorylation of cAMP response element-binding protein (CREB) protein (Fig. 5A). In juvenile NHP hepatocytes, metformin exposure decreased total protein abundance of CREB (Fig. 5B) with no change in phosphorylated protein abundance (Supplementary Fig. 5). Further, in fetal sheep and NHP hepatocytes, metformin exposure either increased or did not change peroxisome proliferator-activated receptor γ coactivator 1-α (PGC1A) expression; yet, in juvenile hepatocytes, metformin robustly suppressed expression (Fig. 5D). This stress pathway activation with metformin treatment occurred without differences in expression of apoptosis genes or cellularity measures in fetal sheep and macaque hepatocytes (Supplementary Fig. 6A–C). Interestingly, metformin dose-dependently decreased cellularity measures in juvenile hepatocytes (Supplementary Fig. 6D).
Figure 5.
Metabolic and oxidative stress in fetal and juvenile hepatocytes. Protein abundance of NRF-2 and phospho-eIF2α (S51) and phospho-CREB (S133) and total protein abundance of eIF2α and CREB in fetal rhesus macaque (A) and juvenile (B) Japanese macaque hepatocytes exposed to metformin at 0-, 250-, and 1,000-μmol/L doses for 24 h. Protein abundance of NRF-2 in fetal sheep hepatocytes (C). Representative Western blot images are shown. Ratios of phosphorylated to total protein are shown for eIF2α and CREB, except for total CREB abundance in juvenile hepatocytes. Results are expressed relative to basal (0 μmol/L metformin) levels (n = 3–4). Protein molecular weights are indicated. Actin protein expression and a section of blot showing total protein staining between 130 and 170 kDa is shown to demonstrate equality of loading (see quantification in Supplementary Fig. 2). Gene expression of PGC1A in fetal sheep, fetal rhesus macaque, and juvenile Japanese macaque hepatocytes (D). Each experiment was performed in three or four sets of hepatocytes isolated from different animals. The connected lines and dots represent the mean of treatment duplicates within a set of hepatocytes. Protein abundance results are relative to the average of the basal treatment within each set of hepatocytes. Gene expression results are relative to the average of the basal treatment across all sets of hepatocytes. Means ± SE are shown. *P < 0.05, **P < 0.01, and ***P < 0.001 compared with basal.
Hepatokine Profile in Metformin-Exposed Hepatocytes
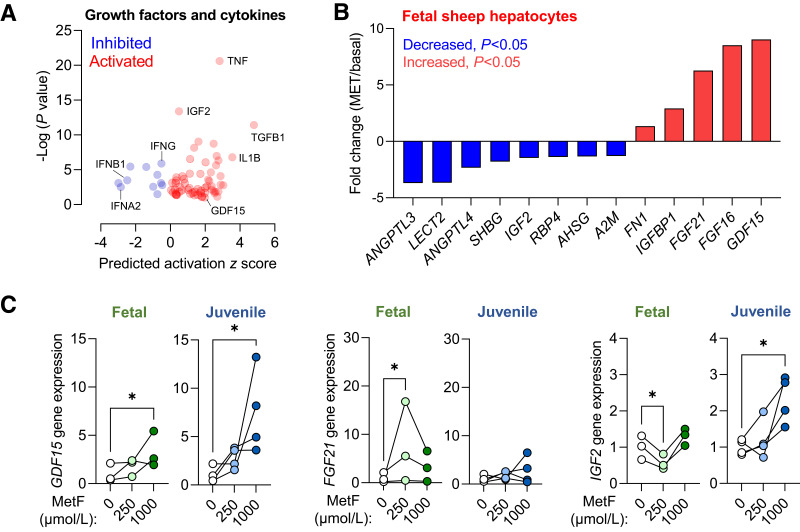
We also identified putative growth factors and cytokines regulated by metformin exposure (Fig. 6A). Among the DEGs in fetal sheep hepatocytes, we identified eight downregulated and five upregulated genes encoding hepatokines (Fig. 6B). In fetal NHP hepatocytes, we confirmed that metformin exposure increased growth/differentiation factor 15 (GDF15) and fibroblast growth factor 21 (FGF21) and decreased insulin-like growth factor 2 (IGF2) expression (Fig. 6C). In contrast, in juvenile NHP hepatocytes, metformin increased GDF15 expression but had no effect on FGF21 and increased insulin-like growth factor 2 (IGF2) expression (Fig. 6C).
Figure 6.
Hepatokine and growth factor expression following metformin exposure. Volcano plot of predicted upstream cytokines and growth factors from IPA with predicted activation z score and P value indicated (A). Relative expression fold-change (metformin exposed versus basal) for selected hepatokines that were differentially expressed in RNA-seq data set (B). Validation of GDF15, FGF21, and IGF2 gene expression in fetal rhesus macaque and juvenile Japanese macaque hepatocytes exposed to metformin at 0-, 250-, and 1,000-μmol/L doses for 24 h (C). Each experiment was performed in three or four sets of hepatocytes isolated from different animals. The connected lines and dots represent the means of treatment duplicates within a set of hepatocytes. Gene expression results are relative to the average of the basal treatment across all sets of hepatocytes. Means ± SE are shown. *P < 0.05 compared with basal.
Hepatic Signaling and Metabolic Effects in Fetal Sheep Infused With Metformin
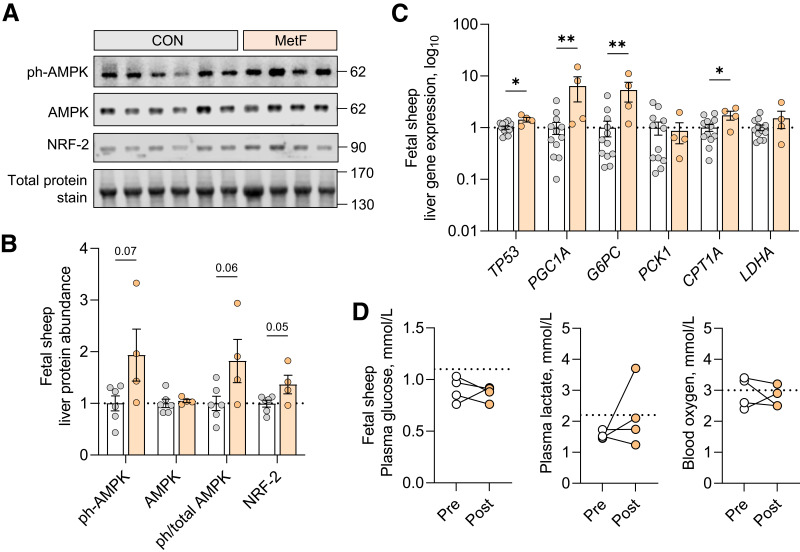
In the fetal sheep liver samples obtained following fetal infusion of metformin (MetF) (see Fig. 1E), protein phosphorylation of AMPK tended to be higher (P = 0.06) and abundance of NRF-2 was higher compared with samples from fetuses not receiving metformin (Fig. 7A and B). Gene expression of P53 and PGC1A were both higher, consistent with results in fetal hepatocytes (Fig. 7C). Unexpectedly, expression of G6PC and CPT1A was increased in MetF fetuses. There was no change in PCK1 or LDHA expression. In addition, there was no difference in expression of hepatokines and cytokines or mTOR and S6 phosphorylation (Supplementary Fig. 7). Phosphorylation of eIF2α and CREB was not detected. Fetal arterial glucose, lactate, and oxygen concentrations were not different in MetF fetuses following metformin infusion (Fig. 7D).
Figure 7.
Fetal hepatic response to fetal metformin infusion. Liver tissue from fetal sheep receiving metformin infusions (MetF, n = 4, colored bars) was compared with samples from fetal sheep without infusions (CON, n = 6–12, as shown, white bars). AMPK protein phosphorylation (T172) and total abundance of AMPK and NRF-2 was measured using Western blot analysis. Western blot images are shown. To demonstrate equality of loading, a section of blot showing total protein staining between 130 and 170 kDa is shown (A). Quantification of protein abundance and ratios of phosphorylated to total protein for AMPK are shown (B). Expression of regulatory and metabolic genes was measured (C). Plasma glucose, plasma lactate, and blood oxygen content were measured before (open circles) and at the end of (filled circles) metformin infusion, with connected lines representing samples from the same fetus. Dashed lines represent values expected from normal fetal sheep as reported (30,32,38) (D). Means ± SE are shown. *P < 0.05 and **P < 0.01 in MetF compared with CON.
Discussion
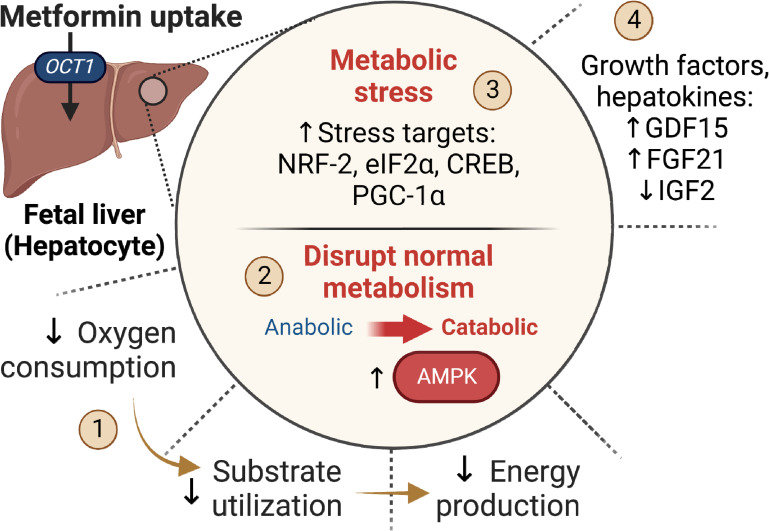
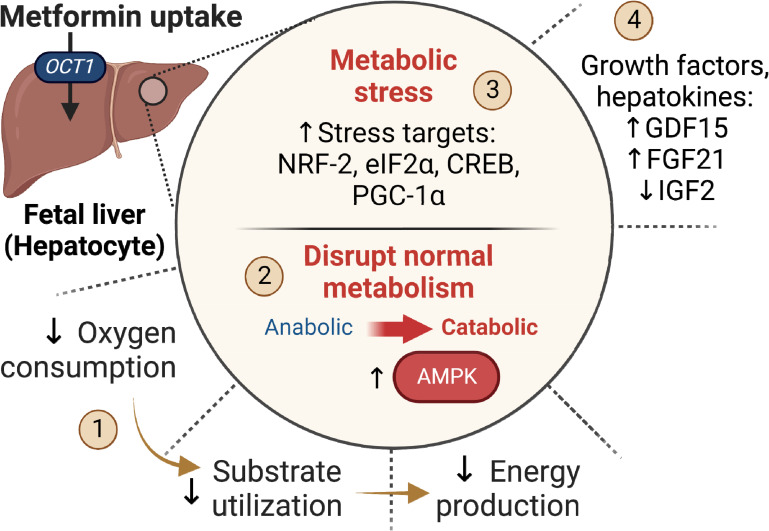
We show that metformin exposure in primary fetal sheep and macaque hepatocytes and in vivo fetal infusion of metformin in fetal sheep is associated with disruption of signaling and metabolic pathways. In fetal hepatocytes, metformin activates AMPK, inhibits mTOR, and suppresses glucose production and oxygen consumption, all effects that are observed in juveniles and well described in adults (17). Distinctly, in fetal hepatocytes, we identify an effect of metformin on the induction of metabolic stress pathways and synthesis of secreted growth factors and hepatokines. Furthermore, infusion of metformin in fetal sheep increases AMPK phosphorylation, NRF-2 protein abundance, and PGC1A expression supporting signaling and stress activation in vivo. Identification of these signaling and metabolic responses fills critical gaps in our understanding of putative mechanisms (Fig. 8) for reduced fetal growth during intrauterine metformin exposure.
Figure 8.
Summary of the effects of metformin on the fetal liver. The fetal liver has abundant OCT1 uptake transporter expression and metformin uptake in vivo. In the fetal hepatocyte, metformin (1) suppresses oxygen consumption and energy production (2). Metformin activates AMPK, which disrupts metabolism and causes a shift from anabolic to catabolic pathways (3). Metformin induces activation of stress pathways including NRF-2, eIF2α, CREB, and PGC-1α (4). Metformin alters the synthesis of secreted factors (hepatokines).
Hepatic expression of uptake transporter OCT1 and hepatic uptake of metformin are required for metformin’s efficacy in adults with diabetes (18,19). We show that expression of OCT1 was relatively similar between fetal and juvenile liver tissue, and that fetal hepatic uptake of metformin is observed in vivo, providing evidence that the fetal liver is a target for metformin activity. Other transporters such as OCT2, OCT3, MATE1, and MATE2 also regulate metformin transport (41). Expression of OCT2 and OCT3 is abundant in fetal adipose and muscle tissue, and OCT3 is abundant in preadipocyte and myocyte precursor cell populations. However, the metformin transport capacity of these receptors is not clear (17,18,41), consistent with the low metformin content we observe in fetal muscle and adipose tissue following metformin infusion. Fetal accumulation of metformin after maternal administration in blood and placenta, liver, and kidney with detectable expression of several transporters has been shown in mice (45). Our results extend these transporter expression measurements across a broader set of fetal tissues in two large animal models and confirm in vivo fetal hepatic metformin uptake in the sheep model.
We identify a novel effect of metformin exposure on metabolic and oxidative stress pathways in fetal hepatocytes using unbiased transcriptomics. We confirm higher NRF-2 protein abundance in fetal hepatocytes exposed to metformin and liver tissue from fetuses infused with metformin, consistent with predicted NRF-2 activation by RNA-seq. We show increased phosphorylated eIF2α, a readout of the integrated stress response. We also find increased expression of the transcriptional coactivator PGC1A and phosphorylation of CREB protein with metformin in fetal hepatocytes. This agrees with studies showing that phosphorylation of CREB by cAMP and stress signaling induces PGC1A expression (24,41). While higher PGC1A is expected to activate hepatic glucose production (20), we observe decreased glucose production and G6PC expression in hepatocytes exposed to metformin. Furthermore, in liver tissue from metformin-exposed fetuses, both PGC1A and G6PC expression is increased. These differences may be attributable to metformin’s effects on redox and energy state that regulate glucose production, independent of gluconeogenic gene regulation (17,23,25). Taken together, these in vitro and in vivo results demonstrate upregulation of PGC1A expression and NRF2 protein, supporting that these stress signals and AMPK activation initiate metformin-induced metabolic effects.
Our results show that metformin reduces glucose production, mitochondrial oxygen consumption, and ATP production in fetal hepatocytes. However, glucose production, fatty acid oxidation, and antioxidant defense pathways are developmentally immature in the fetus, and perturbations may produce more oxidative stress in fetal compared with postnatal tissues (26–28). In support, we show higher NRF2 protein abundance, PGC1A gene expression, and phosphorylation of CREB and eIF2α proteins in fetal compared with juvenile hepatocytes exposed to metformin. In juvenile hepatocytes, decreased expression of PGC1A and abundance of total CREB protein is consistent with studies in adults showing that metformin inhibits cAMP (24). Since glucose production is increased in fetuses with growth restriction (30), and reduced fetal growth is expected during intrauterine metformin exposure, the consequences of suppressing glucose production and associated alterations in carbon flux could be detrimental and warrant further investigation.
The liver secretes growth factors and hepatokines in response to nutrients and stress (46,47). We identify a direct metformin effect on hepatokines and growth factors including increased GDF15, FGF21, and IGFBP1 and decreased IGF1 and IGF2. GDF15 had the highest induction in our RNA-seq data and is increased in adults taking metformin and mediates metformin-associated weight loss (48). FGF21 is increased by nutrient stress via eIF2α-ATF4 pathway and regulates metabolism in peripheral tissues (47). Both IGF1 and IGF2 are established growth factors (49), and IGFBP1 antagonizes IGF action (30). Given the roles of these hepatokines in meditating nutrient utilization in peripheral tissues, we speculate that metformin may restrict fetal growth via altered expression and secretion of these factors. This aligns with lower metformin transporter expression and metformin uptake in extrahepatic tissues. Mechanistically, stress activation by metformin may underlie altered hepatokine expression and explain why stress-sensitive hepatokines, like FGF21 and IGF2, are regulated by metformin in fetal but not postnatal hepatocytes. Comparison of our in vitro and in vivo studies suggests that hepatokine expression may increase acutely, as observed with 24-h exposure in hepatocytes, yet compensatory mechanisms may reduce hepatokine expression following in vivo metformin exposure for 48–96 h.
We used a fetal infusion of metformin to test for direct fetal effects. A limitation of this model is that it does not recapitulate metformin exposure in human pregnancies whereby the mother, placenta, and fetus are exposed. Conversely, fetal infusion allows for the direct evaluation of metformin’s effects in the fetus independent of potential confounding effects on maternal and placental metabolism. We have performed pilot experiments with maternal metformin administration in pregnant sheep and did not detect metformin in the fetal blood (S.R.W., unpublished observations). Thus, metformin may not cross the sheep placenta, in contrast to other species (3,4,45,50–53). This likely reflects structural differences within the sheep placenta, including increased interhemal distance between the maternal and fetal blood exchange interface that prevents the transfer of metformin from mother to fetus (54).
Our in vivo doses of metformin achieved fetal concentrations (average 43 μmol/L) expected following metformin administration in pregnant women (17,41). We recognize that our in vitro doses are higher but represent expected metformin concentrations in liver tissue (25,44,48,55). However, circulating metformin is taken up by the liver and not metabolized into other metabolites (19,56). Metformin can accumulate in hepatic tissue (19,42,43) and expose hepatocytes to levels higher than observed in plasma (19). As such, metformin exposure in the fetus may expose hepatocytes within the liver to concentrations that are higher than those in plasma. Further, we used doses in vitro studies to ensure signaling pathways are maximally activated and functional efforts are observed. Importantly, metformin did not decrease cellularity measures or induce apoptosis gene expression, supporting the absence of cytoxicity with these doses in fetal hepatocytes, which have been used in other studies in primary hepatocytes (44). Interestingly, metformin dose-dependently decreased cellularity measures in juvenile but not fetal hepatocytes (Supplementary Fig. 6), highlighting another developmental difference in the hepatocyte’s response to metformin. This may be attributable to metformin’s differential effects on the inhibition of mTOR signaling and cell growth, which were robust in juvenile macaque hepatocytes with a lesser response in fetal macaque hepatocytes and were not observed in fetal sheep hepatocytes or liver tissue of metformin-infused fetus. Further, in vivo hepatic effects represent the combinatorial effects of metformin exposure plus systemic fetal nutrient and hormone concentrations concurrently affected by metformin. Additional studies are needed to test whether prolonged metformin exposure at therapeutic doses in vivo produces sustained metabolic stress and dysregulation of hepatokine expression in the fetal liver, in addition to effects on glucose production and growth pathways.
Overall, this study shows that metformin exposure is associated with disrupted signaling and metabolism in fetal hepatocytes in sheep and macaques. These data demonstrate the urgent need for functional studies on the consequences of intrauterine metformin exposure in the fetus that may be mediated by direct effects in the fetal liver. Such studies are critical to inform clinical practice regarding the fetal growth and offspring metabolic effects that result from maternal metformin use during pregnancy.
Article Information
Acknowledgments. The authors would like to thank the primary investigators on National Centers for Translational Research in Reproduction and Infertility (NCTRI) grant P50-HD071836 (J.D.H.) for the provision of fetal tissue samples and liver tissue for hepatocytes, and the primary investigators on National Institutes of Health grant R24-DK090964 grant (J.E.F., K.M.A., and P.K.) for the provision of postnatal tissue samples and liver tissue for hepatocytes. The authors thank Lynn Barbour, University of Colorado, for her insightful comments on the clinical significance of this research, and Colleen Elliott, PhD of CME Science Writers, LLC provided writing and editorial support.
Funding. This work was supported by the National Institutes of Health grant R01-DK108910 (to S.R.W.) and by a grant from the Ludeman Family Center for Women’s Health Research at the University of Colorado Anschutz Medical Campus. Additional support was provided by National Institutes of Health grants P51-OD011092 for operation of the Oregon National Primate Research Center, P30-CA046934 for the University of Colorado Genomic Core, P30-DK048520 for the University of Colorado Nutrition Obesity Research Center, R01-HD093701 (to P.J.R.), R01-HD079404 (to L.D.B.), R01-DK128187 (to K.M.A.), R01-DK089201 (to K.M.A.), T32-HD007186 (to A.K.J.), F32-DK120070 (to A.K.J.), and F30-DK122672 (to M.J.N.).
Duality of Interest. No potential conflicts of interest relevant to this article were reported.
Author Contributions. S.R.W. designed experiments, wrote the main manuscript text, and prepared figures and tables. K.S.S., D.W., A.K.J., and M.J.N. performed experiments and analyzed data. D.L.T., P.K., J.D.H., K.M.A., J.E.F., P.J.R., and L.D.B. assisted with identifying the hypotheses to be tested, experimental design, utilization of experimental samples, and data interpretation. R.O. and K.L.J. assisted with RNA-seq analysis. All authors reviewed the manuscript. S.R.W. is the guarantor of this work and, as such, had full access to all the data in the study and takes responsibility for the integrity of the data and the accuracy of the data analysis.
Footnotes
This article contains supplementary material online at https://doi.org/10.2337/figshare.23553117.
References
- 1. Lindsay RS, Loeken MR. Metformin use in pregnancy: promises and uncertainties. Diabetologia 2017;60:1612–1619 [DOI] [PMC free article] [PubMed] [Google Scholar]
- 2. Barbour LA, Feig DS. Metformin for gestational diabetes mellitus: progeny, perspective, and a personalized approach. Diabetes Care 2019;42:396–399 [DOI] [PubMed] [Google Scholar]
- 3. Vanky E, Zahlsen K, Spigset O, Carlsen SM. Placental passage of metformin in women with polycystic ovary syndrome. Fertil Steril 2005;83:1575–1578 [DOI] [PubMed] [Google Scholar]
- 4. Charles B, Norris R, Xiao X, Hague W. Population pharmacokinetics of metformin in late pregnancy. Ther Drug Monit 2006;28:67–72 [DOI] [PubMed] [Google Scholar]
- 5. Scherneck S, Schlinke N, Beck E, Grupe K, Weber-Schoendorfer C, Schaefer C. Pregnancy outcome after first-trimester exposure to metformin: a prospective cohort study. Reprod Toxicol 2018;81:79–83 [DOI] [PubMed] [Google Scholar]
- 6. Butalia S, Gutierrez L, Lodha A, Aitken E, Zakariasen A, Donovan L. Short- and long-term outcomes of metformin compared with insulin alone in pregnancy: a systematic review and meta-analysis. Diabet Med 2017;34:27–36 [DOI] [PubMed] [Google Scholar]
- 7. Tarry-Adkins JL, Aiken CE, Ozanne SE. Neonatal, infant, and childhood growth following metformin versus insulin treatment for gestational diabetes: a systematic review and meta-analysis. PLoS Med 2019;16:e1002848. [DOI] [PMC free article] [PubMed] [Google Scholar]
- 8. Xu Q, Xie Q. Long-term effects of prenatal exposure to metformin on the health of children based on follow-up studies of randomized controlled trials: a systematic review and meta-analysis. Arch Gynecol Obstet 2019;299:1295–1303 [DOI] [PubMed] [Google Scholar]
- 9. Hanem LGE, Stridsklev S, Júlíusson PB, et al. Metformin Use in PCOS pregnancies increases the risk of offspring overweight at 4 years of age: follow-up of two RCTs. J Clin Endocrinol Metab 2018;103:1612–1621 [DOI] [PubMed] [Google Scholar]
- 10. Hjorth-Hansen A, Salvesen Ø, Engen Hanem LG, et al. Fetal growth and birth anthropometrics in metformin-exposed offspring born to mothers with PCOS. J Clin Endocrinol Metab 2018;103:740–747 [DOI] [PubMed] [Google Scholar]
- 11. Rowan JA, Rush EC, Plank LD, et al. Metformin in gestational diabetes: the offspring follow-up (MiG TOFU): body composition and metabolic outcomes at 7–9 years of age. BMJ Open Diabetes Res Care 2018;6:e000456. [DOI] [PMC free article] [PubMed] [Google Scholar]
- 12. Tarry-Adkins JL, Aiken CE, Ozanne SE. Comparative impact of pharmacological treatments for gestational diabetes on neonatal anthropometry independent of maternal glycaemic control: a systematic review and meta-analysis. PLoS Med 2020;17:e1003126. [DOI] [PMC free article] [PubMed] [Google Scholar]
- 13. Feig DS, Donovan LE, Zinman B, et al.; MiTy Collaborative Group . Metformin in women with type 2 diabetes in pregnancy (MiTy): a multicentre, international, randomised, placebo-controlled trial. Lancet Diabetes Endocrinol 2020;8:834–844 [DOI] [PubMed] [Google Scholar]
- 14. Hanem LGE, Salvesen Ø, Juliusson PB, et al. Intrauterine metformin exposure and offspring cardiometabolic risk factors (PedMet study): a 5-10 year follow-up of the PregMet randomised controlled trial. Lancet Child Adolesc Health 2019;3:166–174 [DOI] [PubMed] [Google Scholar]
- 15. Schoonejans JM, Blackmore HL, Ashmore TJ, et al. Sex-specific effects of maternal metformin intervention during glucose-intolerant obese pregnancy on body composition and metabolic health in aged mouse offspring. Diabetologia 2022;65:2132–2145 [DOI] [PMC free article] [PubMed] [Google Scholar]
- 16. Carlson Z, Hafner H, Mulcahy M, et al. Lactational metformin exposure programs offspring white adipose tissue glucose homeostasis and resilience to metabolic stress in a sex-dependent manner. Am J Physiol Endocrinol Metab 2020;318:E600–E612 [DOI] [PMC free article] [PubMed] [Google Scholar]
- 17. LaMoia TE, Shulman GI. Cellular and molecular mechanisms of metformin action. Endocr Rev 2021;42:77–96 [DOI] [PMC free article] [PubMed] [Google Scholar]
- 18. Shu Y, Sheardown SA, Brown C, et al. Effect of genetic variation in the organic cation transporter 1 (OCT1) on metformin action. J Clin Invest 2007;117:1422–1431 [DOI] [PMC free article] [PubMed] [Google Scholar]
- 19. Jensen JB, Sundelin EI, Jakobsen S, et al. [11C]-labeled metformin distribution in the liver and small intestine using dynamic positron emission tomography in mice demonstrates tissue-specific transporter dependency. Diabetes 2016;65:1724–1730 [DOI] [PubMed] [Google Scholar]
- 20. Shaw RJ, Lamia KA, Vasquez D, et al. The kinase LKB1 mediates glucose homeostasis in liver and therapeutic effects of metformin. Science 2005;310:1642–1646 [DOI] [PMC free article] [PubMed] [Google Scholar]
- 21. El-Mir MY, Nogueira V, Fontaine E, Avéret N, Rigoulet M, Leverve X. Dimethylbiguanide inhibits cell respiration via an indirect effect targeted on the respiratory chain complex I. J Biol Chem 2000;275:223–228 [DOI] [PubMed] [Google Scholar]
- 22. Owen MR, Doran E, Halestrap AP. Evidence that metformin exerts its anti-diabetic effects through inhibition of complex 1 of the mitochondrial respiratory chain. Biochem J 2000;348:607–614 [PMC free article] [PubMed] [Google Scholar]
- 23. Foretz M, Hébrard S, Leclerc J, et al. Metformin inhibits hepatic gluconeogenesis in mice independently of the LKB1/AMPK pathway via a decrease in hepatic energy state. J Clin Invest 2010;120:2355–2369 [DOI] [PMC free article] [PubMed] [Google Scholar]
- 24. Miller RA, Chu Q, Xie J, Foretz M, Viollet B, Birnbaum MJ. Biguanides suppress hepatic glucagon signalling by decreasing production of cyclic AMP. Nature 2013;494:256–260 [DOI] [PMC free article] [PubMed] [Google Scholar]
- 25. Madiraju AK, Qiu Y, Perry RJ, et al. Metformin inhibits gluconeogenesis via a redox-dependent mechanism in vivo. Nat Med 2018;24:1384–1394 [DOI] [PMC free article] [PubMed] [Google Scholar]
- 26. Girard J. Metabolic adaptations to change of nutrition at birth. Biol Neonate 1990;58(Suppl. 1):3–15 [DOI] [PubMed] [Google Scholar]
- 27. Henderson GI, Chen JJ, Schenker S. Ethanol, oxidative stress, reactive aldehydes, and the fetus. Front Biosci 1999;4:D541–D550 [DOI] [PubMed] [Google Scholar]
- 28. Kalhan S, Parimi P. Gluconeogenesis in the fetus and neonate. Semin Perinatol 2000;24:94–106 [DOI] [PubMed] [Google Scholar]
- 29. Grasmann G, Smolle E, Olschewski H, Leithner K. Gluconeogenesis in cancer cells - repurposing of a starvation-induced metabolic pathway? Biochim Biophys Acta Rev Cancer 2019;1872:24–36 [DOI] [PMC free article] [PubMed] [Google Scholar]
- 30. Thorn SR, Brown LD, Rozance PJ, Hay WW Jr., Friedman JE. Increased hepatic glucose production in fetal sheep with intrauterine growth restriction is not suppressed by insulin. Diabetes 2013;62:65–73 [DOI] [PMC free article] [PubMed] [Google Scholar]
- 31. Kilkenny C, Browne W, Cuthill IC, Emerson M, Altman DG; NC3Rs Reporting Guidelines Working Group . Animal research: reporting in vivo experiments: the ARRIVE guidelines. Br J Pharmacol 2010;160:1577–1579 [DOI] [PMC free article] [PubMed] [Google Scholar]
- 32. Rozance PJ, Jones AK, Bourque SL, et al. Effects of chronic hyperinsulinemia on metabolic pathways and insulin signaling in the fetal liver. Am J Physiol Endocrinol Metab 2020;319:E721–E733 [DOI] [PMC free article] [PubMed] [Google Scholar]
- 33. Kuo K, Roberts VHJ, Gaffney J, et al. Maternal high-fat diet consumption and chronic hyperandrogenemia are associated with placental dysfunction in female rhesus macaques. Endocrinology 2019;160:1937–1949 [DOI] [PMC free article] [PubMed] [Google Scholar]
- 34. Lee MJ, Wu Y, Fried SK. A modified protocol to maximize differentiation of human preadipocytes and improve metabolic phenotypes. Obesity (Silver Spring) 2012;20:2334–2340 [DOI] [PMC free article] [PubMed] [Google Scholar]
- 35. Soto SM, Blake AC, Wesolowski SR, et al. Myoblast replication is reduced in the IUGR fetus despite maintained proliferative capacity in vitro. J Endocrinol 2017;232:475–491 [DOI] [PMC free article] [PubMed] [Google Scholar]
- 36. Thorn SR, Baquero KC, Newsom SA, et al. Early life exposure to maternal insulin resistance has persistent effects on hepatic NAFLD in juvenile nonhuman primates. Diabetes 2014;63:2702–2713 [DOI] [PMC free article] [PubMed] [Google Scholar]
- 37. Nash MJ, Dobrinskikh E, Janssen RC, et al. Maternal Western diet is associated with distinct preclinical pediatric NAFLD phenotypes in juvenile nonhuman primate offspring. Hepatol Commun 2023;7:e0014. [DOI] [PMC free article] [PubMed] [Google Scholar]
- 38. Jones AK, Rozance PJ, Brown LD, et al. Sustained hypoxemia in late gestation potentiates hepatic gluconeogenic gene expression but does not activate glucose production in the ovine fetus. Am J Physiol Endocrinol Metab 2019;317:E1–E10 [DOI] [PMC free article] [PubMed] [Google Scholar]
- 39. Amini H, Ahmadiani A, Gazerani P. Determination of metformin in human plasma by high-performance liquid chromatography. J Chromatogr B Analyt Technol Biomed Life Sci 2005;824:319–322 [DOI] [PubMed] [Google Scholar]
- 40. Orellana EA, Kasinski AL, Sulforhodamine B. Sulforhodamine B (SRB) assay in cell culture to investigate cell proliferation. Bio Protoc 2016;6:e1984. [DOI] [PMC free article] [PubMed] [Google Scholar]
- 41. He L, Wondisford FE. Metformin action: concentrations matter. Cell Metab 2015;21:159–162 [DOI] [PubMed] [Google Scholar]
- 42. Chandel NS, Avizonis D, Reczek CR, et al. Are metformin doses used in murine cancer models clinically relevant? Cell Metab 2016;23:569–570 [DOI] [PubMed] [Google Scholar]
- 43. Wang DS, Jonker JW, Kato Y, Kusuhara H, Schinkel AH, Sugiyama Y. Involvement of organic cation transporter 1 in hepatic and intestinal distribution of metformin. J Pharmacol Exp Ther 2002;302:510–515 [DOI] [PubMed] [Google Scholar]
- 44. Howell JJ, Hellberg K, Turner M, et al. Metformin inhibits hepatic mTORC1 signaling via dose-dependent mechanisms involving AMPK and the TSC complex. Cell Metab 2017;25:463–471 [DOI] [PMC free article] [PubMed] [Google Scholar]
- 45. Hufnagel A, Fernandez-Twinn DS, Blackmore HL, et al. Maternal but not fetoplacental health can be improved by metformin in a murine diet-induced model of maternal obesity and glucose intolerance. J Physiol 2022;600:903–919 [DOI] [PMC free article] [PubMed] [Google Scholar]
- 46. Meex RCR, Watt MJ. Hepatokines: linking nonalcoholic fatty liver disease and insulin resistance. Nat Rev Endocrinol 2017;13:509–520 [DOI] [PubMed] [Google Scholar]
- 47. Lee MS. Effect of mitochondrial stress on systemic metabolism. Ann N Y Acad Sci 2015;1350:61–65 [DOI] [PubMed] [Google Scholar]
- 48. Day EA, Ford RJ, Smith BK, et al. Metformin-induced increases in GDF15 are important for suppressing appetite and promoting weight loss. Nat Metab 2019;1:1202–1208 [DOI] [PubMed] [Google Scholar]
- 49. Fowden AL. Endocrine regulation of fetal growth. Reprod Fertil Dev 1995;7:351–363 [DOI] [PubMed] [Google Scholar]
- 50. Liao MZ, Flood Nichols SK, Ahmed M, et al. Effects of pregnancy on the pharmacokinetics of metformin. Drug Metab Dispos 2020;48:264–271 [DOI] [PMC free article] [PubMed] [Google Scholar]
- 51. de Oliveira Baraldi C, Lanchote VL, de Jesus Antunes N, et al. Metformin pharmacokinetics in nondiabetic pregnant women with polycystic ovary syndrome. Eur J Clin Pharmacol 2011;67:1027–1033 [DOI] [PubMed] [Google Scholar]
- 52. Salomäki H, Vähätalo LH, Laurila K, et al. Prenatal metformin exposure in mice programs the metabolic phenotype of the offspring during a high fat diet at adulthood. PLoS One 2013;8:e56594. [DOI] [PMC free article] [PubMed] [Google Scholar]
- 53. Lee N, Hebert MF, Wagner DJ, et al. Organic cation transporter 3 facilitates fetal exposure to metformin during pregnancy. Mol Pharmacol 2018;94:1125–1131 [DOI] [PMC free article] [PubMed] [Google Scholar]
- 54. Furukawa S, Kuroda Y, Sugiyama A. A comparison of the histological structure of the placenta in experimental animals. J Toxicol Pathol 2014;27:11–18 [DOI] [PMC free article] [PubMed] [Google Scholar]
- 55. Wang Y, An H, Liu T, et al. Metformin improves mitochondrial respiratory activity through activation of AMPK. Cell Rep 2019;29:1511–1523 [DOI] [PMC free article] [PubMed] [Google Scholar]
- 56. Graham GG, Punt J, Arora M, et al. Clinical pharmacokinetics of metformin. Clin Pharmacokinet 2011;50:81–98 [DOI] [PubMed] [Google Scholar]


