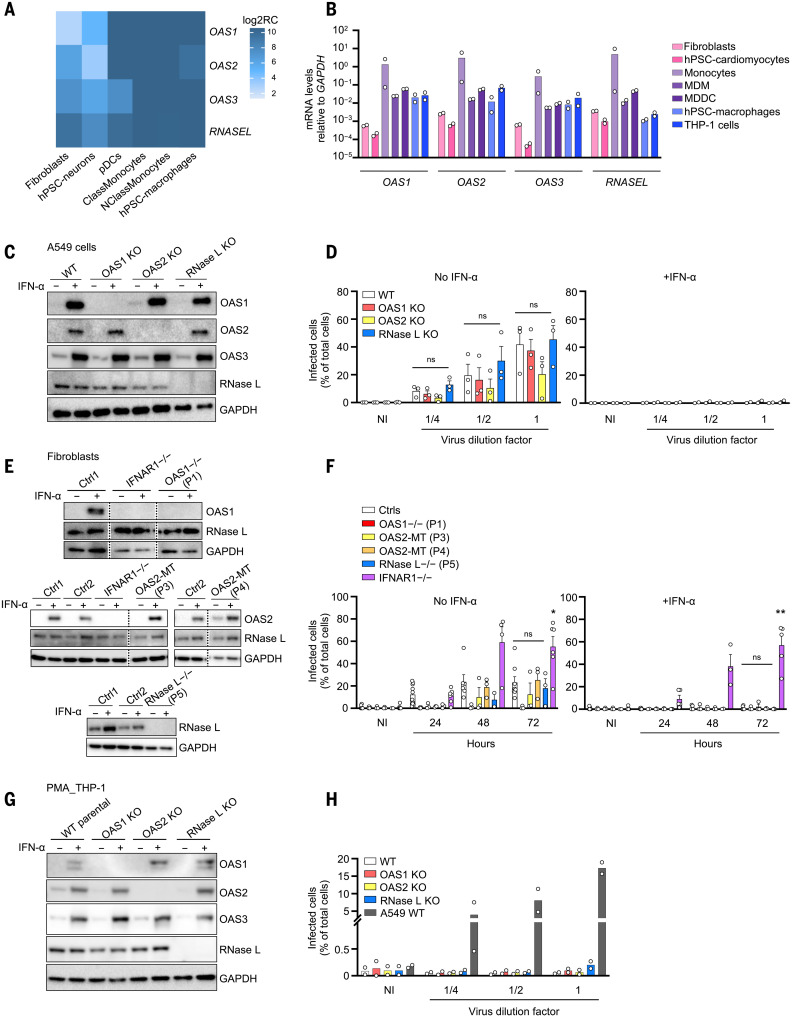
Fig. 2. Expression pattern of the OAS–RNase L pathway genes and their role in SARS-CoV-2 restriction.
(A and B) Relative OAS1, OAS2, OAS3, and RNASEL mRNA levels measured by bulk RNA-seq (A) or RT-qPCR (B), in various cell types. hPSC, human pluripotent stem cell; ClassMonocytes, classical monocytes; NClassMonocytes, nonclassical monocytes; MDM, monocyte-derived macrophages; MDDC, monocyte-derived dendritic cells; Log2RC, log2 read count. (C and D) Immunoblot of the indicated proteins (C) and immunofluorescence (IF) of SARS-CoV-2 nucleocapsid (N) protein (D) in A549+ACE2/TMPRSS2 cells with and without knockout (KO) of OAS1, OAS2, or RNase L. IF analysis for N protein was performed 24 hours after infection with various dilutions of SARS-CoV-2. Dilution factors of 1/4, 1/2, and 1 correspond to MOI values of 0.0002, 0.0005, and 0.001, respectively. GAPDH, glyceraldehyde-3-phosphate dehydrogenase; NI, noninfected. (E and F) Immunoblot of the indicated proteins (E) and IF analysis for the SARS-CoV-2 N protein (F) in SV40-fibroblasts+ACE2 from healthy controls (Ctrl1 and Ctrl2), patients with OAS-RNASEL mutations (P1, P3, P4, and P5), and a previously reported patient with complete IFNAR1 deficiency (IFNAR1−/−). IF analysis for N protein was performed at various time points after infection at a MOI of 0.08. (G and H) Immunoblot of the indicated proteins (G) and IF analysis for the SARS-CoV-2 N protein (H) in THP-1 cells with and without KO of OAS1, OAS2, or RNase L. IF analyses for N protein were performed in PMA-primed THP-1 cells 24 hours after infection with various dilutions of SARS-CoV-2. Dilution factors of 1/4, 1/2, and 1 correspond to MOI values of 0.012, 0.025, and 0.05, respectively. WT A549+ACE2/TMPRSS2 cells were included as a positive control for SARS-CoV-2 infection. The data points are means ± SEM from three [(D) and (F)] or means from two [(B) and (H)] independent experiments with three to six technical replicates per experiment. Statistical analyses were performed as described in the methods. ns, not significant; *P < 0.05, **P < 0.01.

