

SUMMARY
Objective
Effects of oral antidiabetic drugs (OADs) on lipids may influence cardiovascular outcomes. Our aim was to compare time to initiation of lipid lowering medication (LLM) and 12-month lipid profiles among new OAD users.
Methods
We identified a retrospective cohort of 17 774 veterans who received care at Veterans Administration (VA) Mid-South Network with a first OAD from 1 January 2000 to 31 December 2007. There were 6917 patients (38.9%) not on a LLM at baseline, and 3871 (56%) had complete covariates. Incident users of sulfonylurea and combination metformin + sulfonylurea were compared to metformin users for time to LLM initiation. Incident users of these OADs and thiazolidendiones were included in comparison of 12-month low-density lipoprotein (LDL), high-density lipoprotein (HDL), triglycerides (TGs), and total cholesterol. All analyses adjusted for demographics, lipids, HbA1C, healthcare utilization, and cardiovascular disease at baseline.
Results
The median time to starting LLM was 2.35 years (interquartile range 0.96, 4.6) following metformin initiation and not statistically different for users of sulfonylureas, or combination OADs. Compared to metformin users, 12-month HDL was 1.35 mg/dl (95%CI: −2.01, −0.72) lower and TGs were 5.7% higher (95%CI: 1.5%, 10.0%) for sulfonylurea users; TGs were 24.8% (95%CI: 0.7%, 54.5%) higher for thiazolidinedione users. Statin users had LDL and total cholesterol 16.7 mg/dl (95%CI: −19.9, −13.5) and 18.6 mg/dl (95%CI: −22.1, −15.1) lower than non-statin users, respectively.
Conclusions
Time to LLM initiation was similar between OADs. Metformin use resulted in more favorable lipids at 12 months compared to sulfonylureas or thiazolidinediones.
Keywords: diabetes, lipids, comparative effectiveness
INTRODUCTION
Patients with type 2 diabetes often have associated lipid abnormalities, including reduced high-density lipoprotein (HDL), cholesterol and elevated triglycerides (TGs), and low-density lipoprotein (LDL) levels.1–5 Each of these abnormalities is independently associated with increased cardiovascular disease (CVD) risk. Although interventions such as diet and exercise can improve dyslipidemia, pharmacological therapy is often needed to reach treatment goals.
Oral antidiabetic drugs (OADs) may affect lipid levels. To evaluate differences in CVD between OADs, it is important to understand if OADs have differential effects on lipids or the likelihood of starting lipid lowering medications (LLM). Two recent reviews of clinical trials (most 12–24 weeks duration) described changes in lipids after OAD treatment. Buse et al. 6 reported that evidence for effects of sulfonylureas on lipids was inconclusive; metformin reduced total cholesterol but effects on other lipids were inconclusive; rosiglitazone increased LDL, HDL, and total cholesterol but had no effect on TGs; and pioglitazone increased HDL and reduced TGs but did not affect LDL or total cholesterol. The 2008 systematic review by Bolen et al.7 reported that sulfonylureas had minimal effects on LDL and TGs; metformin decreased LDL and TGs by 10 mg/dl; and that thiazolidinediones increased LDL by 10 mg/dl, and increased HDL by 3–5 mg/dl compared with metformin or sulfonylureas. Most data for both systematic reviews came from studies of 12–24 weeks duration. In preparation for a study of OADs and CVD, we explored the comparative effects of OADs on lipids.
Our objective was to determine whether choice of incident OAD was associated with time to initiation of LLM, and to determine the association between incident OADs and 12 months lipid profiles after OAD initiation. Our hypothesis was that sulfonylureas would have a shorter time to LLM versus metformin and less favorable lipid profile at 12 months, given the favorable effects of metformin on weight and LDL.
METHODS
Study Design, Setting, and Data Sources
We conducted a retrospective cohort study of diabetic veterans seen in the Mid South Network between 1 January 2000 and 31 December 2007. The cohort was constructed from VA administrative and pharmacy databases. The administrative data files contain electronically captured patient demographics, vital signs, laboratory results, and coded diagnostic and procedure information from inpatient and outpatient encounters. Diagnoses associated with healthcare visits were coded according to the International Classification of Diseases, Ninth Revision; Clinical Modification (ICD9-CM).8 The pharmacy files contain electronically captured data from each prescription filled through the VA pharmacy including medication name, date filled, days supplied, pill number, and dosage. For veterans who were also Medicare eligible, Medicare data were obtained (through 2004) through the VA Information Resource Center (VIReC) and merged with the analytical database.9 The institutional review boards of Vanderbilt University and the VA TVHS—and the Research and Development Committee approved this study.
Population
The study population included veterans aged ≥18 years receiving care in the VA Mid-South Network who filled an antidiabetic drug prescription during the study period. Incident users with known birth date and gender, and at least 365 days of baseline data were identified for study to avoid methodological issues related to prevalent users.10 Incident prescriptions were defined as the first OAD prescription filled after ≥365 days of active use of the VA pharmacy services without any antidiabetic drug. We excluded patients with baseline diagnosis for serious medical conditions (HIV/AIDS, cancer except for non-melanoma skin cancer, transplant, end stage kidney or liver disease, or respiratory failure) as these conditions may influence the initiation of LLMs. We also excluded patients who used antipsychotics at baseline or at the time of the 12-month lipid measurement because of their effects on lipids.11,12
Baseline use of a LLM was defined by at least one prescription filled in the 365-day baseline period for: a statin (3-hydroxy-3-methyl-glutaryl-CoA reductase inhibitor), cholestyramine, colestipol, niacin, niacinamide, fish oil concentrate, omega 3 fatty acids, gemfibrozil, clofibrate, fenofibrate, fenofibric acid, ezetimibe, or ezetimibe/simvastatin. The assessment of time to initiation of LLMs was restricted to patients without baseline use of these medications. Patients were followed from the index date (date of incident OAD prescription) through the date of first prescription for a LLM or a censoring event (see below).
The study of the effects of OADs on lipid profiles was restricted to patients with complete baseline covariate information and available lipids measurements at baseline and at 12 months. For this assessment, patients were followed from the index date through their 12-month lipid profile or a censoring event.
For both assessments, censoring events were hospitalization (since these events may influence decision to start LLMs), non-persistence on the OAD (adding another hypoglycemic agent, switching to another agent, or no drug in hand for 14 days), death, disenrolment (no VA claims for 180 days) or the end of the study (31 December 2007). Patients who left the cohort could subsequently re-enter if all selection criteria were fulfilled.
Exposures
The OAD categories were: metformin, sulfonylurea, thiazolidinediones, and combination metformin + sulfonylureas. All other incident OADs or combinations were not eligible for inclusion in this analysis because of small numbers. Using pharmacy information, ‘‘days’ supply in hand’’ was estimated. Since patients may ‘‘stockpile’’ medications, we estimated how many pills a patient had on each follow-up day. For example, if a patient filled a 90-day supply of metformin and refilled it on day 80, then on day 80 the patient had 100 days’ supply in hand (90 from the new fill plus 10 leftover from initial fill). Days’ supply in hand was reset to 0 with a change in OAD dose. This was necessary because many patients in the VA system receive medications through the mail and for various lengths of time (usually 30–90 days, >75% of prescriptions dispensed are for 90 days supply).
Episodes of use for a specific OAD began on the index date and stopped at the first of: switch to or addition of another hypoglycemic medication, a medication gap of 14 days, or an outcome or censoring event, as described above. Switching or addition of another agent was a censoring event.
Outcomes
The first outcome was time to initiation of a LLM among the sub-cohort of patients who did not use these medications. The second outcome was the lipid measurement closest to 12 months (range 9–15 months), including total cholesterol, calculated LDL, HDL, and TGs. Implausible values were excluded (LDL<0, >400; HDL <0, >250; total cholesterol <0, >700, and TG <0, >3000).
Covariates
Relevant co-morbidities were determined a priori using visit codes and prescriptions filled during baseline. Study covariates included: age, sex, race (white, black, other), calendar year, total cholesterol, HDL, and TG (closest value prior to cohort entry), binary indicators for medications known to affect lipid levels (corticosteroids, thyroid replacement hormones, anticonvulsants, and thiazide diuretics), CVD (Supplemental Table 1), glycosylated hemoglobin (HbA1c), body mass index (BMI), and healthcare utilization (number of outpatient visits, hospitalizations, and number of unique prescription medications used on the index date). During the study time frame LDL cholesterol was predominantly calculated from other lipid measurements and therefore it was excluded from the models to avoid co-linearity.
Statistical Analysis
The unit of analysis was the episode of use beginning with an incident prescription. The first analysis was time to initiation of LLMs among patients who persisted on their initial OAD regimen (gaps <14 days allowed). Cox proportional hazards regression models were used to analyze the association between OAD regimen and time-to-LLM initiation using metformin as the reference and adjusting for covariates. Thiazolidinedione users (n = 56 of the 7357 eligible prescriptions [0.8%]) were excluded because of small numbers. Hazard ratios (HR) and 95% confidence intervals (CI) were calculated. The proportional hazard assumptions were examined using log–log plots. The proportional hazards assumption was not met for the combination metformin + sulfonylurea group. Accordingly, separate models assessed the effects of the combination metformin + sulfonylurea allowing the proportional hazards to change with time. We adjusted for clustering of episodes within individual patients and calculated robust standard errors based on the sandwich variance estimator because some patients contributed more than one episode of use.13
The second analysis included all with and without LLM at baseline and compared the 12-month lipid levels (total cholesterol, LDL, HDL, and TGs) separately using linear regression models with robust standard errors and adjusting for baseline covariates. The models also adjusted for use of statin or non-statin LLMs at baseline and at the time of the 12-month lipid measurement. Metformin use served as exposure reference for all comparisons. The 12-month TG levels were right skewed, values were log-transformed for the linear regression analysis, and results were back transformed for reporting (necessitating reporting as percent change rather than absolute change from baseline). When continuous covariates were not linear, a third-degree polynomial term was included in the models for adjustment. Effect modification was assessed through stratified analyses by age (<65, 65–<75, and >75 years) and presence or absence of CVD. Due to significant time trends in sulfonylurea prescribing,14 we tested for an interaction between sulfonylureas and the year of cohort entry on time to LLM. Statistical analyses were conducted using R Statistical Program (R Foundation, available at: http://www.r-project.org) and SAS for Windows 11.0 (SAS Institute, Cary, NC).
Sensitivity Analyses
Planned sensitivity analyses were performed to determine the robustness of our findings. First, we varied our definition of persistence to allow for <90-day gap in days supply in hand. In addition, we reanalyzed our data using incident prescriptions to define exposure groups and ignored subsequent changes in OAD regimens (persistent exposure not required). This analysis is similar to an intention to treat analysis in randomized trials and patients remain in their initial exposure group until the end of study regardless of their drug persistence. Finally, we performed an additional analysis which did not censor patients for hospitalization.
AHRQ and the U.S. Department of Veterans Affairs had the opportunity to comment on this manuscript before submission.
RESULTS
Study Cohort and Analytic Populations
Of the 19 039 new episodes of OAD use identified, 51% were for metformin, 41% for sulfonylureas, 1% for thiazolidinediones (10% pioglitazone; 90% rosiglitazone), and 7% for combination metformin + sulfonylureas (Figure 1). Of these 19 039 episodes, 11 738 episodes were excluded from the time to LLM analysis, including those with a prescription for LLM in the baseline year or on the index date (61%) and those with a new eligible thiazolidinedione prescription (1%). Therefore, there were 7301 OAD episodes (6917 patients) available for the unadjusted time to LLM analysis; 3871 OAD episodes were available for the adjusted analysis after exclusion of observations with missing covariates. Three hundred fifty-eight of the 6917 patients (5%) had more than one OAD episode (maximum 4).
Figure 1.
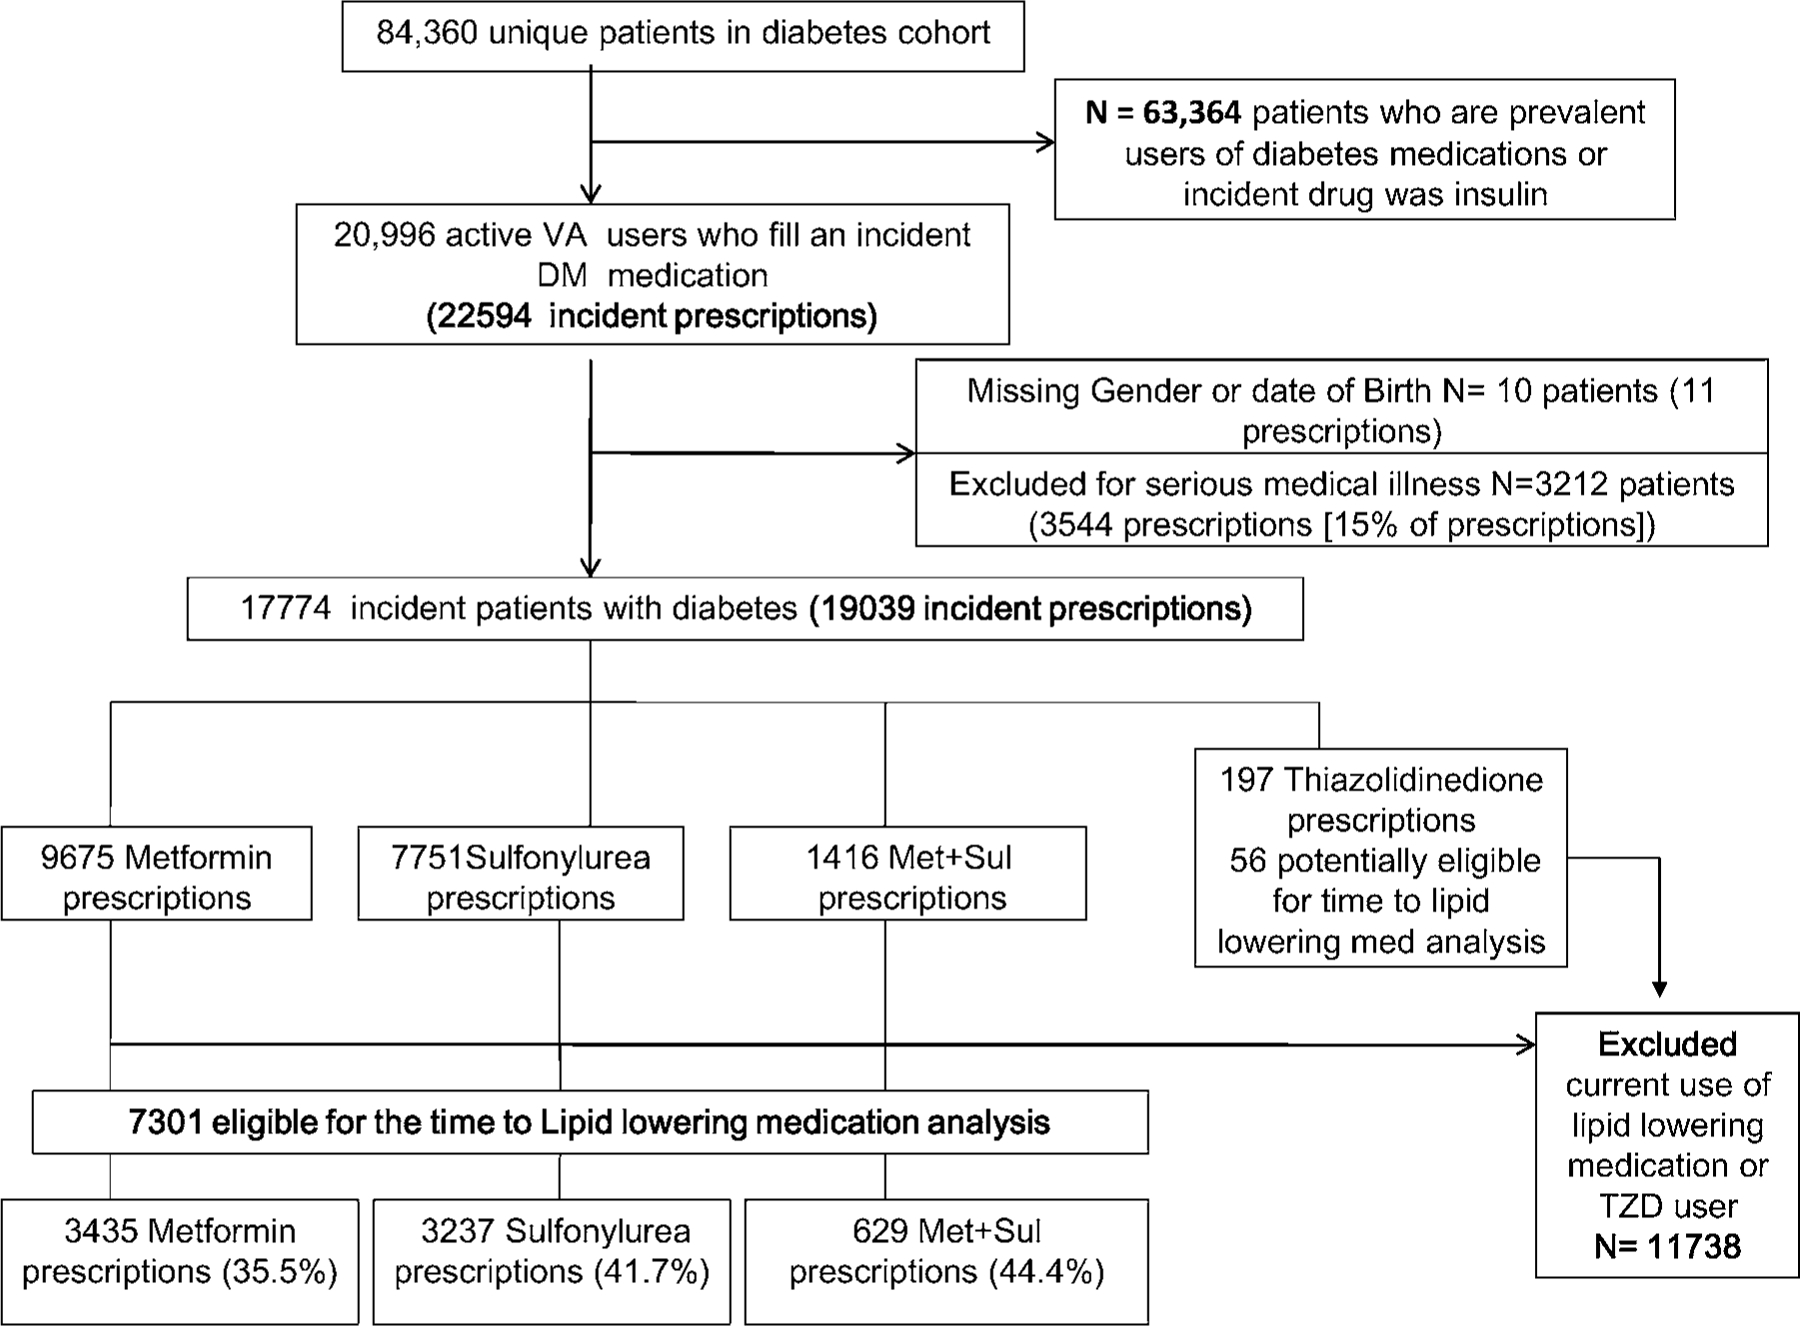
Patient flow and eligibility for study cohort
Characteristics
Characteristics of patients with no baseline LLM are shown in Table 1. The patients were 95% male, 72% white, had a median age of 61 years (interquartile range [IQR] 54, 72) and 12% had a history of CVD. Data for the full study cohort are shown for comparison (Supplemental Table 2). Fifty-two percent of the full cohort used statins in the baseline period and 15.4% used non-statin LLMs.
Table 1.
Characteristics at index date of incident OAD users not prescribed a lipid lowering medication in the baseline period
| Characteristic | Metformin (n = 3435) | Sulfonylurea (n = 3237) | Metformin + sulfonylurea (n = 629) |
|---|---|---|---|
| Age, median (IQR) | 60 (53, 69) | 65 (55, 76) | 59 (52, 68) |
| Male (%) | 94 | 97 | 95 |
| Race (%) | |||
| White | 74 | 72 | 66 |
| Black | 14 | 20 | 20 |
| Other/unknown | 12 | 8 | 14 |
| Use of medications that affect lipids (%) | |||
| Corticosteroids | 7.0 | 7.3 | 4.6 |
| Thyroid replacement | 5.6 | 6.1 | 4.0 |
| Anticonvulsants | 1.5 | 2.0 | 1.7 |
| Thiazide diuretics | 30.7 | 26.1 | 18.6 |
| HbA1c available (%) | 71.3 | 65.5 | 61.4 |
| HbA1c, median (IQR) | 7.2 (6.5, 8.0) | 7.3 (6.5, 8.4) | 8.2 (7.0, 10.5) |
| BMI available (%) | 94.2 | 92.5 | 90.0 |
| BMI, median (IQR) | 32.3 (28.3, 36.6) | 29.7 (26.3, 33.8) | 30.7 (27.4, 35.1) |
| History of CVD* (%) | 9.6 | 16.4 | 10.8 |
| Total cholesterol available (%) | 70.6 | 63.8 | 56.6 |
| Total cholesterol, median (IQR) | 186 (163, 211) | 185 (160, 210) | 189.5 (160.8, 220) |
| LDL available (%) | 60.3 | 54.9 | 45.6 |
| LDL, median (IQR) | 109 (89, 129) | 107 (86, 129) | 109 (85.9, 132.5) |
| HDL available (%) | 69.4 | 62.2 | 53.4 |
| HDL, median (IQR) | 36 (31, 44) | 36 (31, 44) | 37 (31, 44) |
| Triglycerides available (%) | 69.6 | 62.5 | 53.7 |
| Triglycerides, median (IQR) | 176 (121, 253) | 174 (117, 252) | 177.5 (118.2, 279) |
| Number of outpatient medications, median (IQR) | 3 (1, 6) | 3 (1, 6) | 1 (0, 3) |
| Number of outpatient visits, median (IQR) | 4 (2, 7) | 4 (2, 7) | 3 (2, 5) |
| Hospitalized (%) | 8.0 | 14.0 | 8.7 |
Defined as one inpatient or two outpatient codes for myocardial infarction; angina or coronary artery disease or prescription for a long acting nitrate; transient ischemic attack; stroke/cerebrovascular disease; carotid artery disease; or peripheral vascular disease.
Time to Lipid Lowering Medication
The unadjusted cumulative incidence plot showing the time to LLM initiation is displayed in Figure 2. The median time to LLM was 2.35 (IQR 0.96, 4.60) years for metformin users, 2.24 (IQR 0.91, 4.43) years for sulfonylurea users, and 1.95 (IQR 0.78, 3.87) years for combination users. In the multivariable analysis, there were no statistically significant differences between metformin and other OADs in time to LLM (Table 2). The aHRs were 1.03 (95%CI: 0.87, 1.23; p = 0.68) for sulfonylureas and 1.18 (95%CI: 0.85, 1.65; p = 0.28) for combination metformin + sulfonylureas.
Figure 2.
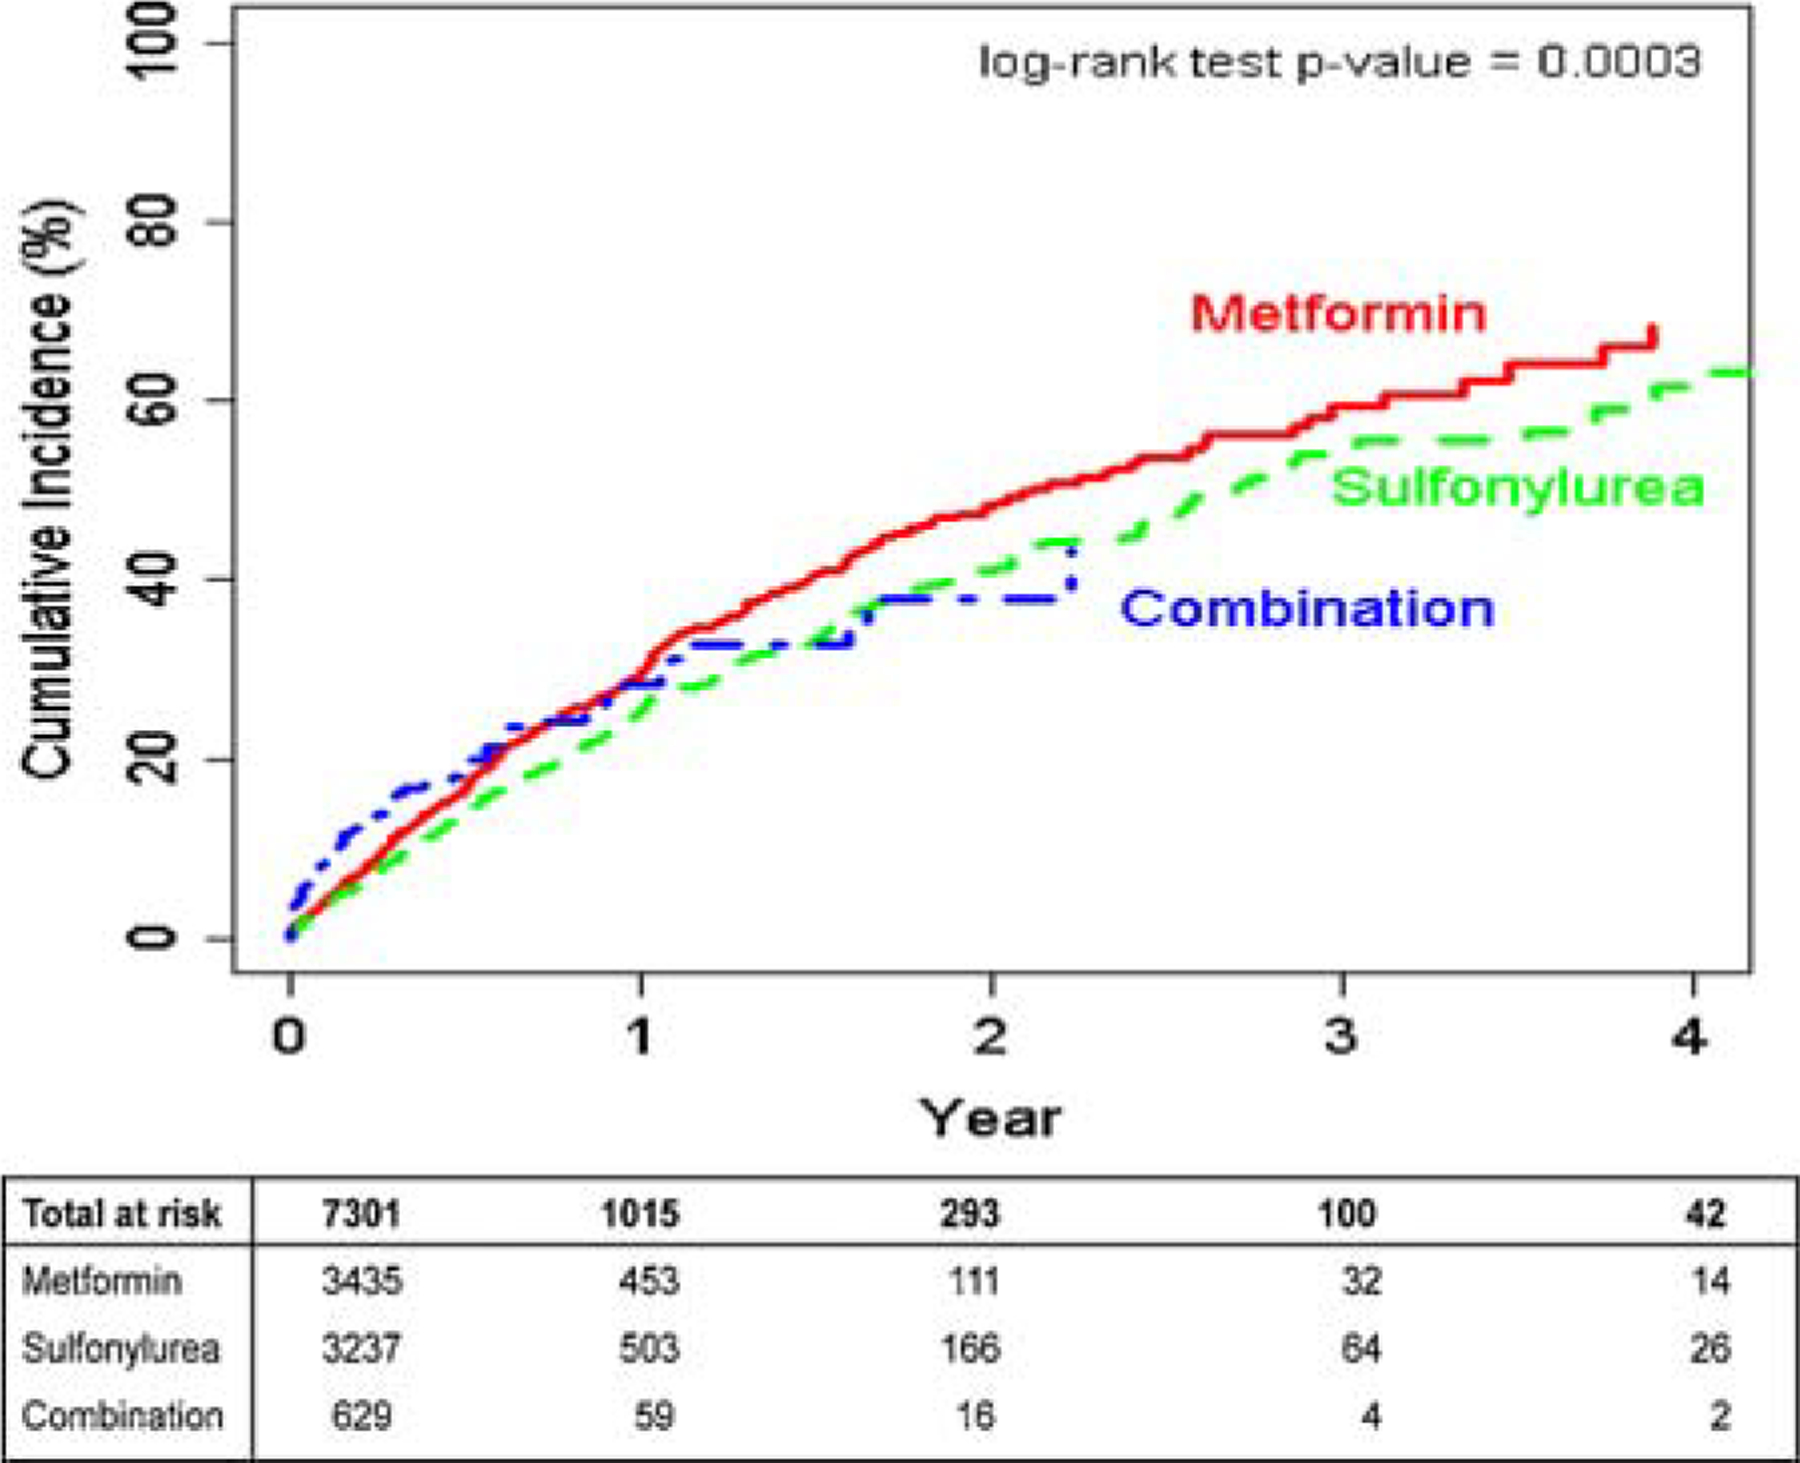
Cumulative incidence of prescription for a new lipid lowering medication among each OAD exposure group.
Table 2.
Cox proportional hazards model for time to lipid lowering medication initiation with Sandwich variance estimate
| Persistent exposure required |
Persistent exposure not required‡ | ||
|---|---|---|---|
| Primary analysis 14-day gaps allowed* | Sensitivity analysis 90-day gaps allowed† | ||
| Patients | 3814 | 3814 | 3871 |
| Events (initiation of lipid | 689 | 1047 | 1907 |
| lowering medications) | |||
| Censored | 3125 | 2767 | 1964 |
| Time at risk (years) | 2048.4 | 3215.5 | 7798.1 |
| Adjusted HR (95%CI) | Adjusted HR (95%CI) | Adjusted HR (95%CI) | |
|
| |||
| Metformin | Referent | ||
| Sulfonylurea | 1.03 (0.87, 1.23) | 0.96 (0.83, 1.10) | 0.95 (0.86, 1.06) |
| Combination of metformin + sulfonylurea | 1.18 (0.85, 1.65) | 1.03 (0.78, 1.36) | 1.10 (0.90, 1.35) |
| Age | 0.99 (0.98, 1.00) | 0.99 (0.98, 1.00) | 0.99 (0.99, 1.00) |
| History of CVD | 1.40 (1.10, 1.78) | 1.18 (0.95, 1.46) | 1.10 (0.95, 1.28) |
| Year of index date (%) | |||
| 2001 | Referent | ||
| 2002 | 1.35 (0.97, 1.88) | 1.49 (1.16, 1.91) | 1.14 (0.97, 1.35) |
| 2003 | 1.56 (1.12, 2.19) | 1.58 (1.22, 2.05) | 1.19 (1.00, 1.41) |
| 2004 | 1.93 (1.43, 2.69) | 1.85 (1.45, 2.35) | 1.37 (1.17, 1.61) |
| 2005 | 2.32 (1.68, 3.20) | 2.25 (1.75, 2.89) | 1.63 (1.37, 1.94) |
| 2006 | 2.47 (1.78, 3.43) | 2.33 (1.79, 3.02) | 1.72 (1.43, 2.07) |
| 2007 | 2.28 (1.58, 3.31) | 2.37 (1.74, 3.23) | 1.58 (1.23, 2.02) |
Primary analysis considers patients persistent on incident regimen until they do not have OAD medications for 14 days. Adjusted for age, sex, race, year of index date, use of medications known to affect lipids (corticosteroids, thyroid hormone, antiepileptics, thiazide diuretics), baseline HbA1c, BMI (third-degree polynomial), total cholesterol, triglycerides, HDL, history of cardiovascular disease, baseline number of medications (third-degree polynomial), number of outpatient visits, history of hospitalization at baseline.
Sensitivity analysis considers patient persistent on incident regimen until they do not have OAD medications for 90 days. Adjusted for age, sex, race, year of index date, use of medications known to affect lipids (corticosteroids, thyroid hormone, antiepileptics, thiazide diuretics), baseline HbA1c, BMI (third-degree polynomial), total cholesterol, triglycerides, HDL, history of cardiovascular disease, baseline number of medications (third-degree polynomial), number of outpatient visits, history of hospitalization at baseline.
Persistent exposure not required analysis in which patients remain in their exposure group, regardless of persistence on drug therapy, until outcome or end of the study. Analysis adjusted for age, sex, race, year of index date, use of medications known to affect lipids (corticosteroids, thyroid hormone, antiepileptics, thiazide diuretics), baseline HbA1c, BMI (third-degree polynomial), total cholesterol, triglycerides, HDL, history of cardiovascular disease, baseline number of medications (third-degree polynomial), number of outpatient visits, history of hospitalization at baseline.
Our sensitivity analysis, which varied the definition of persistence to allow 90-day gaps in use of incident OADs and the persistent exposure not required analysis, found similar results. We also conducted an alternate analysis which did not censor patients for hospitalization; these results were essentially unchanged from the results of the primary analysis. We found no evidence of interaction by year of cohort entry or effect modification by age or by underlying history of CVD on the time to LLM.
In our models that allowed the hazard to change with time, results were similar to the primary analysis for single OAD exposures but not for combination metformin + sulfonylurea use. During the first 120 days, combination metformin + sulfonylurea users were more likely to start a LLM than metformin users (aHR 1.69, 95%CI: 1.17, 2.43; p = 0.005). However, after 120 days, combination users were less likely to start LLMs compared with metformin users (aHR 0.58, 95%CI: 0.33, 1.04; p = 0.06). This complex relationship can be seen in Figure 2.
LDL, HDL, Total Cholesterol, and Triglycerides at 12 Months
Lipid values at 12 months for OAD groups are shown in Figure 3 as the difference from the 12-month metformin value. The intercept from the regression model represents the mean value for an average aged, white, male metformin user without CVD, not using LLM at baseline or 12 months, who entered the cohort in 2000 with average values of baseline HbA1c, total cholesterol, HDL, and TG. Less than 1% of patients had more than one episode included in any of the linear regression analyses.
Figure 3.
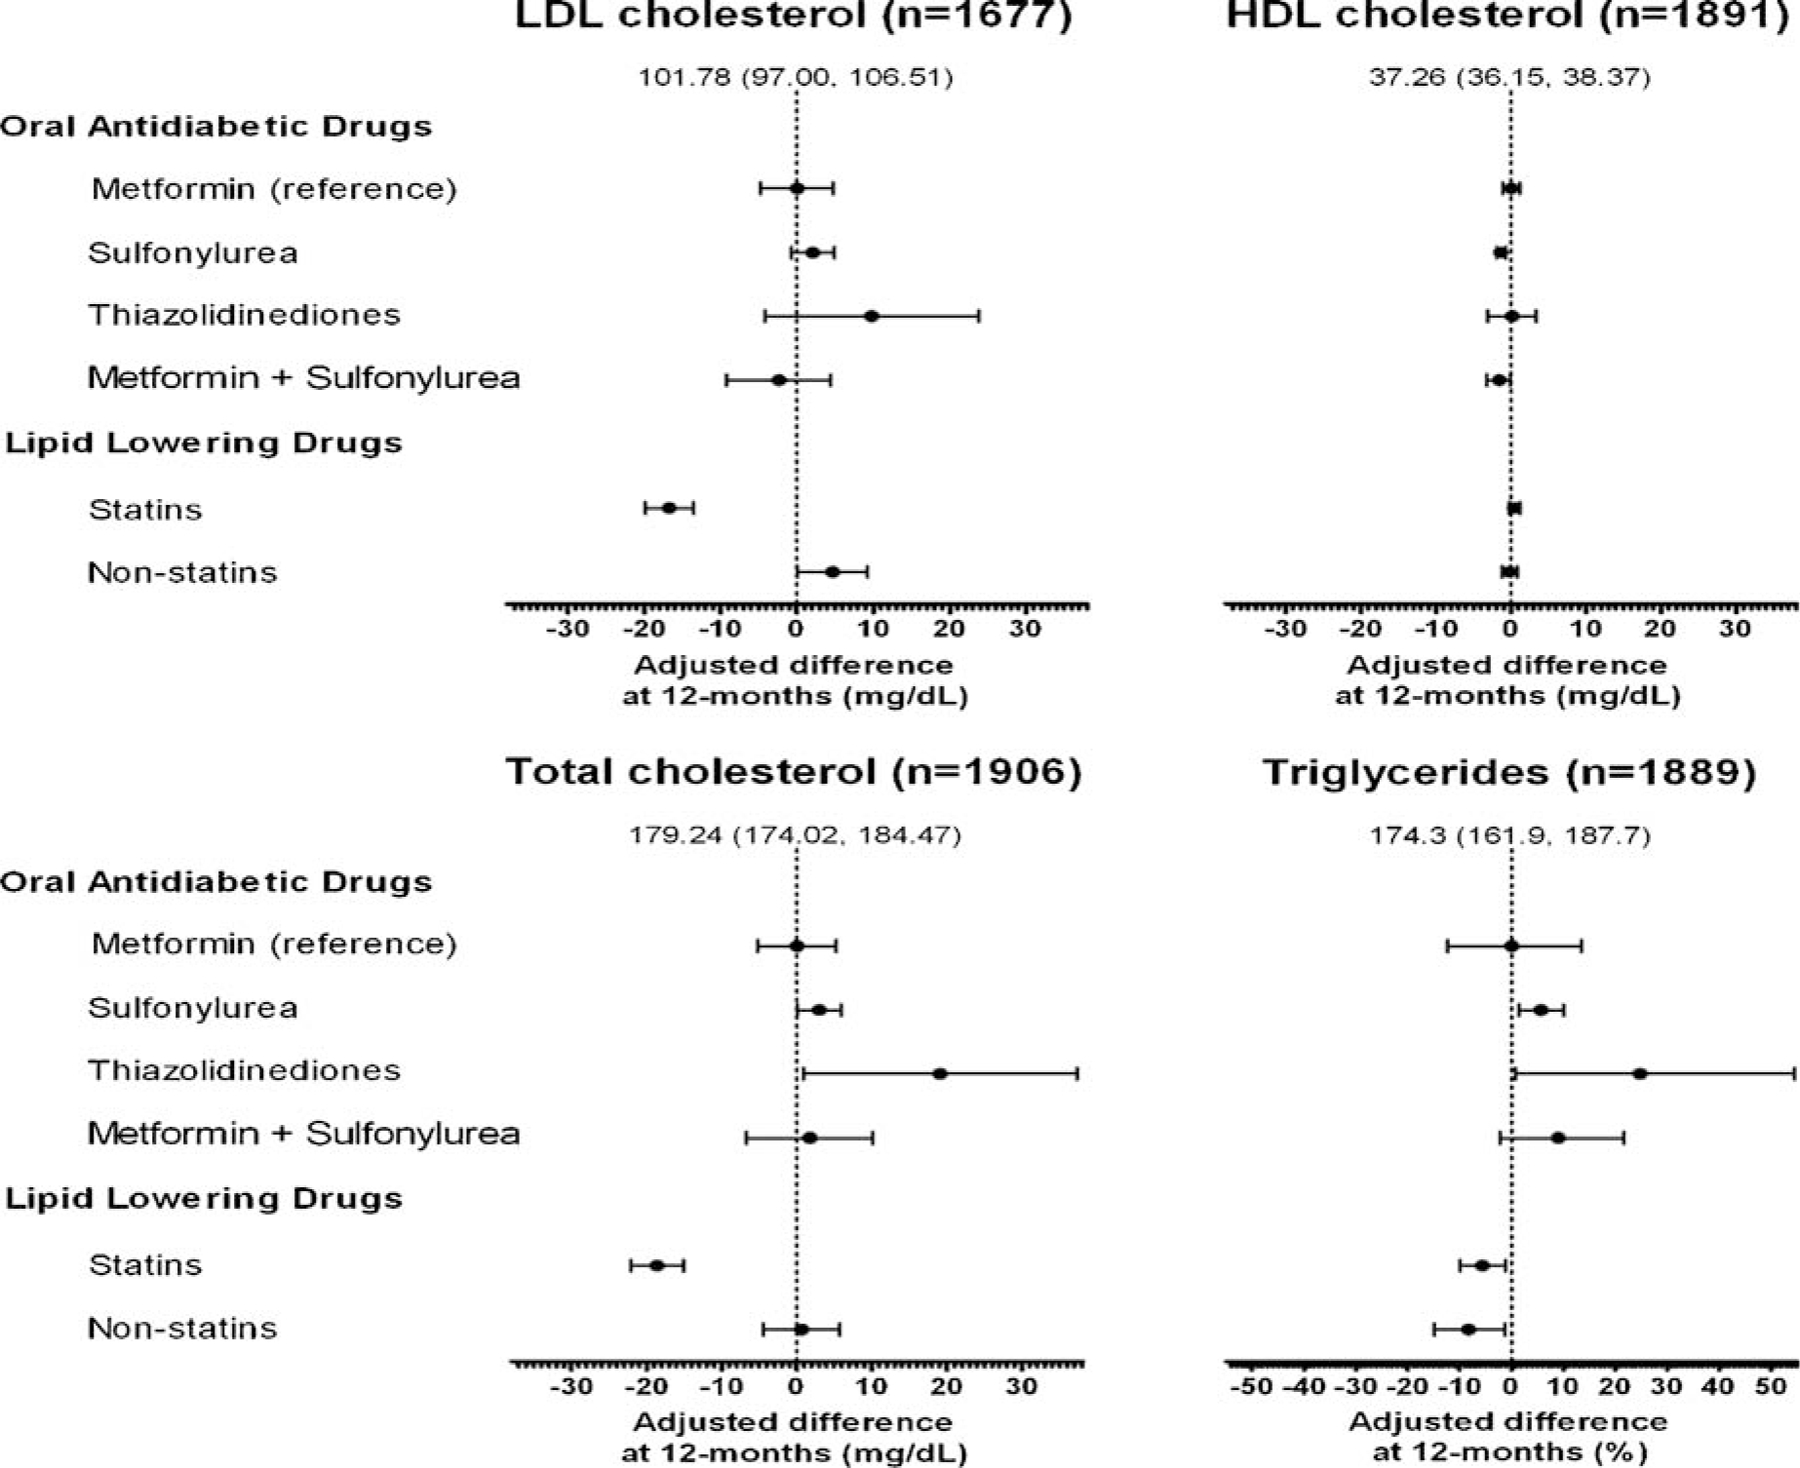
Forest plots of difference in each lipid level compared to the average metformin user for each OAD exposure and with the use of statin and non-statin lipid lowering medication use. *The intercept represents an average white male metformin user without cardiovascular disease, not using any lipid lowering medication, who entered the cohort in 2000 and adjusted for the average baseline HbA1c, total cholesterol, HDL, and triglycerides
LDL (n = 1677 patients).
Among metformin users LDL decreased from a baseline median of 103.0 mg/dl (IQR 83.0, 125.0) to 92.0 mg/dl (IQR 75.0, 113.4) at 12 months. The intercept in the linear regression model was 101.8 (95%CI: 97.0, 106.5) mg/dl. The 12-month LDL in other exposure groups did not differ significantly from metformin users (adjusted difference in 12-month LDL: sulfonylurea 2.0 [95%CI: −0.74, 4.87; p = 0.148] mg/dl; thiazolidinediones 9.7 [95%CI: −4.22, 23.77; p = 0.171] mg/dl; metformin + sulfonylureas −2.40 [95%CI: −9.23, 4.43; p = 0.49] mg/dl). Statin users at 12 months had a 16.7 mg/dl lower LDL (95%CI: −19.89, −13.50; p < 0.0001) than non-statin users.
When we restricted analysis to those not using any LLM in the baseline period or at the time of the 12-month lipid profile (n = 323 [metformin = 159; Met + Sul = 15; sulfonylurea = 147; thiazolidinedione = 2]). The results were essentially unchanged for the comparison of sulfonylurea and Met + Sul groups. Thiazolidinedione users (n = 2) were too small for any meaningful comparisons.
HDL (n = 1891).
Metformin users had a median baseline and 12-month HDL of 35.0 (IQR 30.0, 33.0) mg/dl and 37.0 (IQR 31, 34.0) mg/dl, respectively.
The intercept for 12-month HDL was 37.26 mg/dl (95%CI: 36.15, 38.37). Compared to metformin, use of a sulfonylurea was associated with a significantly lower 12-month HDL by 1.36 mg/dl (95%CI: −2.01, −0.71; p < 0.0001). Combination metformin + sulfonylureas use was also associated with a lower 12-month HDL (1.59 mg/dl; 95%CI: −3.00, −0.17; p = 0.028). No other differences in 12-month HDL were statistically significant.
Total cholesterol (n = 1906).
Metformin users had a median baseline total cholesterol of 182.0 (IQR 158.0, 207.0) mg/dl and 12-month total cholesterol of 165 (IQR 144.0, 190.0) mg/dl. The intercept for total cholesterol level was 179.2 mg/dl (95%CI: 174.0, 184.5). Compared to metformin, the use of a thiazolidinedione was associated with a higher 12-month total cholesterol by 19.08 mg/dl (95%CI: 0.85, 37.30; p = 0.040). Use of statins was associated with an 18.58 mg/dl lower total cholesterol (95%CI: −22.08, −15.08; p < 0.0001).
Triglycerides (n = 1889).
Metformin users had a median TG measurement at baseline of 185.0 (IQR 129.0, 269.0) mg/d; and at 12 months of 155.0 (IQR 113.0, 218.0) mg/dl. Comparisons are reported as a percent increase or decrease compared to metformin users. The intercept for TG at 12 months was 174.3 mg/dl (95%CI: 161.9, 187.7). Users of sulfonylureas had a 12-month TG 5.7% (95%CI: 1.52%, 10.0%; p = 0.007) greater than metformin users; users of thiazolidinediones had TGs 24.8% (95%CI 0.71, 54.54; p = 0.043) greater than metformin users. TGs of combination metformin + sulfonylureas users were not statistically different from metformin users. Statin use at 12 months was associated with TGs that were 5.62% (1.19%, 9.84%; p = 0.014) lower and non-statin LLM was associated with an 8.3% reduction (1.33%, 14.80%; p = 0.021) in TGs.
DISCUSSION
Features of dyslipidemia among patients with diabetes are common and guidelines recommend treatment for elevated LDL and TG levels and low HDL cholesterol levels.15,16 However, according to the NHANES 1999–2000, only 3% of patients with diabetes had all lipid levels within target range.17
Our study indicates that after initiation of OAD regimens, the median time to initiation of LLMs for those not on LLMs at baseline was approximately 2 years and similar among regimens. After 12 months of therapy, metformin use resulted in more favorable lipid levels compared to sulfonylurea or thiazolidinedione (predominately rosiglitazone) use, independent of use of LLMs. Substantially larger favorable lipid changes were observed with statin use. Modest effects on TGs were seen with both statin and non-statin LLMs. The improvement in most lipid parameters at 12 months was likely the result of both increasing use of LLM over time (Table 2) as well as improvement in glycemic control associated with all OADs, and weight associated with metformin.18
Our results are consistent with the systematic review and meta-analysis of Bolen et al.7 who reported that thiazolidinediones increased LDL by 10 mg/dl and sulfonylureas had minimal effects on LDL cholesterol. Our findings complement previous data in that these effects endure at 12 months and are reported in comparison with metformin. Our results regarding OAD effects on TGs are also similar to those reported by Bolen. She reported that only rosiglitazone and second-generation sulfonylureas increased TG levels compared to either placebo or metformin. We also found significant elevations in TGs levels with thiazolidinediones and sulfonylureas compared to metformin. The changes in lipid levels due to OADs, however, were minimal compared to the large changes in total cholesterol and LDL associated with statins. The results of LDL and total cholesterol lowering effects we report are similar to the cholesterol reductions seen in large randomized trials (on the order of 20%).19,20 These types of data show how observational studies can complement and extend findings from clinical trials because they demonstrate the effects of medications in real world circumstances and among patients who may be older and have multiple co-morbidities.
Our study has some limitations. First, information on baseline covariates, predominantly HbA1c, was missing in a large number of patients. This is a common problem in retrospective studies where not all variables of interest were measured. Although there were no major differences in measured characteristics from our primary study cohort compared with the full cohort, differences in other unmeasured characteristics could introduce selection bias. However, our sensitivity analyses found similar results to our primary analysis. Second, in our study we utilized pharmacy refill data as a proxy for medication taking. While prescription fills have been shown to be a good proxy for medication use, this method may result in exposure misclassification.21 Third, certain LLMs, such as niacin and fish oils, are also available over the counter and may have been used by those classified as not using a LLM. Non-service connected veterans pay $8.00 co-pay for a 30-day supply of medications. However, for veterans with service connection, the co-pay is often waived. Thus, this type of misclassification is likely small but could bias our risk estimates towards the null. Finally, our study was limited to veterans with diabetes and the extrapolation of our findings to other populations must consider this caveat.
In conclusion, we demonstrated no significant differences in the time to initiation of LLMs between incident OADs. However, metformin use resulted in more favorable lipid levels at 12 months compared to either sulfonylurea or thiazolidinediones. Taken together, these observations indicate that among the most commonly used OAD regimens; metformin has the least detrimental effects on lipid levels. Additional, large, long-term comparative studies are needed to determine if these favorable changes in lipid levels for metformin are reflected in reduced incidence of clinical end points, such as myocardial infarction, and cardiovascular mortality.22
Supplementary Material
Supplemental Table 1. Definition of Cardiovascular disease
Supplemental Table 2. Characteristics at index date of incident OAD users who are in the full lipid cohort Please note: Wiley-Blackwell are not responsible for the content or functionality of any supporting materials supplied by the authors. Any queries (other than missing material) should be directed to the corresponding author for the article.
KEY POINTS.
Effects of oral antidiabetic drugs (OADs) on lipids may influence cardiovascular outcomes.
Time to Lipid Lowering medication initiation was similar for metformin and sulfonylurea and combination metformin + sulfonylurea users.
Compared to metformin users, 12-month HDL cholesterol was lower and triglycerides were higher for sulfonylurea users; triglycerides were also higher for thiazolidinedoine users compared to use of metformin.
ACKNOWLEDGEMENTS
This project was funded under Contract No. 290-05-0042 from the Agency for Healthcare Research and Quality, US Department of Health and Human Services as part of the Developing Evidence to Inform Decisions about Effectiveness (DEcIDE) program. The authors of this report are responsible for its content. Statements in the report should not be construed as endorsement by the Agency for Healthcare Research and Quality or the US Department of Health and Human Services. Dr. Roumie was supported by a VA Career Development Award (04-342-2).
Footnotes
CONFLICT OF INTEREST
The authors declare no conflict of interest.
SUPPORTING INFORMATION
Additional supporting information may be found in the online version of this article:
REFERENCES
- 1.Garber AJ, Karlsson FO. Treatment of dyslipidemia in diabetes. Endocrinol Metab Clin North Am 2001; 30: 999–1010. [DOI] [PubMed] [Google Scholar]
- 2.Ginsberg HN, Tuck C. Diabetes and dyslipidemia. Heart Fail Monit 2001; 2: 14–20. [PubMed] [Google Scholar]
- 3.Howard BV, Howard WJ. Dyslipidemia in non-insulin-dependent diabetes mellitus. Endocr Rev 1994; 15: 263–274. [DOI] [PubMed] [Google Scholar]
- 4.Dyslipidemia Laakso M., morbidity, and mortality in non-insulin-dependent diabetes mellitus. Lipoproteins and coronary heart disease in non-insulin-dependent diabetes mellitus. J Diabet Complications 1997; 11: 137–141. [DOI] [PubMed] [Google Scholar]
- 5.Stern MP, Haffner SM. Dyslipidemia in type II diabetes. Implications for therapeutic intervention. Diabetes Care 1991; 14: 1144–1159. [DOI] [PubMed] [Google Scholar]
- 6.Buse JB, Tan MH, Prince MJ, Erickson PP. The effects of oral anti-hyperglycaemic medications on serum lipid profiles in patients with type 2 diabetes. Diabetes Obes Metab 2004; 6: 133–156. [DOI] [PubMed] [Google Scholar]
- 7.Bolen S, Feldman L, Vassy J, et al. Systematic review: comparative effectiveness and safety of oral medications for type 2 diabetes mellitus. Ann Intern Med 2007; 147: 386–399. [DOI] [PubMed] [Google Scholar]
- 8.International Classification of Diseases, Ninth Revision, Clinical Modification Public Health Service, US Dept of Health and Human Services: Washington, DC, 1988. [Google Scholar]
- 9.Hynes DM, Koelling K, Stroupe K, et al. Veterans’ access to and use of medicare and veterans affairs health care. Med Care 2007; 45: 214–223. [DOI] [PubMed] [Google Scholar]
- 10.Ray WA. Evaluating medication effects outside of clinical trials: new-user designs. Am J Epidemiol 2003; 158: 915–920. [DOI] [PubMed] [Google Scholar]
- 11.Komossa K, Rummel-Kluge C, Hunger H, et al. Ziprasidone versus other atypical antipsychotics for schizophrenia. Cochrane Database Syst Rev 2009; CD006627. [DOI] [PMC free article] [PubMed]
- 12.Meyer JM, Koro CE. The effects of antipsychotic therapy on serum lipids: a comprehensive review. Schizophr Res 2004; 70: 1–17. [DOI] [PubMed] [Google Scholar]
- 13.Lin D, Wei L. The robust inference for the Cox proportional hazards model. J Am Stat Assoc 1989; 84: 1074–1078. [Google Scholar]
- 14.Huizinga MM, Roumie CL, Elasy TA, et al. Changing incident diabetes regimens: a Veterans Administration cohort study from 2000 to 2005. Diabetes Care 2007; 30: e85. [DOI] [PubMed] [Google Scholar]
- 15.Executive summary: standards of medical care in diabetes—2009. Diabetes Care 2009; 32 (Suppl 1): S6–S12. [DOI] [PMC free article] [PubMed] [Google Scholar]
- 16.Standards of medical care in diabetes—2009. Diabetes Care 2009; 32 (Suppl 1): S13–S61. [DOI] [PMC free article] [PubMed] [Google Scholar]
- 17.Jacobs MJ, Kleisli T, Pio JR, et al. Prevalence and control of dyslipidemia among persons with diabetes in the United States. Diabetes Res Clin Pract 2005; 70: 263–269. [DOI] [PubMed] [Google Scholar]
- 18.Huizinga MM, Roumie CL, Greevy RA. Glycemic and weight changes after persistent use of incident oral diabetes therapy; a veterans administration retrospective cohort study. Pharmacoepidemiology and Drug Safety; in press [DOI] [PubMed]
- 19.Shepherd J, Cobbe SM, Ford I, et al. Prevention of coronary heart disease with pravastatin in men with hypercholesterolemia. West of Scotland Coronary Prevention Study Group. N Engl J Med 1995; 333: 1301–1307. [DOI] [PubMed] [Google Scholar]
- 20.Wright RA, Flapan AD, McMurray J, et al. Randomised trial of cholesterol lowering in 4444 patients with coronary heart disease: the Scandinavian Simvastatin Survival Study (4S). Lancet 1994; 344: 1383–1389. [PubMed] [Google Scholar]
- 21.Grymonpre R, Cheang M, Fraser M, Metge C, Sitar DS. Validity of a prescription claims database to estimate medication adherence in older persons. Med Care 2006; 44: 471–477. [DOI] [PubMed] [Google Scholar]
- 22.Institute of Medicine. Initial National Priorities for Comparative Effectiveness Research The National Academies Press: Washington, DC, 2009. [Google Scholar]
Associated Data
This section collects any data citations, data availability statements, or supplementary materials included in this article.
Supplementary Materials
Supplemental Table 1. Definition of Cardiovascular disease
Supplemental Table 2. Characteristics at index date of incident OAD users who are in the full lipid cohort Please note: Wiley-Blackwell are not responsible for the content or functionality of any supporting materials supplied by the authors. Any queries (other than missing material) should be directed to the corresponding author for the article.