Figure 4.
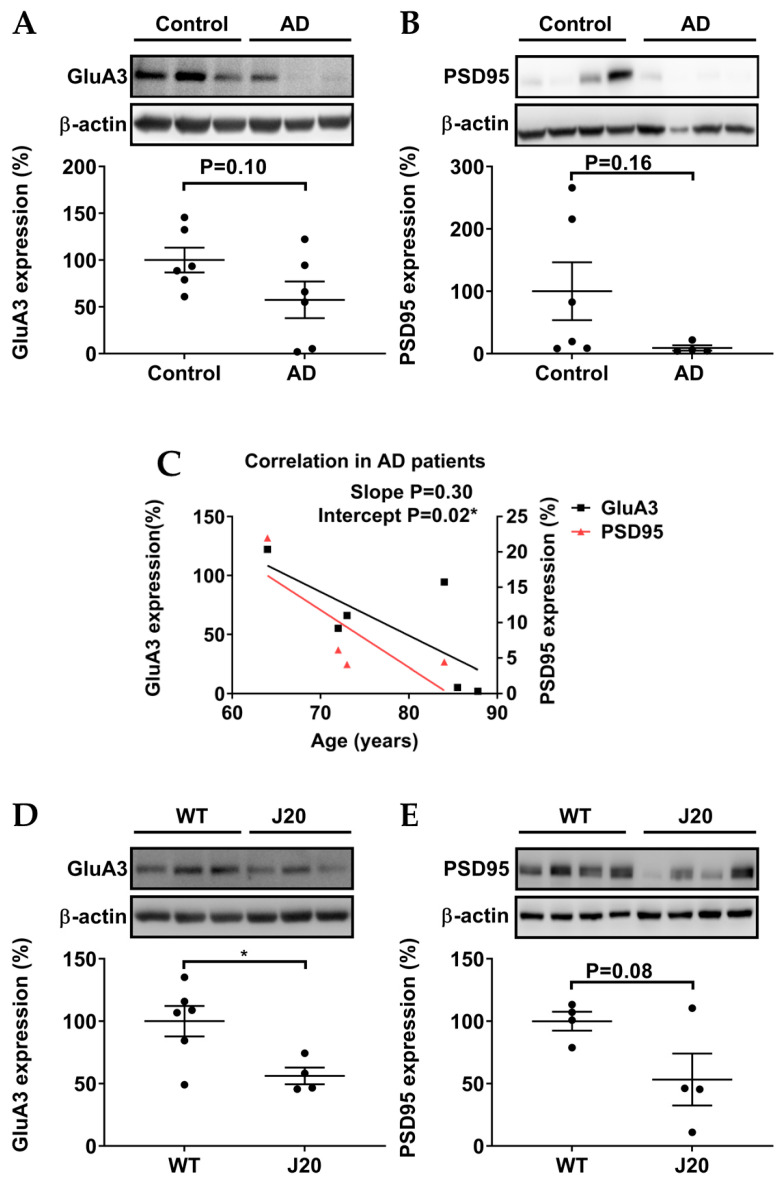
Relative expression levels of GluA3 and PSD95. (A,B) In postmortem samples of AD patients, the protein expression of GluA3 and PSD95 tended to be downregulated. (C) Protein expression of GluA3 and PSD95 tended to decrease with age in postmortem samples of AD patients and healthy controls. (D,E) In the experimental AD model J20 mice, the protein expression of GluA3 was significantly downregulated, whereas the protein expression of PSD95 tended to be downregulated. Quantification and representative blots are shown. Healthy controls n = 6; AD patients n = 4–6; WT mice = 4–5; J20 mice = 4. Data are expressed as mean ± SEM. Unpaired student’s T test and linear regression were used to study protein expressions and the trends of protein expressions with age, respectively (* p ≤ 0.05).

