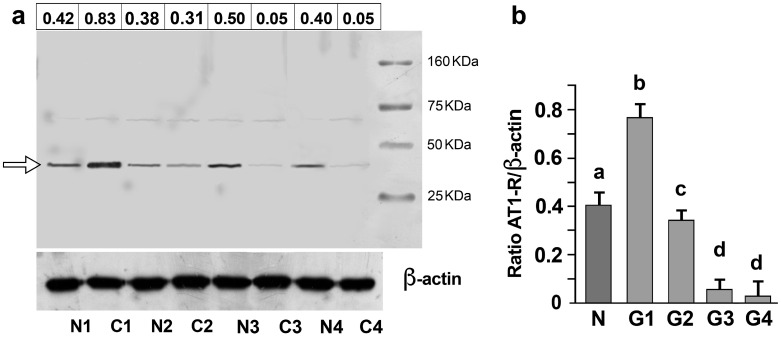
Figure 2.
Expression of the AT1-R protein in the kidney tissue. (a) SDS analysis, followed by immunoblotting, performed on matched pairs of normal (N1, N2, N3, and N4) and cancerous (C1 (G1), C2 (G2), C3 (G3), and C4 (G4)) kidney samples. In this experiment, the same protein concentration (100 µg) was loaded on the gel. A band of molecular mass of approximately 41 kDa (arrow) was detected. For each sample lane, the densitometric quantification of the AT-1R band refers to the mean data from n = 3 different blots. Mean values have been normalized concerning the corresponding β-actin band. (b) Densitometric quantification of the AT-1R band obtained by immunoblotting analysis performed on 40 normal (N) and 42 tumoral kidney tissues classified as G1 (n = 6), G2 (n = 9), G3 (n = 13), and G4 (14). Values refer to the mean data ± SD from different blots and have been normalized concerning the corresponding β-actin band. Molecular weight markers are shown on the left (statistical analysis: p < 0.001 by one-way ANOVA). Values with shared letters are not significantly different according to Bonferroni–Dunn post hoc tests.

