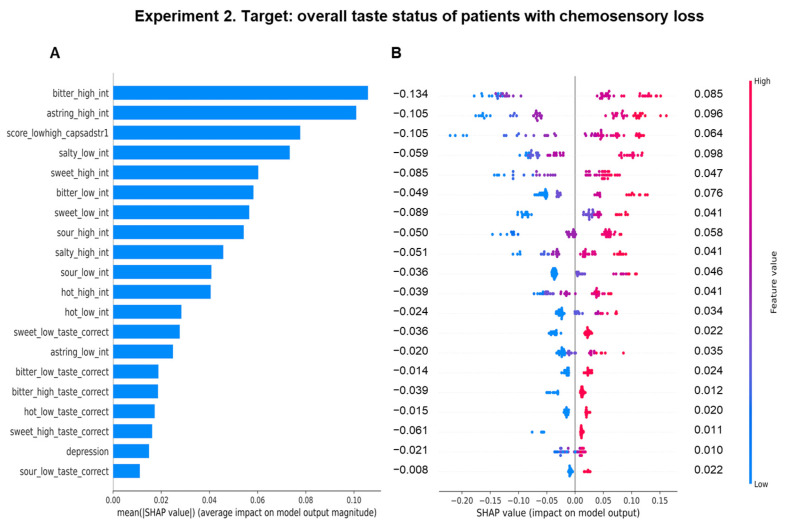
Figure 4.
Importance and impact of the sensory, clinical, and anthropometric features on the overall taste status prediction determined with random forest regressor in patients with chemosensory loss. Importance of features in the training model to understand the overall taste status (A). The Y axis represents the order of importance of the features, while the average impact on the model output is represented on the X axis. The SHAP summary plot in patients with chemosensory loss (B). The left-hand side of the Y axis represents the descending order of importance; the X axis represents the SHAP value, i.e., the impact on the output model. The color represents the feature value: high values have a pink color, while low values have a blue one. Numbers indicated for each line represent the mean of the positive impact values and the negative impact of each feature.

