

Abstract
The sealing performance of a brush seal is studied in this article. At present, the mostly used model to analyze the performance of a brush seal is porous medium model in which the effect of bristle deformation is not considered. Here, a combined numerical method is proposed. First, the deformation of bristle is calculated in a fluid–solid coupling model with a simplified bristle model, and then the results of the bristle deformation is imported to a porous media model as the boundary conditions. More accurate media flow and leakage variation law of the brush seal are obtained with this calculation model.
Keywords: Brush seal, bristle deformation, porous medium, fluid–solid coupling, numerical analysis
Introduction
The research on the sealing problems is of great significance in the design of turbines and aircraft engines, with the constant pursuit of high thrust ratio and low fuel consumption. A large number of experimental studies give information that the brush seal not only has good sealing characteristics, high sealing efficiency, but also has low manufacturing cost and simple structure.1–6 The leakage of the brush seal is only 10%–20% of the same level of a labyrinth seal. The actual application shows that by just using a brush seal instead of a traditional labyrinth seal at one or several critical parts can make the engine’s thrust increase by 1%–3% and the fuel consumption decrease by 3%–5%.7–9 Therefore, brush seals have great potential for improving engine performance.10,11
The specific structure of a brush seal ring consists of a front baffle, a back baffle of uniform thickness, and length bristles, as shown in Figure 1. 12 Due to the non-uniformity of the interspaces between the bristles, the incoming flow becomes non-uniform and has a self-sealing effect, like comb teeth, in countless labyrinth seals during fluid flow. Because of the special seal structure of brush seals, scholars have proposed several theoretical models for numerical simulation. The uniform staggered pipe model was suggested by Kundsen in 1958, 13 the square staggered column model proposed by Chupp in 1991, 14 and the hexagonal staggered pipe model proposed by Holle in 1992. 15 These models were all cross-flow models and considered the bristle bundle region as a cross flow to analyze the pressure field in this region. They were all two-dimensional (2D) models without considering the effects of space effects and rotation. The effective thickness model was proposed by Chupp in 1996. 16 The block flow model was a semi-empirical method based on the test data of the test. The porous media model was proposed by Chew et al. 17 It considered the bristle region as a porous medium, and the flow resistance term due to friction was added to the model compared with the conventional non-porous medium. Dogu and Aksit used the porous media model to study the leakage characteristics of typical single-stage brush seal. 18 Cao et al. 19 conducted experimental and numerical studies on the leakage flow characteristics of brush seals in their early use. Li 20 studied the brush seal leakage characteristics and friction heat effects 21 based on the non-Darcian porous media model and experimental measurement methods.
Figure 1.

Brush seal ring. (a) Brush seal ring and (b) structure of the brush.
In the actual engineering application, the working condition of the brush seal is complicated and the area of the bristle bundle cannot be a stable flow field space. The flexible characteristics of the bristle leads to the deformation under the pressure differences and axial offset will occur, and it will affect the performance of the entire brush bundle, which in turn affects the sealing performance of the brush seal. However, theoretical models mentioned above did not consider the influence of the deformation of the bristles under pressure difference on the leakage. The change of the baffle clearance caused by the bristles deformation and the porosity of the bristle bundles affect the leakage. Nowadays, numerical analysis simulations that consider the fluid–structure interaction effect rarely occur. 22 This article considers the fluid–solid coupling effect of bristle deformation and combines the results with the porous media model, a more complete numerical analysis model is obtained, which provides a reliable theoretical support for subsequent experiments and engineering applications.
Porous media model of a brush seal
Because the bristles of a brush seal are closely arranged, it is difficult to establish a complete bristle model during numerical analysis. The most commonly used simulation is an equivalent porous media model. 5 The calculation model used in this article is re-normalization group (RNG) k–ε model with certain corrections. The model considers the complex flow of gas rotation in the brush seal flow field and the renormalization RNG k–ε model is not only related to the flow condition but also to a spatial coordinate function, thus it can solve the brush seal flow more accurately. The specific idea to use the porous media model method is to add the viscous drag item and the inertia resistance item in the flow control equation, and then to determine the viscous drag coefficient and the inertial drag coefficient in three orthogonal directions. These drag coefficients are related to the bristle bundle size parameter, see simplified fluid control equation as formula (1), calculation of equation of viscous drag coefficient and inertia drag coefficient is shown in formulas (2) and (3)
| (1) |
| (2) |
| (3) |
Usually, and are based on the experimental data, but they can also be determined according to the empirical formulas, in which they are directly related to the diameter of the bristle and the porosity of the porous medium surface (the porosity in the section perpendicular to a certain direction), in three directions can be calculated in formulas (4)–(6) 20
| (4) |
| (5) |
| (6) |
In the brush seal ring, where the size parameters are determined, and the parameters n, , , are also determined according to processing and assembly dimensions. Then, the brush bundle thickness B uniquely determines the surface porosity of the brush bundle and thus determines the values of and .
The thickness of the brush bundle B is not only determined by the design parameters such as the diameter and the number of the bristle but also related to the arrangement state of the bristle bundles. In the non-working state, the bristle bundles are loosely arranged, its thickness is at the maximum, and the porosity is also the largest. After increasing the pressure difference between the inlet and outlet, the bristle is compressed and the value B changes. The greater the pressure difference is, the smaller the bristle bundle thickness is, and lower the porosity becomes. The thickness of the brush bundle reaches a minimum value and the porosity value does not change even if the pressure difference continues to increase. These arrangements are shown in Figure 2. 23
Figure 2.

Brush arrangements in different pressure states.
In the previous studies, the bristle bundle thickness was determined by an empirical parameter between non-pressured state and maximum pressure state for the situation with d = 0.05–0.1 5mm, Δp=0–1.5 MPa. However, this method is limited by the ignorance of the bristle deformation on thickness, which results in a certain deviation of this empirical parameter.
The method used in this article is to establish a two-way fluid–solid coupling model between brush bristle and flow field to numerically calculate the change in shape and position of brush bristle during the constant pressure difference working process, and then to calculate the brush bundle thickness and porosity. Thus, the viscous drag coefficient and inertial drag coefficient can be calculated to determine the key parameters in the porous media model.
Fluid–solid coupling model of brush seal
Because of the large number of circumferentially symmetric bristles, a simplified model is used here. The model includes two rows and six columns of bristle, and the model size is shown in Figure 3. The material used for brush is nickel-based super alloy, its elasticity modulus is 213.7 GPa, its Poisson’s ratio is 0.29. Under actual working conditions, brush seal would have blown down effect that affects the effective sealing gap due to the radial runout of the rotating shaft, excessive wear, and timely change of working conditions. Only the blow down effect caused by the back baffle is considered in this article, which will be specifically analyzed below.
Figure 3.

Simplified fluid solid coupling model.
The modeling process is as follows. First is to establish the solid model and the fluid model together in Workbench. In the fluid–solid coupling calculation, the actual deformation amount of the bristles is related to the pressure ratio and the back baffle protection height. In this article, because the calculated pressure is relatively small, the amount of deformation of the bristle is small, and the back baffle protection height is sufficient. In this case, it is considered that there is no significant influence on the deformation of the filament. Then, the solid and fluid models are separately suppressed during the process of meshing. In the fluid–solid coupling calculation, the main calculation module used is system coupling that transfers the data between solid model and fluid model (Figure 4). 24
Figure 4.

Brush seal model in Workbench. (a) Calculation process and (b) calculation model.
To ensure the information transfer between solid and fluid models on the coupling surface without generating negative volume grids in the mesh deformation, tetrahedral cells are used in both solid and fluid domains. In the finite element (FE) calculation, nitrogen is used as the fluid medium and the RNG k–ε turbulence model is adopted, then the boundary conditions are set, which includes the pressure and temperature of inlet and outlet, the fluid solid coupling surface and dynamic mesh, the step of time, and the number of time steps.
The fluid–solid coupling surface consists of circumferential cylindrical surfaces and free ends of each brush wire. The type of coupling surface is set to system coupling in transient solver. The circumferential wall of the flow field is set to the dynamic mesh area to follow the deformation motion of the coupling surface. The rotor surface is set as a wall without slip boundary condition. The dynamic mesh model is used to simulate the change of flow shape due to boundary movement. Solid grids and fluid grids are shown in Figure 5.
Figure 5.

(a) Solid and (b) fluid domain grids.
Although we can calculate the leakage rate directly under the current fluid–solid coupling model, it is worth noting that calculating the leakage rate of the two rows and six columns of models is not equivalent to calculating the leakage rate of the entire brush ring. When the data are introduced into the brush ring, due to the large number of brush rows on the brush ring structure, we were not prepared to calculate how many two rows and six columns models are there, as is shown in Figure 6, and including the calculation of the single model into the brush ring will cause error amplification, causing a large deviation. According to the above two points, this article uses the combination of fluid–solid coupling model and porous media model to calculate.
Figure 6.

Overall schematic of the brush ring. (a) Velocity streamline and (b) local magnification of velocity.
The amount of the brush deformation is imported back to the new porous medium model when the fluid solid coupling model converges. So, the sealing characteristics of brush seal under the condition of brush deformation are determined.
Results and discussion
Fluid analysis
A cross section of the whole brush wire is established along the direction of the brush wire to observe the distribution of physical quantities on the cross section. Figure 6 gives information of velocity streamlines and velocity vectors of the flow field.
As shown in Figure 7, the overall velocity streamline diagram is similar to the porous media model. The flow of medium fluid is concentrated in the lower part of the brush. The local magnification velocity vector diagram on the right enlarges the flow field of the lower part of the brush. It can be seen that the general trend of the fluid flowing in the brush bundle is in the direction of outlet. There is a significant increase in the speed at the corner of the back baffle, the maximum speed of the entire flow process also appears here. The flow field will be affected by the thickness of the brush bundle and the height of the back baffle protection height. The direction and motion of the fluid near the bristle will change in various directions, and it appears in a state of disordered even flow in the direction perpendicular to the pressure drop, this is because of the blocking effect of brush bundle and the flow of medium in the brush appears irregular around the columns. This irregular flow produces energy dissipation, the leakage flow at the outlet is then reduced, and the brush seal works effectively.
Figure 7.

Velocity streamline and local magnification velocity vector diagram. (a) Velocity vector and (b) velocity streamline.
At the gas outlet, the speed has a significant increase and reaches the maximum value of the whole flow phase which is consistent with the analysis in models mentioned in other studies, called throttling phenomenon. It is due to the sudden decreasing of the cross section, which leads to the pressure reducing, and then the speed increasing, which becomes the main source of leakage. This result can be observed more clearly in a cloud picture without brush wire, as shown in Figure 8.
Figure 8.

Velocity vector and streamline diagram.
To ensure that the two sections of the previous setup remain unchanged, the pressure field is also analyzed. The pressure cloud image is shown in Figure 9. From this figure, the general rule of the pressure field in the brush can be analyzed. If the influence of the position of the brush is not considered, the pressure distribution in the brush is consistent with the previous porous medium model. The pressure from left to right gradually decreases, the pressure drop is mainly concentrated in the lower part of the brush, and the position of the maximum pressure gradient is at the gap of the back plate. Due to the structure of the back baffle, brush seal has a certain radial pressure difference, which produces blow down effect. The influence of this part on the deformation of the bristles is also considered in the fluid–solid coupling calculation. Then, we take a straight line through the entire brush bundle, observe the change in pressure as shown in Figure 10, and obtain the law of pressure gradient change, which is consistent with the previous analysis.
Figure 9.

Pressure cloud picture.
Figure 10.

Change line diagram of pressure variation in X direction in brush.
Solid analysis
The solid part is calculated separately from the fluid part, and the final calculation result is obtained by feedback exchange of data between each other, as shown in Figure 11.
Figure 11.

Fluid–solid coupling calculation process.
The main objective of the analysis of the solid part is to obtain the parameters of the deformation of the bristle. Because the model selected here is simplified, and the solution of the solid brush part is calculated as a transient problem, the change of the whole brush cannot be obtained by only one deformation amount, which needs to be within the whole calculation period, and the deformation of brush wire can only be analyzed synthetically. First, to consider the deformation results of the whole solid computing domain at the end of the iteration time, that is when the time point is 1.0 s, as shown in Figure 12.
Figure 12.

Brush deformable diagram at 1.0 s. (a) Brush deformable and (b) brush deformable from A direction.
In Figure 12(a), the deformation of the brush wire is clearly shown. It can be observed that the deformation of the brush wire is mainly concentrated on the lower part of the brush and the maximum deformation of brush wire is near the contact surface in outlet. The top of the brush is fixed, like the fixed end of the cantilever beam model, and the closer to the bottom, the length of the brush is increasing, the greater the bending deformation under uniform load is. The deformation of the brush wire is observed from the plane view of the bottom of the brush wire as shown in Figure 12(b). The transparent cylinder is the original place of the brush. The deformation is about 1/2 diameter of the brush wire and the maximum deformation occurs at the exit of the back plate. It can be seen that the deformation of the brush has a certain influence on the thickness of the brush.
In fact, the deformation of the brush bundle is not a stable value, whether in numerical analysis or on the application of the brush seal. It is actually a changing process due to the impact of air flow. A brush bundle with a clear deformation is taken from the calculation from the beginning of the calculation to the end of the 1.0 s. The maximum deformation during 0–1.0 s of brush bundle is shown in Figure 13.
Figure 13.

Maximum amount of deformation of a single brush during 1.0 s.
Figure 13 shows that the deformation of the brush in the whole period of calculation is divided into two stages. At the beginning when the pressure is loaded, the bristle has a rapidly increasing deformation, which is due to the initial space in the brush. Under the action of pressure, the space is compressed and reduced, and the bundle are deformed, therefore, there is a large gradient curve at the beginning of deformation in this figure. Then, because of the instability of the air flow and the material of the brush bundle itself has greater elasticity, when the medium flows through, it will do work on the brush bundle, and part of the energy will be stored in the brush bundle in the form of elastic potential energy. After accumulating enough potential energy in the first stage, it will cause instability in the second stage, the deformation of the brush becomes relative stable. This is the second stage of the deformation of bristles. Although the deformation of the second stage brush is unstable, it is always oscillating near a fixed value, that is, the average value of the deformation is at a fixed level. Therefore, the average deformation of the brush wire in the second stage can be calculated.
Fluid solid coupling analysis
From the above mentioned models, the fluid–solid coupling model has been used to solve the fluid and solid domains, but we can’t get an exact solution about the variation of the leakage due to the influence of the number of filaments. When we use two rows and six column brush model to calculate the leakage of the overall brush ring, there will be a large error, so the combination of the fluid–solid coupling model and the porous medium model is adopted, and the core is to feed back bristle deformation value into the porous medium model. In the previous porous medium model, it is concluded that the gas flow in the brush is mainly concentrated at the height of the 1/2 brush wire, so an average deformation of the brush is set as 0.2 mm to represent the deformation of the brush. Then, the change of the coefficient of porous media is calculated. It is necessary to calculate the resistance coefficient of porous media according to Eugen formulas (4)–(6) and the amount of porosity. The porosity of the brush is only related to the thickness of the brush thickness B after determining the geometric parameters of the bristle. Through the method of fluid solid coupling analysis, the change rule of the value B is numerically analyzed. The formulas (7)–(11) are used to calculate the porosity of the brush and the resistance coefficient under the action of different pressure differences. 20
| (7) |
| (8) |
| (9) |
| (10) |
| (11) |
The viscous resistance coefficient and inertia resistance coefficient before and after the brush deformation are substituted into the steady state fluid analysis model of porous media model. Because these two coefficients defined in fluent are expressed by space vector and the whole brush ring is symmetrical in the center axis, the brush ring at the center angle of the 1/20 at 18° is taken in the calculation, as shown in Figure 14. Then, the leakage of the brush seal is simulated again with the porous medium model. The results are shown in Table 1.
Figure 14.
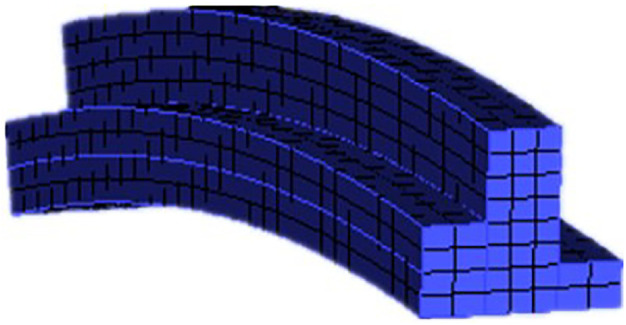
Simplified model diagram of porous media.
Table 1.
Calculation of the leakage considering the deformation of the bristles or not.
| (Mpa) | Deformation (mm) | Porosity | Leakage without deformation (kg/s) | Leakage with deformation (kg/s) | Leakage decreasing with deformation (%) |
|---|---|---|---|---|---|
| 0.2 | 0.12 | 0.602 | 0.156 | 0.143 | 1.3 |
| 0.3 | 0.126 | 0.600 | 0.198 | 0.175 | 2.3 |
| 0.4 | 0.13 | 0.598 | 0.221 | 0.201 | 2 |
Table 1 shows he calculation results under different pressure differences. The second column is the average deformation of the filament after the fluid–solid coupling calculation. The third column is the porosity value calculated after entering formulas (7). Finally, the table shows the calculation results about the leakage without deformation and the leakage with deformation and their differences.
Comparison of experimental data
This numerical analysis is based on the brush seal ring applied in practical engineering. Due to the limitation of experimental conditions, the size and operating parameters of the brush seal ring simulated in this article are obtained by reference to previous experiments. By comparing the experimental data of the leakage test of the brush seal 18 and the simulation data obtained by the two-way rotating dynamic seal experimental device, we obtain the variation law of leakage rate in three cases under different pressure ratios, as shown in Figure 15.
Figure 15.
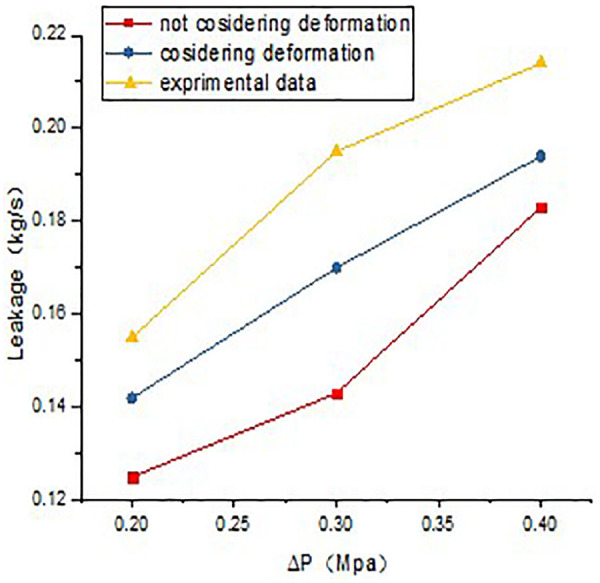
Data contrast diagram.
According to Figure 15, it can be seen that the simulation results are basically close to the data obtained from the experiment. The overall trend is that the leakage is increasing with the increasing of pressure difference. The pressure-leakage line considering the deformation of the brush wire is more close to actual experiment. Therefore, it is considered that the calculation of the leakage of the brush seal is closer to the actual situation using modified porous media model combined with fluid–solid coupling model in this article.
Conclusion
In this article, a new numerical analysis method is proposed for the incomplete theoretical analysis of brush seal in engineering. The leakage performance of the brush seal is analyzed more comprehensively. Through the numerical analysis of this article, the following conclusions can be drawn:
In the flow of the brush seal, the maximum velocity of the medium occurs at the corner of the exit of the back plate. The pressure in the brush is gradually reduced in the direction of the axial direction and the maximum pressure gradient occurs at the exit of the back plate.
The leakage flow of brush seal increases with the increase of pressure difference. The larger the thickness of the brush is, the smaller is the leakage, and also the better is the sealing performance.
The computational model is improved from a single model to a fluid–solid coupling model combined with a porous media model.
Considering the calculated leakage level after wire brushing deformation, the leakage rate is lower than the traditional porous medium model and the error percentage is about 2%. Compared with previous experimental data, the data obtained by this method are more close to the experimental data.
Author biographies
Chang Yue is a Master Student in School of Mechanical and Power Engineering, East China University of Science and Technology, Shanghai, China.
Sun Bitian is a Master Student in School of Mechanical and Power Engineering, East China University of Science and Technology, Shanghai, China.
Zhang Lanzhu is a Professor in School of Mechanical and Power Engineering, East China University of Science and Technology, Shanghai, China. His research interests are leakage mechanism and leak detection.
Appendix 1
Notation
inclination of the bristle arrangement (mm)
d diameter of the bristle (mm)
dp/dx pressure gradient changes
D protection height (mm)
D0 outer diameter of the brush ring (mm)
D1 inner diameter of the brush ring (mm)
n total number of bristles
viscous drag coefficient in i direction
inertial drag coefficient in i direction
εα porosity
tilt angle of bristle (°)
μi average velocity of fluid (m/s)
ρ fluid density (kg/m 3 )
Footnotes
The author(s) declared no potential conflicts of interest with respect to the research, authorship, and/or publication of this article.
Funding: The author(s) disclosed receipt of the following financial support for the research, authorship, and/or publication of this article: This work is supported by National Science Foundation of China (No. 51675183).
ORCID iD: Sun Bitian  https://orcid.org/0000-0002-0940-4525
References
- 1.Chupp RE, Hendricks RC, Lattime SB, et al. Sealing in turbomashinery. J Propul Power 2006; 22(2): 313–349. [Google Scholar]
- 2.Dinc S, Demiroglu M, Tyrnquist N.Fundamental design issues of brush seals for industrial applications. J Turbomach 2001; 124(2): 293–300. [Google Scholar]
- 3.Hpwell GF. Gas turbine engine brush seal application. In: Proceedings of the 26th AIAA joint propulsion conference, Orlando, FL, 16–18 July 1990, paper no. AIAA 2000-3375. [Google Scholar]
- 4.Chew JW, Guardino C.Simulation of flow and heat transfer in the tip region of a brush seal. Int J Heat Fluid Fl 2004; 25(4): 649–658. [Google Scholar]
- 5.Dogu Y, Akslt MF.Brush seal temperature distribution analysis. J Eng Gas Turb Power 2006; 128(3): 599–609. [Google Scholar]
- 6.Pugachev AO, Helm P.Calibration of porous medium models for brush seals. P I Mech Eng A: J Pow 2009; 223(1): 83–91. [Google Scholar]
- 7.Lelli D, Chew JW, Cooper P.Combined three-dimensional fluid dynamics and mechanical modeling of brush seals. J Turbomach 2006; 128(1): 188–195. [Google Scholar]
- 8.Ferguson JG.Brushes as high performance gas turbine seals. In: Proceedings of the ASME 1988 international gas turbine and aeroengine congress and exposition, Amsterdam, 6–9 June 1988, paper no. 88-GT-182. [Google Scholar]
- 9.Pugachev AO, Deckner M.Experimental and theoretical rotor dynamic stiffness coefficients for a three-stage brush seal. Mech Syst Signal Pr 2012; 31: 143–154. [Google Scholar]
- 10.Aslan-zada FE, Mammadov VA, Dohnal F.Brush seal and labyrinth seals in gas turbine applications. P I Mech Eng A: J Pow 2013; 227(2): 216–230. [Google Scholar]
- 11.Thakare MR, Mason JF, Owen AK.Effect of sliding speed and counterface properties on the tribo-oxidation of brush seal material under dry sliding conditions. Tribol Int 2016; 96: 373–381. [Google Scholar]
- 12.Qiu B, Li J.Numerical investigations on the heat transfer behavior of brush seals using combined computational fluid dynamics and finite element method. J Heat Trans: T ASME 2013; 135(12): 122601. [Google Scholar]
- 13.Chupp RE, Johnson RP, Loewenthal RG, et al. Brush seal development for large industrial gas turbines. In: Proceedings of the 31st AIAA joint propulsion conference and exhibit, San Diego, CA, 10–12 July 1995, paper no. AIAA 95-3146. [Google Scholar]
- 14.Turner MT, Chew JW, Long CA.Experimental investigation and mathematical modeling of clearance brush seal. J Eng Gas Turb Power 1998; 120: 573–579. [Google Scholar]
- 15.Qiu B, Li J, Yan X.Investigation into the flow behavior of multi-stage brush seals. P I Mech Eng A: J Pow 2014; 228(4): 416–428. [Google Scholar]
- 16.Chupp RE, Howell GF, Dowler CA. Simple leakage flow model for brush seals. In: Proceedings of the 27th AIAA joint propulsion conference, Sacramento, CA, 24–26 June 1991, paper no. AIAA 91-1939. [Google Scholar]
- 17.Chew JW, Lapworth BL, Millener PJ.Mathematical modeling of brush seals. Heat Fluid Flow 1995; 16: 493–500. [Google Scholar]
- 18.Dogu Y, Aksit MF.Effects of geometry on brush seal pressure and flow fields—part I: front plate configurations. J Turbomach 2006; 128(2): 367–378. [Google Scholar]
- 19.Cao G, Ji H, Ji G.Experimental and numerical study on the characteristics of initial use of brush seals. Propelling Technol 2010; 31(4): 478–482, 489. [Google Scholar]
- 20.Li J, Qiu B, Feng Z.Experimental and numerical investigations on the leakage flow characteristics of the labyrinth brush seal. J Eng Gas Turb Power 2012; 134(10): 102509. [Google Scholar]
- 21.Dogu Y, Bahar AS, Sertcakan MC, et al. Computational fluid dynamics investigation of brush seal leakage performance depending on geometric dimensions and operating conditions. J Eng Gas Turb Power 2005; 138(3): 032506. [Google Scholar]
- 22.Dogu Y.Investigation of brush seal flow characteristics using bulk porous medium approach. J Eng Gas Turb Power 2003: 127: 136–144. [Google Scholar]
- 23.Sun D, Liu N-N, Fei C-W, et al. Theoretical and numerical investigation on the leakage characteristics of brush seals based on fluid-structure interaction. Aerosp Sci Technol 2016; 58: 207–216. [Google Scholar]
- 24.Wei Y, Dowell EH, Chen Z, et al. Influence of geometry on rotordynamic coefficients of brush seal. Int J Turbo Jet Eng 2017; 34(2): 155–166. [Google Scholar]