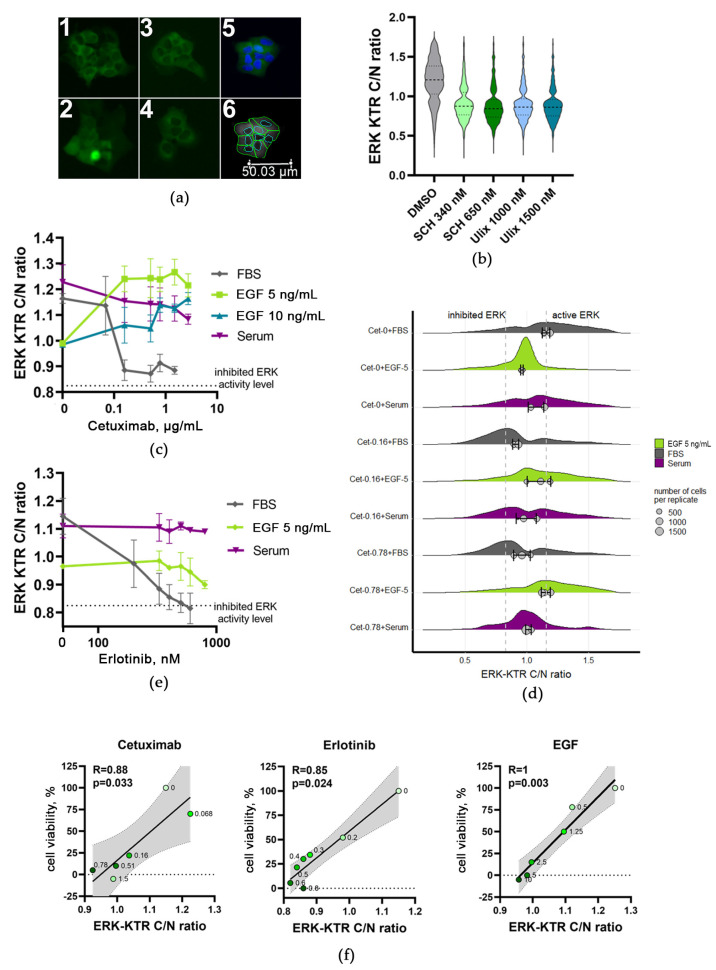
Figure 6.
A431 ERK KTR values after treatment with cetuximab (indicated in µg/mL), in the absence of EGF (FBS) and EGF at 5 and 10 ng/mL. (a) Microscopy images of ERK-KTR reporter in A431 cells treated for 24 h with DMSO (1), cetuximab (2), blood serum (3), and cetuximab in combination with blood serum (4). To segment cell nuclei, they were stained with Hoechst-33342 1 h before imaging (5); cytoplasm and nuclei segmentation were performed using CellProfiler (6). (b) Violin plots showing ERK KTR values distribution for A431 cells treated with selective ERK inhibitors SCH772984 (SCH) and ulixertinib (Ulix). (c) Curves represent the median ERK KTR for each condition (cetuximab concentrations are indicated) calculated from three replicates. ERK-KTR intensity fluorescence ratio in cytoplasm to nucleus (C/N ratio) corresponds to ERK activity levels. The dotted line shows the ERK activity level in A431 treated with selective ERK1/2 inhibitors. For each data point, the SD is shown. (d) ERK activity distribution when A431 cells were treated with cetuximab alone or in the presence of 5 ng/mL EGF. For each condition, the ERK activity was measured in 300–1000 individual cells for three biological repeats. (e) Curves represent the median ERK KTR for each condition (erlotinib concentrations are indicated) calculated from three replicates. The ERK-KTR intensity fluorescence ratio in cytoplasm to nucleus (C/N ratio) corresponds to ERK activity levels. The dotted line shows the ERK activity level in A431 treated with selective ERK1/2 inhibitors. For each data point, the SD is shown. (f) Spearman correlation between ERK activity (ERK-KTR C/N ratios) and cell growth for cetuximab, erlotinib, and EGF. Concentrations of cetuximab (µg/mL), erlotinib (µM), and EGF (ng/mL) are marked for each data point. The line shows linear regression, and the gray area shows confidence interval.

