Abstract
CD133 is a valuable prognostic marker in multiple types of cancer. However, the expression, methylation levels, and prognostic relevance of CD133 have not been evaluated in a pan-cancer perspective. The expression and methylation levels of CD133 across different types of cancer were determined using The Cancer Genome Atlas (TCGA) dataset. Univariate cox regression and Kaplan-Meier survival were used to determine the prognostic significance of CD133 expression and methylation. CD133 was highly expressed in papillary renal cell carcinoma (PRCC) or pancreatic adenocarcinoma (PAAD). Correspondingly, PAAD and PRCC had low CD133 methylation levels. Through pan-cancer perspective analysis, we found that CD133 high expression was a poor prognostic factor in lower grade glioma (LGG), while, CD133 high expression was a good prognostic factor in PRCC. Moreover, genes positively correlated with CD133 expression were associated with the poor clinical outcomes of LGG. In PRCC, genes negatively correlated with CD133 expression were correlated with the poor overall survival. Furthermore, CD133 expression levels were highly correlated with the CD133 methylation levels in LGG or PRCC. Correspondingly, CD133 hypermethylation was a good prognostic factor in LGG. On the contrary, CD133 hypomethylation was a good prognostic factor in PRCC. We also found that CD133 was highly expressed and hypomethylated in wild type IDH subgroup of LGG. CD133 was highly expressed and hypomethylated in low stages and type1 of PRCC. CD133 high expression and hypomethylation were bad prognostic factors in LGG, while, CD133 high expression and hypomethylation were good prognostic factors in PRCC.
Keywords: The Cancer Genome Atlas, pan-cancer analysis, CD133, lower grade glioma, papillary renal cell carcinoma
Introduction
Prominin-1 (PROM1, CD133) is a transmembrane glycoprotein which has been used to identify a subpopulation of cancer cells termed as cancer stem cells in brain tumor,1–3 colon cancer,4,5 pancreatic cancer, 6 lung cancer, 7 prostate cancer, 8 liver cancer,9,10 ovarian cancer,11,12 acute myeloid leukemia (AML) 13 and acute lymphoblastic leukemia (ALL). 14 Cancer stem cells are resistant to chemotherapy 15 and induce tumor growth and recurrence, 16 representing a potential target in cancer therapy.17–19 However, in some cases, the using of CD133 as a cancer stem cell biomarker is controversial. For example, in glioma, CD133 negative cells show similar self renewal and drug resistant characteristics as CD133 positive cells.20–22 Although the functions of CD133 still need further studies, the identification of cancer stem cells provides therapeutic target for anti-cancer treatment.23,24
The prognostic relevance of CD133 in various types of tumor is also studied. In glioma, 25 breast cancer, 26 colon cancer, 27 stomach cancer, 28 non-small cell lung cancer 29 and liver cancer, 30 patients with higher CD133 expression have worse clinical outcomes than patients with lower CD133 expression. However, in endometrial cancer 31 or renal cell carcinoma, 32 CD133 positive tumor status is correlated with favorable prognosis. The methylation level of CD133 is also a prognostic marker. In glioma and gastrointestinal stromal tumors, CD133 hypomethylation is associated with high tumor recurrence.33,34 On the contrary, in head and neck cancer, the hypermethylation of CD133 is associated with the poor prognosis. 35 In liver cancer patients, the different location of CD133 represents opposite prognostic significance. Cytoplasmic CD133 is correlated with unfavorable outcomes, while, nuclear CD133 is associated with favorable outcomes. 36 Those results highlight the divergent prognostic effects of CD133 in different types of tumor. So, evaluating the expression and prognostic relevance of CD133 in a pan-cancer manner is needed.
The Cancer Genome Atlas (TCGA) project contains the molecular signatures and clinical characteristics of more than 11,000 human cancer patients across 33 different tumor types.37,38 With the available TCGA dataset, in the present study, we systematically evaluated the expression and methylation levels of CD133, and determined the prognostic effects of CD133 across different tumor types.
Materials and methods
Data collection
The TCGA RNA-seq, HumanMethylation450 datasets along with the clinical datasets were downloaded from the TCGA hub (tcga.xenahubs.net). The Chinese Glioma Genome Atlas (CGGA) datasets were available at http://www.cgga.org.cn/index.jsp website.39–41 The gene expression matrix of glioblastoma multiformem (GBM) samples was downloaded from the Gene Expression Omnibus (GEO) website (www.ncbi.nlm.nih.gov/geo), including GSE7696 42 and GSE13041 43 datasets. The DNA methylation value was described as beta values. Higher beta values represented higher level of DNA methylation, that is, hypermethylation. And lower beta values represented lower level of DNA methylation, that is, hypomethylation.
Univariate cox regression analysis
Univariate cox regression analysis was determined by “survival” package (version 3.1-8; https://cran.r-project.org/web/packages/survival/index.html) in R statistics software (version 3.5.0; https://www.r-project.org/). The “survival” package and the basic usage could be downloaded from bioconductor (http://www.bioconductor.org/). Log-rank test was used to calculate the p values. In the univariate cox regression analysis, the coefficient measured the impact of covariates. The exponentiated coefficients were known as hazard ratios (HR).
Kaplan-Meier survival analysis
Kaplan-Meier plots were created using “survival” package in R statistics software. Tumor patients were divided into two sub-clusters based on the mean expression levels or methylation levels of different genes. Kaplan-Meier estimator was applied to determine the overall survival of those two sub-clusters of patients. p values were determined using Log-rank test.
Correlation plots
Correlation plots were created using the “corrplot” package (version 0.84; cran.r-project.org/web/packages/corrplot/index.html) in R statistics software. The Spearman’s correlation test was used to test the correlation coefficients.
Kyoto encyclopedia of gens and genomes (KEGG) signaling pathways and transcription factors enrichment analysis
The Database for Annotation, Visualization and Integrated Discovery (DAVID) website (version 6.8; https://david.ncifcrf.gov) was used to determine the KEGG signaling pathways and transcription factors which were associated with CD133 expression. Enriched signaling pathways and transcription factors with p value less than 0.05 was considered to be statistical significant.
Statistical analysis
The box plots were generated from GraphPad software Prism 5.0 (https://www.graphpad.com/). Statistical analysis was performed using the two-tailed unpaired Student’s t test. p value less than 0.05 was chosen to be statistically different.
Results
The expression and methylation levels of CD133 across different types of tumor
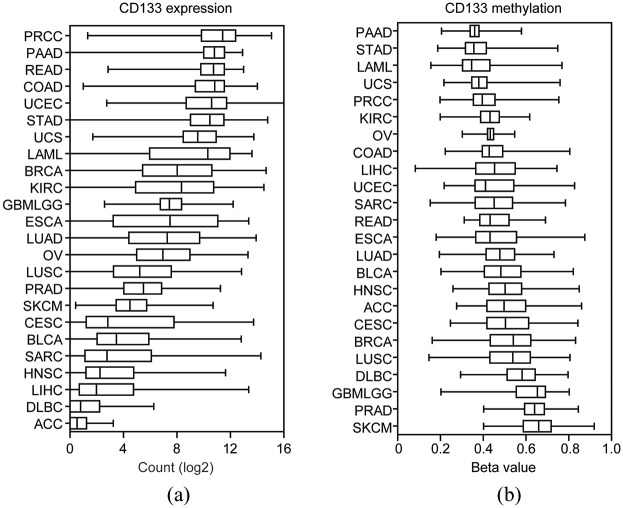
Collectively, 7930 cancer patients derived from TCGA RNA-seq datasets were used to test the mRNA expression levels of CD133 across 24 different types of tumor. The abbreviation and number of cancer patients in each tumor type were shown in Table 1. Compared with other types of tumor, CD133 was most highly expressed in patients with PRCC (Figure 1(a)). Patients with PAAD or COAD were also with high CD133 expression (Figure 1(a)). On the contrary, patients with adrenocortical cancer (ACC), large B-cell lymphoma (DLBC) or liver hepatocellular carcinoma (LIHC) were with low CD133 expression levels (Figure 1(a)).
Table 1.
Univariate cox regression analysis was used to determine the prognostic significance of CD133 expression across different types of tumor.
| Tumor type | Number | CD133 expression |
|||
|---|---|---|---|---|---|
| Coefficient | HR | p-value | 95% CI | ||
| ACC | 79 | −0.58 | 0.56 | 0.066 | 0.3–1.04 |
| BLCA | 403 | 0.01 | 1.01 | 0.63 | 0.96–1.07 |
| BRCA | 1080 | −0.02 | 0.98 | 0.47 | 0.94–1.03 |
| CESC | 290 | 0.01 | 1.01 | 0.63 | 0.96–1.08 |
| COAD | 275 | 0.045 | 1.05 | 0.49 | 0.92–1.19 |
| DLBC | 47 | −0.28 | 0.75 | 0.37 | 0.4–1.39 |
| ESCA | 184 | −0.02 | 0.97 | 0.38 | 0.92–1.03 |
| GBM | 156 | 0.02 | 1.02 | 0.69 | 0.92–1.14 |
| HNSC | 517 | −0.02 | 0.98 | 0.39 | 0.93–1.03 |
| KIRC | 531 | −0.02 | 0.98 | 0.43 | 0.94–1.02 |
| PRCC | 287 | −0.2 | 0.82 | 3.04E-06 | 0.75–0.89 |
| LAML | 160 | 0.01 | 1.01 | 0.68 | 0.96–1.06 |
| LGG | 511 | 0.31 | 1.36 | 2.77E-05 | 1.18–1.57 |
| LIHC | 365 | 0.005 | 1 | 0.86 | 0.95–1.06 |
| LUAD | 503 | −0.03 | 0.97 | 0.2 | 0.93–1.02 |
| LUSC | 494 | −0.006 | 0.99 | 0.8 | 0.95–1.04 |
| OV | 303 | −0.03 | 0.97 | 0.34 | 0.92–1.03 |
| PAAD | 177 | 0.18 | 1.2 | 0.0058 | 1.1–1.36 |
| PRAD | 496 | −0.2 | 0.82 | 0.2 | 0.61–1.11 |
| READ | 92 | 0.03 | 1.03 | 0.77 | 0.81–1.33 |
| SARC | 259 | 0.04 | 1.04 | 0.2 | 0.98–1.1 |
| SKCM | 103 | 0.14 | 1.15 | 0.12 | 0.96–1.38 |
| STAD | 388 | −0.03 | 0.97 | 0.31 | 0.92–1.03 |
| UCEC | 174 | −0.07 | 0.93 | 0.32 | 0.81–1.07 |
| UCS | 56 | −0.08 | 0.92 | 0.27 | 0.79–1.07 |
ACC, Adrenocortical cancer; BLCA, Bladder urothelial carcinoma; BRCA, Breast invasive carcinoma; CESC, Cervical Squamous cell carcinoma; COAD, Colon adenocarcinoma; DLBC, Large B-cell lymphoma; ESCA, Esophageal carcinoma; GBM, Glioblastoma multiforme; HNSC, Head and neck squamous cell carcinoma; KIRC, Renal clear cell carcinoma; PRCC, Papillary renal cell carcinoma; LAML, Acute myeloid leukemia; LGG, Brain lower grade glioma; LIHC, Liver hepatocellular carcinoma; LUAD, Lung adenocarcinoma; LUSC, Lung squamous cell carcinoma; OV, Ovarian serous cystadenocarcinoma; PAAD Pancreatic adenocarcinoma; PRAD, Prostate adenocarcinoma; READ, Rectum adenocarcinoma; SARC, Sarcoma; SKCM, Skin cutaneous melanoma; STAD, Stomach adenocarcinoma; UCEC, Uterine corpus endometrial carcinoma; UCS, Uterine carcinosarcoma; HR, hazard ratio; CI, confidence interval.
Figure 1.
The expression and methylation levels of CD133 across different types of tumor: (a) box plot showed the expression levels (log2 count) of CD133 based on TCGA RNA-seq datasets across different types of tumor, and (b) methylation levels (Beta values) of CD133 in different types of tumor which were retrieved from TCGA HumanMethylation450 datasets.
The DNA methylation levels of CD133 across different types of tumor were also analyzed. The number of tumor patients used for DNA methylation analysis was shown in Table 2. Corresponding to the high expression levels of CD133 in PRCC, PAAD, or COAD patients, the DNA methylation levels of CD133 in PRCC, PAAD, or COAD patients were relatively low (Figure 1(b)). On the contrary, CD133 was hypermethylated in patients with prostate adenocarcinoma (PRAD) or skin cutaneous melanoma (SKCM) (Figure 1(b)). Those significant different expression and methylation levels of CD133 suggested the diverse functions of CD133 across different types of tumor.
Table 2.
Univariate cox regression analysis was used to determine the prognostic significance of CD133 methylation across different types of tumor.
| Tumor type | Number | CD133 methylation |
|||
|---|---|---|---|---|---|
| Coefficient | HR | p-value | 95% CI | ||
| ACC | 80 | 4.67 | 106.6 | 0.0016 | 6–1923 |
| BLCA | 408 | −1.48 | 0.23 | 0.021 | 0.06–0.8 |
| BRCA | 781 | −0.61 | 0.54 | 0.45 | 0.11–2.61 |
| CESC | 294 | −0.57 | 0.57 | 0.57 | 0.08–4.05 |
| COAD | 286 | −1.24 | 0.29 | 0.41 | 0.02–5.4 |
| DLBC | 47 | −3.55 | 0.03 | 0.26 | 0–14.53 |
| ESCA | 185 | 0.49 | 1.63 | 0.58 | 0.28–9.5 |
| GBM | 141 | −2.56 | 0.08 | 0.019 | 0–0.65 |
| HNSC | 525 | 2.09 | 8.07 | 0.0015 | 2.22–29.31 |
| KIRC | 317 | 3.37 | 29.2 | 0.02 | 1.67–512.4 |
| PRCC | 272 | 5.81 | 331.9 | 1.84E-06 | 30.6–3604 |
| LAML | 179 | −1.94 | 0.14 | 0.038 | 0.02–0.9 |
| LGG | 511 | −6.24 | 0.002 | 9.62E-13 | 0–0.011 |
| LIHC | 371 | −0.21 | 0.81 | 0.77 | 0.19–3.41 |
| LUAD | 447 | 0.51 | 1.66 | 0.59 | 0.27–10.4 |
| LUSC | 363 | −1.12 | 0.32 | 0.09 | 0.09–1.19 |
| OV | 10 | −6.51 | 0.001 | 0.39 | 0–4586 |
| PAAD | 183 | −2.56 | 0.078 | 0.23 | 0.01–5.16 |
| PRAD | 497 | 7.97 | 2878 | 0.09 | 0.32–25796924 |
| READ | 94 | −2.24 | 0.11 | 0.46 | 0–38.9 |
| SARC | 261 | −0.48 | 0.62 | 0.58 | 0.11–3.39 |
| SKCM | 104 | 1.64 | 5.15 | 0.45 | 0.07–361 |
| STAD | 383 | −0.44 | 0.65 | 0.63 | 0.11–3.84 |
| UCEC | 429 | −0.58 | 0.56 | 0.57 | 0.08–4.11 |
| UCS | 56 | −0.07 | 0.93 | 0.97 | 0.03–33.4 |
Prognostic relevance of CD133 expression levels across different types of tumor
Using univariate cox regression analysis, we determined the prognostic relevance of CD133 expression levels in each tumor type. In all the 25 studied types of tumor, CD133 expression was only associated with the clinical overall survival of LGG, PRCC, and PAAD (Table 1). Although, it was previously reported that CD133 was a biomarker associated with the overall survival of COAD, stomach adenocarcinoma (STAD) and lung adenocarcinoma (LUAD), we did not obtain similar results using TCGA datasets (Table 1). The univariate cox regression analysis also supposed the opposite prognostic significance of CD133 expression in LGG and PRCC. CD133 expression was an unfavorable prognostic marker in LGG patients (Coefficient = 0.31, p = 2.77E-05), while, CD133 expression was a favorable prognostic marker in PRCC patients (Coefficient = −0.2, p = 3.04E-06) (Table 1).
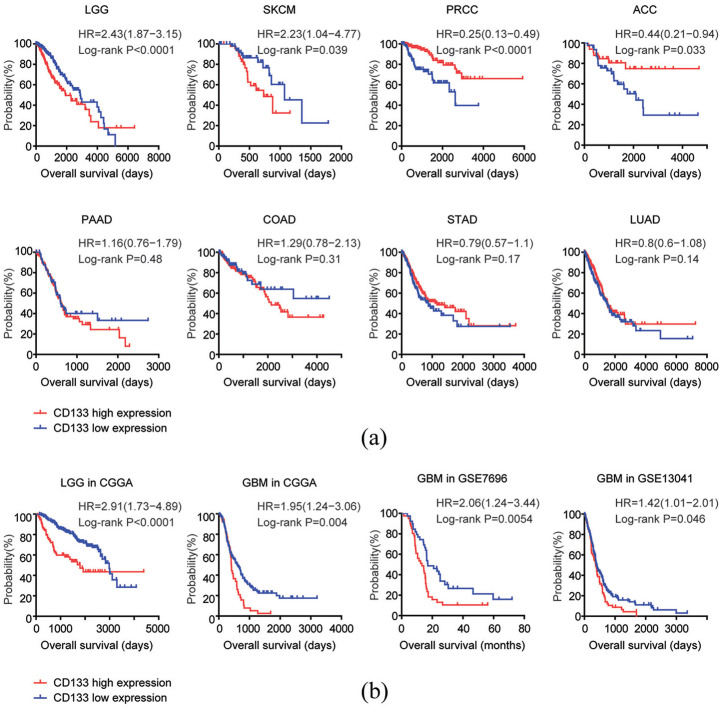
The Kaplan-Meier survival analysis demonstrated similar opposite prognostic effects of CD133 in patients with LGG or PRCC. Compared with CD133 highly expressed LGG patients, CD133 lowly expressed patients had more favorable overall survival (Figure 2(a)). On the contrary, CD133 lowly expressed PRCC patients had more unfavorable clinical overall survival, compared with CD133 highly expressed PRCC patients (Figure 2(a)). Moreover, CD133 high expression was an unfavorable prognostic factor in patients with SKCM, while, CD133 high expression was a favorable prognostic factor in patients with ACC (Figure 2(a)). The Kaplan-Meier survival analysis also demonstrated that there was no prognostic significance of CD133 expression in patients with PAAD, COAD, STAD, or LUAD (Figure 2(a)).
Figure 2.
Prognostic relevance of CD133 expression levels across different types of tumor: (a) Kaplan–Meier plots demonstrated the different overall survival in CD133 highly expressed (red) and CD133 lowly expressed patients (blue) with LGG, SKCM, PRCC, ACC, PAAD, COAD, STAD, or LUAD. p value was generated from Log-rank test, and (b) Kaplan-Meier plots demonstrated the prognostic significance of CD133 expression levels in LGG in CGGA or GBM in CGGA, GSE7696 and GSE13041 datasets. The log-rank test was applied to compare the different overall survival of glioma patients with high CD133 expression levels (red) or low CD133 expression levels (blue).
The prognostic significance of CD133 expression levels in patients with LGG was further validated using CGGA dataset. Similar to the results derived from TCGA dataset, CD133 lowly expressed LGG patients had better clinical outcomes, compared with CD133 highly expressed LGG patients in CGGA dataset (Figure 2(b)). Although, CD133 expression was not a prognostic marker in patients with glioblastoma multiforme (GBM) in TCGA dataset, we found that in CGGA, GSE7696 and GSE13041 datasets, CD133 highly expressed GBM patients had worse clinical overall survival, compared with CD133 lowly expressed GBM patients (Figure 2(b)). Those results highlighted the heterogeneity of cancer, and suggested that the prognosis of CD133 should be further validated using other cohort of patients.
Prognostic relevance of the genes correlated with CD133 expressionin patients with LGG
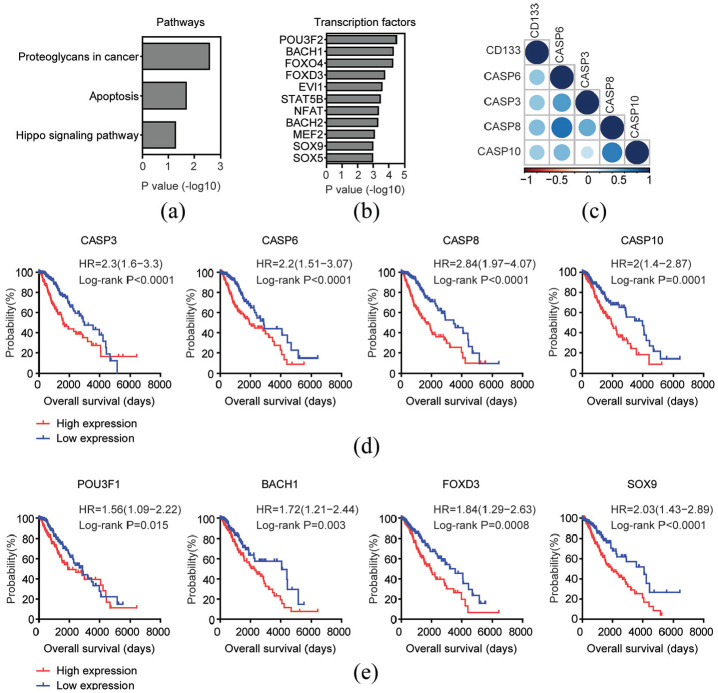
In both univariate cox regression and Kaplan-Meier survival analysis, CD133 was a significant prognostic marker for LGG patients. To further demonstrate the prognostic relevance of CD133 expression, we identified the top 200 genes which were most positively correlated with CD133 expression in TCGA LGG dataset. Those genes were highly associated with proteoglycans in cancer, apoptosis and Hippo signaling pathway (Figure 3(a)). Four genes CASP3, CASP6, CASP8, and CASP10 were enriched in apoptosis signaling pathway. As demonstrated in the corrplots, the correlations of CD133 with CASP3, CASP6, CASP8, and CASP10 were significant (Figure 3(c)). Moreover, high CASP3, CASP6, CASP8, and CASP10 expression levels were unfavorable prognostic markers for LGG patients. Compared with CASP3, CASP6, CASP8, or CASP10 highly expressed LGG patients, CASP3, CASP6, CASP8, or CASP10 lowly expressed patients had better clinical outcomes (Figure 3(d)).
Figure 3.
Prognostic relevance of the genes correlated with CD133 expression in patients with LGG: (a) Functional signaling pathway enrichment analysis of the top 200 genes which were most positively associated with CD133 expression in TCGA LGG patients. The significantly enriched pathways were shown, (b) Transcription factor enrichment analysis of the top 200 genes which were most positively associated with CD133 expression, (c) Corrplots demonstrated the association of CD133 with genes in apoptosis signaling pathway. The size of the circle represented correlation coefficients, (f) Kaplan–Meier survival analysis was used to compare apoptosis signaling pathway associated genes CASP3, CASP6, CASP8, or CASP10 highly expressed LGG patients (red) with CASP3, CASP6, CASP8, or CASP10 lowly expressed LGG patients (blue) in TCGA dataset. p values were generated from Log-rank test, and (e) Kaplan–Meier plot demonstrated the prognostic significance of transcription factors POU3F1, BACH1, FOXD3, and SOX9 in patients with LGG in TCGA dataset.
The top 200 genes which were most positively correlated with CD133 expression were significantly enriched by transcription factors POU3F2, BCAH1, FOXO4, SOX9, and SOX5 (Figure 3(b)). Moreover, prognostic effects of transcription factors POU3F1, BACH1, FOXD3, and SOX9 in patients with LGG were significant (Figure 3(e)). Those results further highlighted the prognostic significance of CD133 in patients with LGG.
Prognostic relevance of the genes correlated with CD133 expression in patients with PRCC
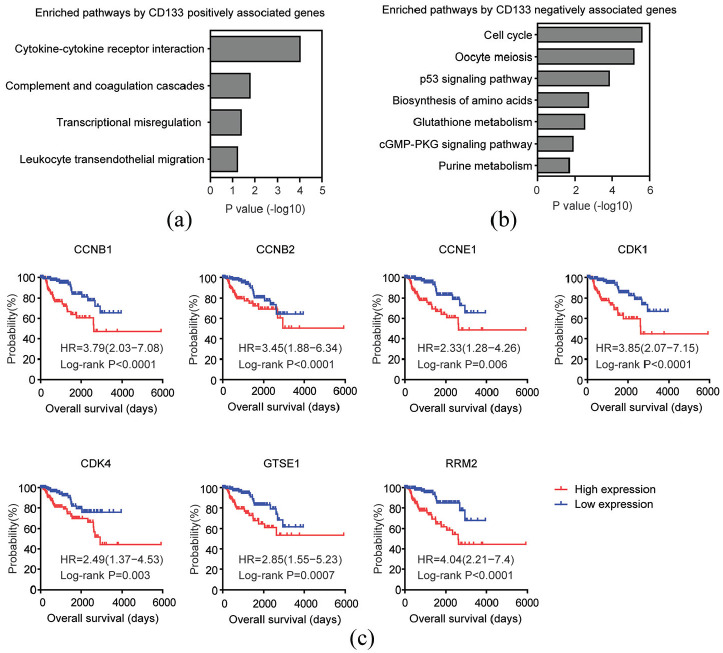
The top 200 genes which were most positively correlated with CD133 expression in TCGA PRCC dataset were also identified. Those genes were associated with cytokine-cytokine receptor interaction, complement and coagulation cascades, and leukocyte transendothelial migration signaling pathways (Figure 4(a)). However, genes from those signaling pathways demonstrated no prognostic effects in patients with PRCC.
Figure 4.
Prognostic relevance of the genes correlated with CD133 expression in patients with PRCC: (a) Functional signaling pathway enrichment analysis of the top 200 genes which were most positively associated with CD133 expression in TCGA PRCC patients, (b) functional signaling pathway enrichment analysis of the top 200 genes which were most negatively associated with CD133 expression in TCGA PRCC patients, and (c) Kaplan–Meier survival analysis was used to determine the prognostic effects of p53 signaling pathway associated genes CCNB1, CCNB2, CCNE1, CDK1, CDK4, GTSE1, and RRM2 in PRCC patients. p values were generated from Log-rank test.
So, we identified the top 200 genes which were most negatively correlated with CD133 expression. We found that cell cycle and p53 signaling pathway were highly enriched by CD133 negatively correlated genes (Figure 4(b)). Moreover, genes CCNB1, CCNB2, CCNE1, CDK1, CDK4, GTSE1, and RRM2 from p53 signaling pathway were unfavorable prognostic markers for patients with PRCC. Compared with CCNB1, CCNB2, CCNE1, CDK1, CDK4, GTSE1, or RRM2 highly expressed PRCC patients, CCNB1, CCNB2, CCNE1, CDK1, CDK4, GTSE1, or RRM2 lowly expressed patients had better clinical outcomes (Figure 4(c)).
Prognostic relevance of CD133 methylation levels across different types of tumor
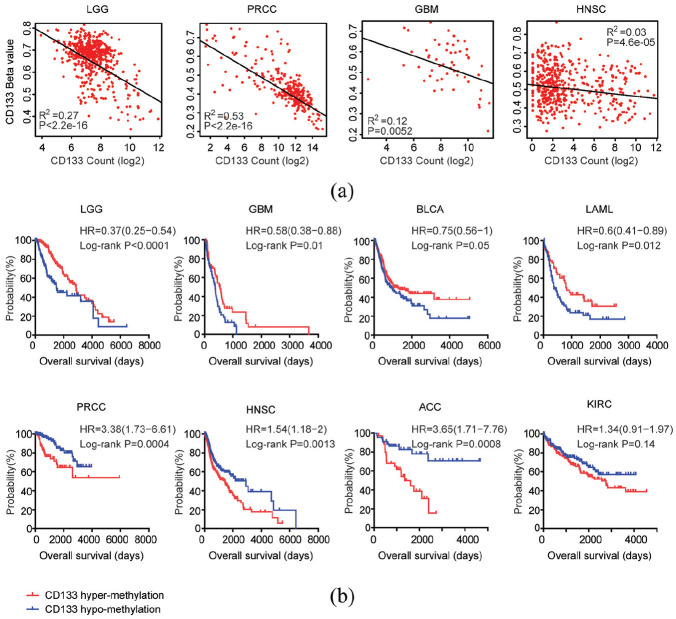
Next, we tried to determine the prognostic relevance of CD133 methylation levels across different types of tumor. Similarly, using univariate cox regression analysis, we showed that CD133 methylation levels were associated with the overall survival in patients with ACC, bladder urothelial carcinoma (BLCA), GBM, head and neck squamous cell carcinoma (HNSC), renal clear cell carcinoma (KIRC), PRCC, acute myeloid leukemia (LAML), or LGG (Table 2). The prognostic significance of CD133 methylation in LGG and PRCC was also opposite. CD133 methylation was favorable prognostic marker in LGG patients (Coefficient = −6.24, p = 9.62E-13), while, CD133 methylation was an unfavorable prognostic marker in PRCC patients (Coefficient = 5.81, p = 1.84E-06) (Table 2).
Spearman correlations demonstrated high correlation coefficients of CD133 expression levels and CD133 methylation levels in patients with LGG or PRCC in TCGA dataset (Figure 5(a)). However, the correlation of CD133 expression levels and CD133 methylation levels in patients with GBM or HNSC were relatively low. And CD133 methylation levels but not CD133 expression levels were associated with the overall survival of patients with GBM or HNSC (Tables 1 and 2).
Figure 5.
Prognostic relevance of CD133 methylation levels across different types of tumor: (a) Spearman correlations of CD133 expression levels and CD133 methylation levels in patients with LGG, PRCC, GBM, or HNSC in TCGA datasets were determined, and (b) overall survival was determined in CD133 hypermethylated (red) and CD133 hypomethylated patients (blue) in LGG, GBM, BLCA, LAML, PRCC, HNSC, ACC, or KIRC. P value was generated from Log-rank test.
Kaplan-Meier survival analysis also showed that LGG, GBM, BLCA, or LAML patients with hypermethylated CD133 had better clinical outcomes than patients with hypomethylated CD133 (Figure 5(b)). On the contrary, PRCC, HNSC, ACC, or KIRC patients with hypermethylated CD133 had worse clinical outcomes (Figure 5(b)).
The expression and methylation levels of CD133 in different grades or subtypes of LGG
The expression levels of CD133 in different grades or subtypes of LGG were tested. Compared with grade II LGG, CD133 were highly expressed in LGG patients with grade III (Figure 6(a)). Furthermore, the CD133 expression levels were even higher in grade IV glioma (Figure 6(a)). However, there were no significant different expression levels of CD133 in LGG astrocytoma, oligoastrocytoma, and oligodendroglioma subtypes (Figure 6(a)). The expression levels of CD133 were also tested in LGG patients with IDH1 mutation 1p19q codeletion, IDH1 mutation 1p19q non-codeletion or wild type IDH1. Consistent with the poor prognosis of IDH1 wild type LGG, the expression levels of CD133 were higher in LGG patients with wild type IDH1 (Figure 6(a)). Similar results were validated using CGGA dataset that LGG patients with wild type IDH1 demonstrated high CD133 expression levels (Figure 6(b)). And grade IV glioma was with higher CD133 expression levels (Figure 6(b)).
Figure 6.
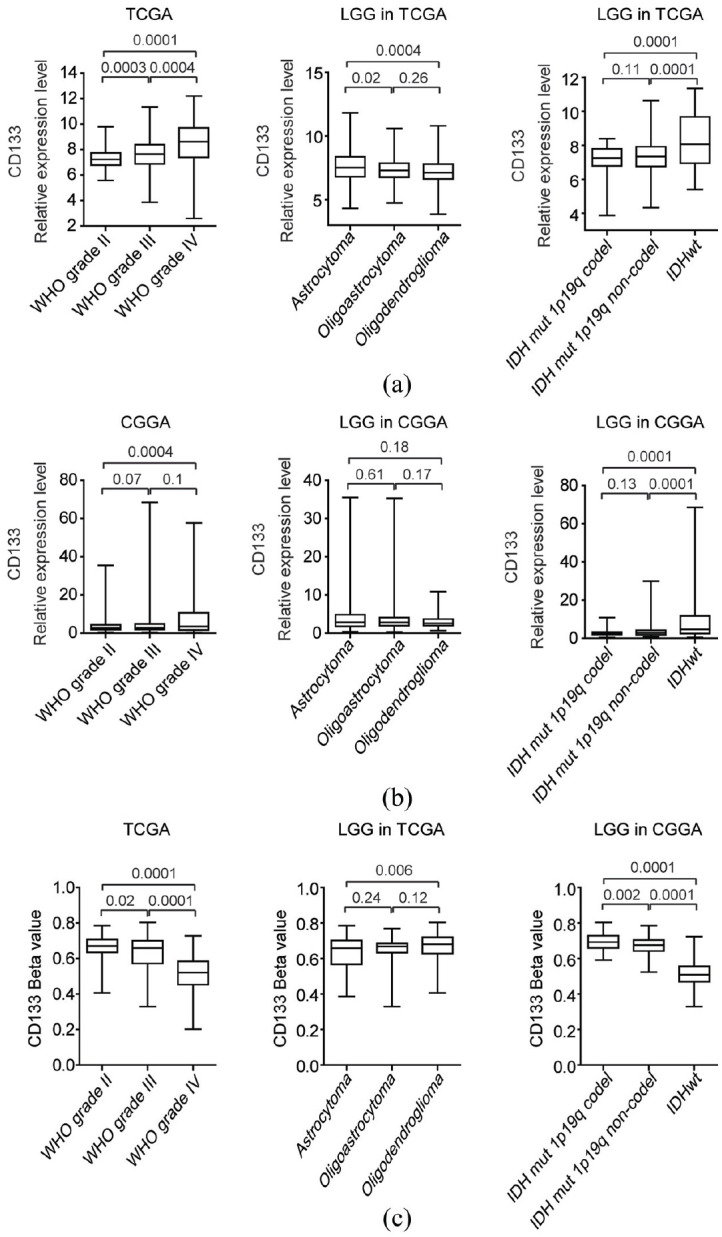
The expression and methylation levels of CD133 in different grades or subtypes of LGG: (a) box plots demonstrated the CD133 expression levels in different grades or subtypes of LGG in TCGA datasets. p values were performed using two-tailed unpaired Student’s t test, (b) box plots demonstrated the expression levels of CD133 in different grades or subtypes of LGG in CGGA datasets, and (c) the methylation levels of CD133 in different grades or subtypes of LGG in TCGA datasets
The methylation levels of CD133 in different grades or subtypes of LGG were also tested. Corresponding to the higher expression levels of CD133 in grade IV glioma, the methylation levels of CD133 in grade IV glioma was lower (Figure 6(c)). Also, LGG patients with wild type IDH1 which demonstrated higher expression levels of CD133 were with lower CD133 methylation levels (Figure 6(c)).
The expression and methylation levels of CD133 in different grades or subtypes of PRCC
We also tested the expression levels of CD133 in patients with different pathological stages of PRCC. Compared with PRCC patients with stage I or stage II, CD133 was lowly expressed in patients with stage III PRCC (Figure 7(a)). Moreover, the expression levels of CD133 in patients with T3 stage of PRCC were also lower (Figure 7(a)). Correspondingly, CD133 was hypermethylated in PRCC patients with stage III or T3 (Figure 7(b)).
Figure 7.
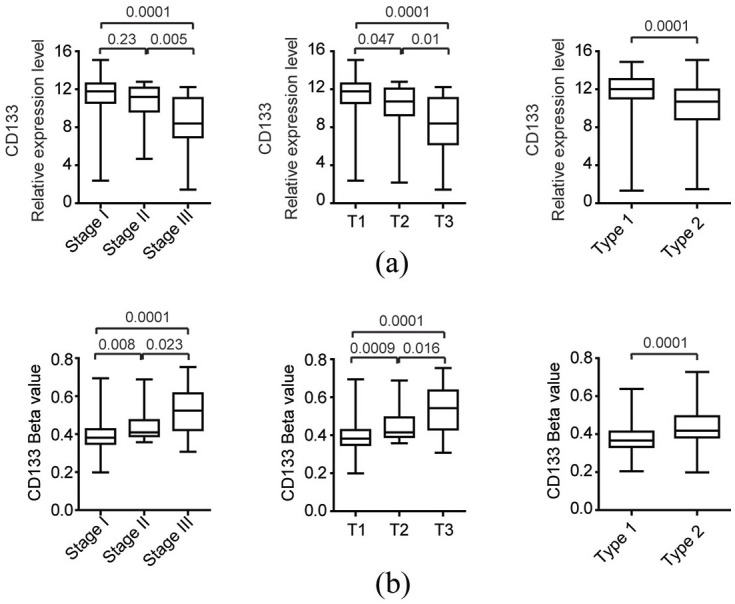
The expression and methylation levels of CD133 in different subtypes of PRCC: (a) box plots demonstrated the CD133 expression levels in different subtypes or stages of PRCC in TCGA datasets. p values were performed using two-tailed unpaired Student’s t test, and (b) the methylation levels of CD133 in different subtypes or stages of PRCC in TCGA datasets.
Besides the basic pathological stages, patients with PRCC were divided into two main subtypes: type 1 and type 2, characterized by different genetic alterations and clinical features. 44 We found that CD133 was highly expressed in type 1 PRCC patients, compared with type 2 PRCC patients (Figure 7(a)). On the contrary, the methylation levels of CD133 in type 1 PRCC patients were lower (Figure 7(b)).
Discussion
Using TCGA dataset, we determined the prognostic effects of CD133 expression and methylation levels in a pan-cancer manner. Previously, CD133 was reported to be associated with the prognosis of breast cancer, 26 colon cancer, 27 stomach cancer 28 or liver cancer. 30 However, we did not find similar prognostic significance of CD133 based on the TCGA dataset. Those results highlighted the complexity of cancer and suggested that different cohort of patients and methods of measurement would influence the prognosis of CD133 in different types of tumor. For example, CD133 had no prognostic significance in TCGA GBM dataset, but correlated with the clinical outcomes of GBM patients derived from CGGA, GSE7696, and GSE13041 datasets (Figure 2(a)). So, the correlations of CD133 expression and clinical outcomes in other cohort of patients with breast cancer, colon cancer, stomach cancer, or liver cancer should be further studied.
Glioma is a common type of brain cancer and divided into LGG (grade II-III glioma) and GBM (grade IV glioma) subtypes. 45 Previously, the using of CD133 as a cancer stem cell marker and prognostic marker was mainly focused on GBM, while, the prognostic relevance of CD133 in LGG was unclear. We found that CD133 methylation was a more significant prognostic marker than CD133 expression levels in GBM. Moreover, CD133 expression levels were highly correlated with CD133 methylation levels in LGG and CD133 expression and methylation levels were both associated with the clinical outcomes and sub-classifications of patients with LGG. It is interesting to the test whether CD133 is also a cancer stem cell marker for LGG.46,47
PRCC is a type of renal cell carcinoma. 48 Compared with other types of tumor, CD133 was most expressed in patients with PRCC. Using tissue microarray, previous report suggested that CD133 served as favorable prognostic marker in PRCC. 49 Here, we found that CD133 mRNA high expression and CD133 hypomethylation were also favorable prognostic markers in patients with PRCC. Moreover, CD133 was highly expressed and hypomethylated in type 1 PRCC. All those results highlighted the prognostic significance of CD133 was highly depended on the types of tumor. However, the precise functions of CD133 in PRCC and LGG should be further investigated.
The aim of present study is to determine the expression, methylation, and prognostic relevance of CD133 across cancer types. By comprehensive analysis, our results revealed the opposite prognostic significance of CD133 in LGG and PRCC. However, there are limitations in our comprehensive pan-cancer analysis. Our analyses were based on the published TCGA databases and lack of further clinical validation. Therefore, quantitative PCR would be used to test the CD133 expression in patient with LGG or PRCC to determine the prognosis of CD133.
Conclusions
CD133 demonstrated opposite prognostic significance in patients with LGG or PRCC. CD133 high expression and hypomethylation were bad prognostic factors in patients with LGG, while, CD133 high expression and hypomethylation were good prognostic factors in patients with PRCC.
Acknowledgments
We appreciate the generosity of the TCGA and GEO groups for sharing the huge amount of data.
Author biographies
Haiwei Wang graduated from University of Chinese Academy of Sciences, is currently an associated professor in Fujian Maternity and Child Health Hospital. His main research field is bioinformatics analysis of tumor prognosis.
Xinrui Wang graduated from Shanghai Jiao Tong University, is currently an associated professor in Fujian Maternity and Child Health Hospital. His main research field is the epigenetic changes during tumor development.
Liangpu Xu is the director of the Center for Medical Genetic Diagnosis and Therapy in Fujian Maternity and Child Health Hospital. His main research field is diagnosis and treatment of the genetic diseases.
Ji Zhang is a professor in Shanghai Institute of Hematology. His research focuses on the genetic and epigenetic alterations during tumor development.
Hua Cao is the director of the Medical Research Center in Fujian Maternity and Child Health Hospital. His main research field is bioinformatics and experimental analysis of congenital heart disease.
Footnotes
Authors’ contributions: HW designed and performed data analysis. XW and LX analyzed the data. HW wrote the manuscript. HC and JZ designed and supervised the work.
The author(s) declared no potential conflicts of interest with respect to the research, authorship, and/or publication of this article.
Funding: The author(s) disclosed receipt of the following financial support for the research, authorship, and/or publication of this article: The present study was supported by grants from the Fujian Maternity and Child Health Hospital (grant nos. YCXB 18-10 and YCXM 19-04). This study was also supported by Natural Science Foundation of Fujian province (grant nos.2020J01337).
ORCID iD: Haiwei Wang  https://orcid.org/0000-0002-9675-4039
References
- 1.Singh SK, Clarke ID, Terasaki M, et al. Identification of a cancer stem cell in human brain tumors. Cancer Res 2003; 63: 5821–5828. [PubMed] [Google Scholar]
- 2.Singh SK, Hawkins C, Clarke ID, et al. Identification of human brain tumour initiating cells. Nature 2004; 432: 396–401. [DOI] [PubMed] [Google Scholar]
- 3.Bao S, Wu Q, McLendon RE, et al. Glioma stem cells promote radioresistance by preferential activation of the DNA damage response. Nature 2006; 444: 756–760. [DOI] [PubMed] [Google Scholar]
- 4.Ricci-Vitiani L, Lombardi DG, Pilozzi E, et al. Identification and expansion of human colon-cancer-initiating cells. Nature 2007; 445: 111–115. [DOI] [PubMed] [Google Scholar]
- 5.O’Brien CA, Pollett A, Gallinger S, et al. A human colon cancer cell capable of initiating tumour growth in immunodeficient mice. Nature 2007; 445: 106–110. [DOI] [PubMed] [Google Scholar]
- 6.Hermann PC, Huber SL, Herrler T, et al. Distinct populations of cancer stem cells determine tumor growth and metastatic activity in human pancreatic cancer. Cell Stem Cell 2007; 1: 313–323. [DOI] [PubMed] [Google Scholar]
- 7.Bertolini G, Roz L, Perego P, et al. Highly tumorigenic lung cancer CD133+ cells display stem-like features and are spared by cisplatin treatment. Proc Natl Acad Sci USA 2009; 106: 16281–16286. [DOI] [PMC free article] [PubMed] [Google Scholar]
- 8.Collins AT, Berry PA, Hyde C, et al. Prospective identification of tumorigenic prostate cancer stem cells. Cancer Res 2005; 65: 10946–10951. [DOI] [PubMed] [Google Scholar]
- 9.Haraguchi N, Ishii H, Mimori K, et al. CD13 is a therapeutic target in human liver cancer stem cells. J Clin Invest 2010; 120: 3326–3339. [DOI] [PMC free article] [PubMed] [Google Scholar]
- 10.Ma S, Chan KW, Hu L, et al. Identification and characterization of tumorigenic liver cancer stem/progenitor cells. Gastroenterology 2007; 132: 2542–2556. [DOI] [PubMed] [Google Scholar]
- 11.Silva IA, Bai S, McLean K, et al. Aldehyde dehydrogenase in combination with CD133 defines angiogenic ovarian cancer stem cells that portend poor patient survival. Cancer Res 2011; 71: 3991–4001. [DOI] [PMC free article] [PubMed] [Google Scholar]
- 12.Curley MD, Therrien VA, Cummings CL, et al. CD133 expression defines a tumor initiating cell population in primary human ovarian cancer. Stem Cells 2009; 27: 2875–2883. [DOI] [PubMed] [Google Scholar]
- 13.Miraglia S, Godfrey W, Yin AH, et al. A novel five-transmembrane hematopoietic stem cell antigen: isolation, characterization, and molecular cloning. Blood 1997; 90: 5013–5021. [PubMed] [Google Scholar]
- 14.Buhring HJ, Seiffert M, Marxer A, et al. AC133 antigen expression is not restricted to acute myeloid leukemia blasts but is also found on acute lymphoid leukemia blasts and on a subset of CD34+ B-cell precursors. Blood 1999; 94: 832–833. [PubMed] [Google Scholar]
- 15.Diehn M, Cho RW, Lobo NA, et al. Association of reactive oxygen species levels and radioresistance in cancer stem cells. Nature 2009; 458: 780–783. [DOI] [PMC free article] [PubMed] [Google Scholar]
- 16.Batlle E, Clevers H.Cancer stem cells revisited. Nat Med 2017; 23: 1124–1134. [DOI] [PubMed] [Google Scholar]
- 17.Mak AB, Nixon AM, Moffat J.The mixed lineage leukemia (MLL) fusion-associated gene AF4 promotes CD133 transcription. Cancer Res 2012; 72: 1929–1934. [DOI] [PubMed] [Google Scholar]
- 18.Godfrey L, Crump NT, O’Byrne S, et al. H3K79me2/3 controls enhancer-promoter interactions and activation of the pan-cancer stem cell marker PROM1/CD133 in MLL-AF4 leukemia cells. Leukemia 2021; 35: 90–106. [DOI] [PMC free article] [PubMed] [Google Scholar]
- 19.Li D, Hu Y, Jin Z, et al. TanCAR T cells targeting CD19 and CD133 efficiently eliminate MLL leukemic cells. Leukemia 2018; 32: 2012–2016. [DOI] [PubMed] [Google Scholar]
- 20.Holmberg Olausson K, Maire CL, Haidar S, et al. Prominin-1 (CD133) defines both stem and non-stem cell populations in CNS development and gliomas. PLoS One 2014; 9: e106694. [DOI] [PMC free article] [PubMed] [Google Scholar]
- 21.Wang J, Sakariassen PO, Tsinkalovsky O, et al. CD133 negative glioma cells form tumors in nude rats and give rise to CD133 positive cells. Int J Cancer 2008; 122: 761–768. [DOI] [PubMed] [Google Scholar]
- 22.Chen R, Nishimura MC, Bumbaca SM, et al. A hierarchy of self-renewing tumor-initiating cell types in glioblastoma. Cancer Cell 2010; 17: 362–375. [DOI] [PubMed] [Google Scholar]
- 23.Kreso A, van Galen P, Pedley NM, et al. Self-renewal as a therapeutic target in human colorectal cancer. Nat Med 2014; 20: 29–36. [DOI] [PubMed] [Google Scholar]
- 24.Gupta PB, Onder TT, Jiang G, et al. Identification of selective inhibitors of cancer stem cells by high-throughput screening. Cell 2009; 138: 645–659. [DOI] [PMC free article] [PubMed] [Google Scholar]
- 25.Han M, Guo L, Zhang Y, et al. Clinicopathological and prognostic significance of CD133 in glioma patients: a meta-analysis. Mol Neurobiol 2016; 53: 720–727. [DOI] [PubMed] [Google Scholar]
- 26.Joseph C, Arshad M, Kurozomi S, et al. Overexpression of the cancer stem cell marker CD133 confers a poor prognosis in invasive breast cancer. Breast Cancer Res Treat2019; 174: 387–399. [DOI] [PubMed] [Google Scholar]
- 27.Park YY, An CH, Oh ST, et al. Expression of CD133 is associated with poor prognosis in stage II colorectal carcinoma. Medicine (Baltimore) 2019; 98: e16709. [DOI] [PMC free article] [PubMed] [Google Scholar]
- 28.Yiming L, Yunshan G, Bo M, et al. CD133 overexpression correlates with clinicopathological features of gastric cancer patients and its impact on survival: a systematic review and meta-analysis. Oncotarget 2015; 6: 42019–42027. [DOI] [PMC free article] [PubMed] [Google Scholar]
- 29.Wang D, Wen GM, Hou W, et al. The roles of CD133 expression in the patients with non-small cell lung cancer. Cancer Biomark 2018; 22: 385–394. [DOI] [PubMed] [Google Scholar]
- 30.Zhong C, Wu JD, Fang MM, et al. Clinicopathological significance and prognostic value of the expression of the cancer stem cell marker CD133 in hepatocellular carcinoma: a meta-analysis. Tumour Biol 2015; 36: 7623–7630. [DOI] [PubMed] [Google Scholar]
- 31.Mancebo G, Sole-Sedeno JM, Pino O, et al. Prognostic impact of CD133 expression in Endometrial Cancer Patients. Sci Rep 2017; 7: 7687. [DOI] [PMC free article] [PubMed] [Google Scholar]
- 32.Costa WH, Rocha RM, Cunha IW, et al. CD133 immunohistochemical expression predicts progression and cancer-related death in renal cell carcinoma. World J Urol 2012; 30: 553–558. [DOI] [PubMed] [Google Scholar]
- 33.Sun B, Wan Z, Shen J, et al. DNA hypomethylation of CD133 promoter is associated with recurrent glioma. Oncol Rep 2016; 36: 1062–1068. [DOI] [PubMed] [Google Scholar]
- 34.Geddert H, Braun A, Kayser C, et al. Epigenetic regulation of CD133 in gastrointestinal stromal tumors. Am J Clin Pathol 2017; 147: 515–524. [DOI] [PubMed] [Google Scholar]
- 35.Hu Z, Liu H, Zhang X, et al. Promoter hypermethylation of CD133/PROM1 is an independent poor prognosis factor for head and neck squamous cell carcinoma. Medicine (Baltimore) 2020; 99: e19491. [DOI] [PMC free article] [PubMed] [Google Scholar]
- 36.Chen YL, Lin PY, Ming YZ, et al. The effects of the location of cancer stem cell marker CD133 on the prognosis of hepatocellular carcinoma patients. BMC Cancer 2017; 17: 474. [DOI] [PMC free article] [PubMed] [Google Scholar]
- 37.Cancer Genome Atlas, Research N, Weinstein JN, Collisson EA, et al. The cancer genome atlas pan-cancer analysis project. Nat Genet 2013; 45: 1113–1120. [DOI] [PMC free article] [PubMed] [Google Scholar]
- 38.Hutter C, Zenklusen JC.The cancer genome atlas: creating lasting value beyond its data. Cell 2018; 173: 283–285. [DOI] [PubMed] [Google Scholar]
- 39.Bao ZS, Chen HM, Yang MY, et al. RNA-seq of 272 gliomas revealed a novel, recurrent PTPRZ1-MET fusion transcript in secondary glioblastomas. Genome Res 2014; 24: 1765–1773. [DOI] [PMC free article] [PubMed] [Google Scholar]
- 40.Zhao Z, Meng F, Wang W, et al. Comprehensive RNA-seq transcriptomic profiling in the malignant progression of gliomas. Sci Data 2017; 4: 170024. [DOI] [PMC free article] [PubMed] [Google Scholar]
- 41.Hu H, Mu Q, Bao Z, et al. Mutational landscape of secondary glioblastoma guides MET-targeted trial in brain tumor. Cell 2018; 175: 1665–1678. [DOI] [PubMed] [Google Scholar]
- 42.Murat A, Migliavacca E, Gorlia T, et al. Stem cell-related “self-renewal” signature and high epidermal growth factor receptor expression associated with resistance to concomitant chemoradiotherapy in glioblastoma. J Clin Oncol 2008; 26: 3015–3024. [DOI] [PubMed] [Google Scholar]
- 43.Lee Y, Scheck AC, Cloughesy TF, et al. Gene expression analysis of glioblastomas identifies the major molecular basis for the prognostic benefit of younger age. BMC Med Genomics 2008; 1: 52. [DOI] [PMC free article] [PubMed] [Google Scholar]
- 44.Cancer Genome Atlas, Research N, Linehan WM, Spellman PT, et al. Comprehensive molecular characterization of papillary renal-cell carcinoma. N Engl J Med 2016; 374: 135–145. [DOI] [PMC free article] [PubMed] [Google Scholar]
- 45.Louis DN, Perry A, Reifenberger G, et al. The 2016 world health organization classification of tumors of the central nervous system: a summary. Acta Neuropathol 2016; 131: 803–820. [DOI] [PubMed] [Google Scholar]
- 46.Suvorov RE, Kim YS, Gisina AM, et al. Surface molecular markers of cancer stem cells: computation analysis of full-text scientific articles. Bull Exp Biol Med 2018; 166: 135–140. [DOI] [PubMed] [Google Scholar]
- 47.Kim YS, Kaidina AM, Chiang JH, et al. Molecular markers of cancer stem cells verified in vivo. Biomed Khim 2016; 62: 228–238. [DOI] [PubMed] [Google Scholar]
- 48.Kuroda N, Toi M, Hiroi M, et al. Review of papillary renal cell carcinoma with focus on clinical and pathobiological aspects. Histol Histopathol 2003; 18: 487–494. [DOI] [PubMed] [Google Scholar]
- 49.Kim K, Ro JY, Kim S, et al. Expression of stem-cell markers OCT-4 and CD133: important prognostic factors in papillary renal cell carcinoma. Hum Pathol 2012; 43: 2109–2116. [DOI] [PubMed] [Google Scholar]


