Abstract
In this study, the Land Use/Land Cover (LULC) change has been observed in wetlands comprises of Manchar Lake, Keenjhar Lake, and Chotiari Reservoir in Pakistan over the last four decades from 1972 to 2020. Each wetland has been categorized into four LULC classes; water, natural vegetation, agriculture land, and dry land. Multitemporal Landsat satellite data including; Multi-Spectral Scanner (MSS), Thematic Mapper (TM), and Operational Land Imager (OLI) images were used for LULC changes evaluation. The Supervised Maximum-likelihood classifier method is used to acquire satellite imagery for detecting the LULC changes during the whole study period. Soil adjusted vegetation index technique (SAVI) was also used to reduce the effects of soil brightness values for estimating the actual vegetation cover of each study site. Results have shown the significant impact of human activities on freshwater resources by changing the natural ecosystem of wetlands. Change detection analysis showed that the impacts on the land cover affect the landscape of the study area by about 40% from 1972 to 2020. The vegetation cover of Manchar Lake and Keenjhar Lake has been decreased by 6,337.17 and 558.18 ha, respectively. SAVI analysis showed that soil profile is continuously degrading which vigorously affects vegetation cover within the study area. The overall classification accuracy and Kappa statistics showed an accuracy of >90% for all LULC mapping studies. This work demonstrates the LULC changes as a critical monitoring basis for ongoing analyses of changes in land management to enable decision-makers to establish strategies for effectively using land resources.
Keywords: Wetlands, Land Cover, Vegetation Index, GIS, SAVI, Sindh
Introduction
Wetlands are part of the Earth’s structure which is considered one of the most important ecosystems on Earth after the interior lands. 1 In general, wetlands have substantial integrity to biotic and abiotic factors including limnological and hydrological scenarios, and also have culturally and aesthetically important for recreation and tourism activities.1,2 On the other side, the freshwater resources are mainly consisting of wetlands along with surface water which fulfills the domestic and agriculture needs that support the aquatic ecosystem as a potential source of protein and nutrients.3–5 The bulk of human operations are carried out on lands that in turn consume the natural resources, affect the environment and lead to land use land cover (LULC) change. LULC is one of the chief elements used in environmental change and sustainable development thanks to its generality on the local scale and its worldwide known environmental trend.6,7 Therefore, it is ethical right to monitor the changes in wetlands from preventing further losses by acquiring up-to-date LULCC information for better environmental management to understand the direct and indirect impacts on the ecosystem and for sustainable devolvement.2,8,9 de Almeida et al. 10 investigated the LULCC and its impact on the landscape against the backdrop of oil palm agriculture using multi-temporal study spanning the years 1991 to 2013. The study revealed that 47.7% of primary forest was converted for other purposes, 17% of degraded forest increased, and 11% of oil palm plantation increased. During the 22-year study period, 30% of the primary forest was converted to oil palm plantation; nevertheless, between 2005 and 2013, primary forest conversion to oil palm rose by only 2%. The land surface temperature (LST) in Pakistan’s lower Himalayan regions has been evaluated from 1990 to 2017 by Ullah et al., 11 The LST results for LULC classes revealed that the built-up area had the largest mean LST as compared to other classes,while the results revealed a 5.75% and 4.22% rise in built-up area and bare soil respectively, while vegetation decreased by 9.88% during the study period. A hybrid prediction model based on cellular automata and artificial neural network (CA-ANN) was used, with transfer potential matrices obtained from the years 2002 and 2017 for simulation of LULCC between the years 2032 and 2047. According to the LULC and LST future projections, the built-up region is reported to be increased by 12.48% and 14.65% in 2032 and 2047, respectively, of the total LULC area, which was 11% in 2017. On the other side, the vegetation patterns have been analyzed for their long term dynamics by Yohannes et al. 12 The LULC images were mapped from 1972, 1987, 2002 and 2017 to 2047 and 2032. In addition, the factor analysis was used to choose the individual core landscape structure and landscape configuration metrics. A comparison of the postclassements found that the cover of natural trees, grassland, barren land and water sources dropped by 89,9%, 67,9%, 67,8% and 15,9%, respectively between 1972 and 2017. In 2032 and 2047 a similar tendency is supposed to be continued, with the group of plantations marginally decreasing in 2047. Remote sensing (RS) is an indispensable technology for the observation of Earth resources and LULCC detection.11,13,14 The RS data can provide timely, credible, and comprehensive information on degraded lands at definite time intervals in a cost-effective way. 15 Furthermore, it can monitor larger areas throughout satellite imageries assess ecological changes without distressing the landscape.13,16 Geographic Information System (GIS) and satellite imagery are increasing awareness of learning data, new patterns of detection, inter-relationships in the dynamic coastal environment.17,18 Moreover, GIS can facilitate smart decision-making in assessing coastal vulnerability, land use and coastal cover, urban planning, conservation of the threatened coastal environment, and dynamic shoreline transformation.13,15,19 It has been reported that LULC with the help of RS along with GIS tools can investigate several environmental changes, such as water cycle, temperature regime, and other ecological processes which obstruct the sustainability of ecosystems.20,21 Several LULC changes based on GIS tools have been studied during 40 years in the Lauderan region of Pakistan by Hussain et al. 15 The study considered four key LULC types including water bodies, built-up area, bare soil, and vegetation. The obtained results indicated substantial transformation in bare soil, water bodies and cultivated areas caused by human impacts along with consequent need for arable areas. 15 The LULC mapping has been done most effectively through satellite images of various spectral, spatial, and temporal resolutions.6,7,20 Multi-Spectral Scanner (MSS), Thematic Mapper (TM), and Operational Land Imager (OLI) provide numerous satellite data which are of crucial importance for the evaluation of LULCC.13,20 The MSS sensors were known as line scanning devices detecting the earth perpendicular to the orbital track. 22 While TM sensors are more progressive sensors designed for achieving enhanced image resolution and better geometric fidelity with great accuracy rather than the MSS sensors. 23 The OLI sensors are a progression in Landsat sensor technology. It can measure in the visible and short wave infrared portions. 17 Besides, it can provide abundant resolution to differentiate topographies and features, such as urban areas, farms, forests, and other land uses. 24 On the other hand, Soil Adjusted Vegetation Indices (SAVI) was found to have great accuracy in categorizing and classifying the wetlands and areas. 2 It has a high correlation as well as can be used to monitor shifting vegetation.25,26 The precision of various vegetation indices NDVI and SAVI have been evaluated by Chuvieco et al. 27 for burned land mapping. Six Landsat TM have been considered to conform pre-and post-fire conditions for several burned areas in Mediterranean countries (Italy, Greece, and Spain). Furthermore, Escuin et al. 28 considered the capacity of NDVI indices resulting from Landsat TM/ETM images for the determination of fire risk in three fires in southern Spain. Generally, the LULC change has significant environmental consequences since it directly linked to land degradation over a period of time which resulting in multiple environmental changes. The landscape structure, and change in configuration of the Corazón de Oro Forest, Southern Ecuador was evaluated by López et al. 29 for the assessment of LULCC. The findings revealed a largely static landscape structure over time. Moreover, the establishment of the protected area altered considerably the vegetation composition and minimized the human impact on evergreen montane ecosystems.
In general, studies on LULCC and landscape structure quantification in Pakistan have not been well-targeted considering the high variability in the landscape of the Sindh country. Estimating wetlands of Sindh requires a complex and multidimensional understanding of LULC assessments that are not fully covered by the current mitigation-based tools portfolio. Therefore, an integrated system requires a new generation of dynamic approaches that can assess the economic, social, and environmental dimensions of freshwater resources in a sustainable, comprehensive way. Toward this end, the purpose of this research is to demonstrate an applied and novel approach to the LULC dynamics of the wetlands of Sindh. Additionally, assess past and current environmental conditions to better plan for sustainable wetland conversion and prevent further losses.
Study area
The sites selected in this study; Lake Manchar, Lake Keenjhar, and Chotiari Reservoir have great significance concerning Pakistani society and the environment. They have a major freshwater resource and are home to a wide variety of species and migratory birds. Any mishap with these sites will upset the entire Sindh province. For this reason, these three sites were chosen to monitor for decadal changes.
Manchar lake
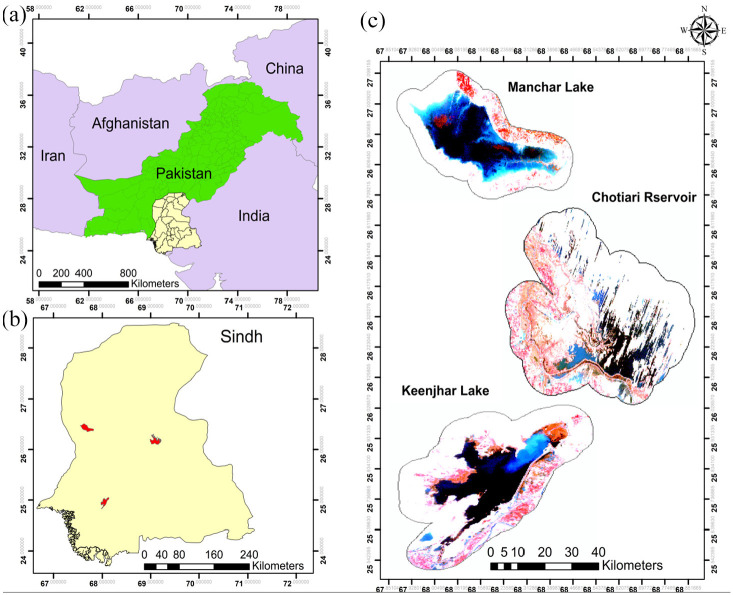
Manchar is located in the western part of the Indus River at a distance of 18 km from Sehwan Sharif in district Dadu, Sindh (Figure 1). It is considered the largest shallow freshwater lake of Pakistan with an approximate depth of 2.5–3.75 m, constructed in 1930 comprises an area of 350–520 km2 seasonally. 30 Flood embankments were built on the north-eastern and northern boundaries of the lake in 1932. The lake is fed by small streams fringed by the western part of Khirthar Hills and the southern part of Laki Hills. In the last 50 years, human activities and climate change have vigorously affected the original regime of the lake.31,32
Figure 1.
Inset map of study area showing: (a) Pakistan along with neighboring countries, (b) Sindh highlighted with study areas, and (c) wetland Sites.
Keenjhar lake
Keenjhar has situated about 113 km from Karachi, in district Thatta, Sindh (Figure 1). It is one of the largest freshwater lakes covering 145 km2 areas with 8 m depth. This lake was formed by the consolidation of Sonehri and Keenjhar lakes in 1930.33,34 The main feeding source of Keenjhar is the Kalri Baghar Canal and small seasonal streams. The southeastern boundary of the lake is the only outlet through Jam Branch Canal. People of Karachi, Thatta, and Ketibunder mainly depend on Keenjhar for water supply. Keenjhar lake deterioration has been reported due to the KB Feeder Canal, Haroolo Drain, and different anthropogenic activities including the direct disposal of toxic and hazardous waste in the lake. 35
Chotiari reservoir
District Sanghar comprises a great number of ponds, lakes, and reservoirs of freshwater and brackish wetlands. 36 Chotiari Reservoir located on the western flanks of Achro Thar Desert, at a distance of about 30–35 km north-east of Sanghar town (Figure 1), covering an area of about 18,000 ha with a water storage capacity of 92,511 ha. The construction is started in 1994 along the left bank of Nara Canal at a natural depression and completed in 2003. It has a variety of Flora and Fauna diversity along the Nara river course and embankment especially rich in the mammal population. 37 The average maximum temperature in summer is about 40°c with an average evaporation rate of 11mm. Chotiari is facing the depletion of its irrigation, forest, and fish resources over the last 5 years.
Materials and methods
The present study evolves the LULC analysis for the years 1972, 1986, 1992, 2000, 2010, and 2020 comprised of three wetland sites (1) Manchar Lake; (2) Keenjhar Lake; and (3) Chotiari Reservoir. The acquired data were classified into four LULC categories namely natural vegetation, water, agriculture land, and dry land for further analysis (Table 1).
Table 1.
The classification scheme used in the study.
| Id | Land use/land cover | Description |
|---|---|---|
| 1 | Natural vegetation | The areas with natural vegetation cover in the form of herbs, shrubs, grassland, trees, and other plants. |
| 2 | Water | It comprises all forms of surface water present in drains, canals, ponds, lakes, wetlands, etc. |
| 3 | Agriculture | This class consists of cultivated and non-cultivated areas. |
| 4 | Dry land | It includes the land left which has no vegetation and has a rough terrain where the moisture is very low. |
Data acquisition
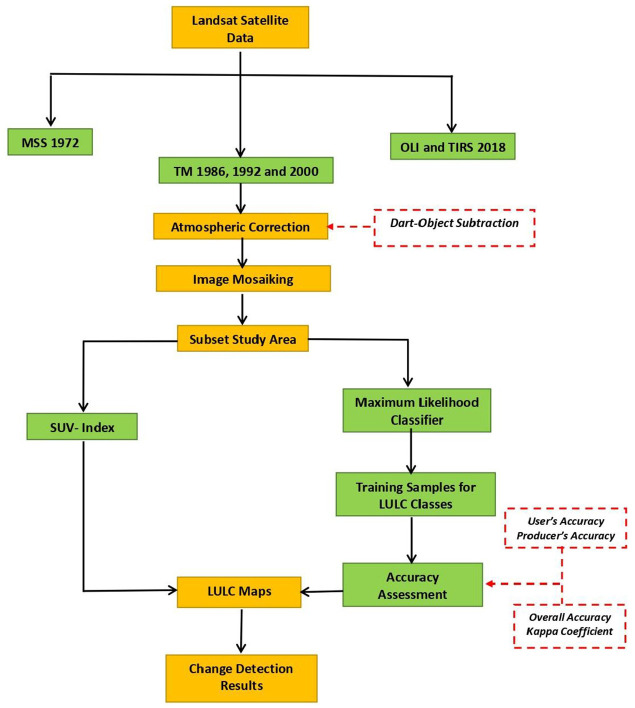
Remote sensing datasets of Landsat MSS, TM, and OLI were used to examine the LULCC and downloaded from the United States Geological Survey (USGS) official website shown in (Table 2). The detailed proposed methodology for this study is shown in Figure 2.
Table 2.
Details of acquired satellite data.
| Satellite id | Sensor id | Month/year | Spatial resolution | Source |
|---|---|---|---|---|
| Landsat 1 | MSS | September/1972 | 60 m | USGS website |
| Landsat 4 | TM | September/1986 | 30 m | USGS website |
| Landsat 4 | TM | September/1992 | 30 m | USGS website |
| Landsat 5 | TM | September/2000 | 30 m | USGS website |
| Landsat 5 | TM | September/2010 | 30 m | USGS website |
| Landsat 8 | OLI | September/2020 | 30 m | USGS website |
Figure 2.
Flow chart methodology of LULC change detection.
Image processing
In this study, all the images were projected to Universal Transverse Mercator (UTM) projection; Zone 42°N, World Geodetic System (WGS) 1984 datum.
Atmospheric correction
Atmospheric correction is used to confiscate the effects of the atmosphere on the reflectance values of remotely sensed images. Atmospherically corrected images are likely to give better results when there are multiple images under observation. There are two steps involved in atmospheric correction, in the first step digital numbers (DNs) are converted into radiance then top of atmosphere (TOA) reflectance is converted into surface reflectance. The method can increase the interpretability and accuracy of remote sensing data, which is especially useful when comparing different data sets over time.38,39 In this study, the Dark Object Subtraction method was applied to correct the atmospheric scattering in the geographic information system (GIS) environment. DOA method eliminates the dark objects (which have very low reflectance) from the image to remove the atmospheric effects and normalize the image. 38 The images obtained after calibration have been used for LULC classification.
SAVI analysis
Huete’s proposed transformation technique has been used in this study to normalize the soil background effect which influences the low vegetative areas by the reflectance of light in the Red and NIR spectra due to more soil exposure. 40 According to the Huete formula, SAVI can be described by (equation (1)). In this mathematical expression the factor L = 0.5, which is used as soil property constant, to reduce the effects of soil brightness values41,42 and provides a more precise and accurate vegetation index. 40
| (1) |
Results
SAVI analysis
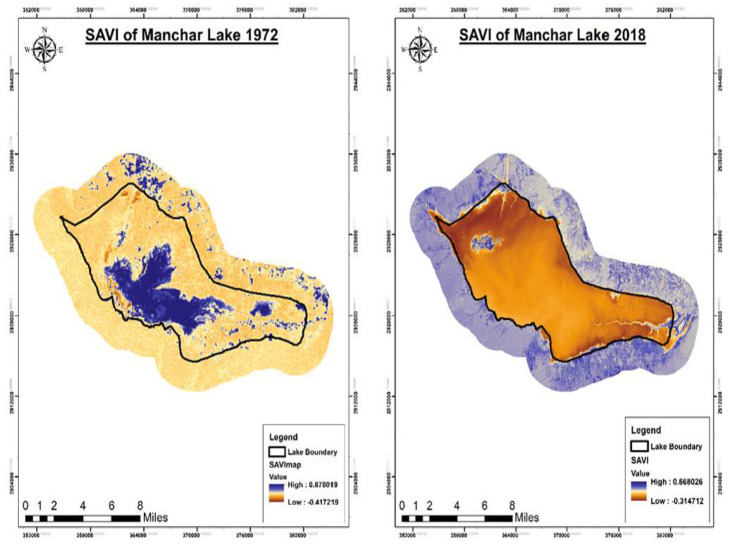
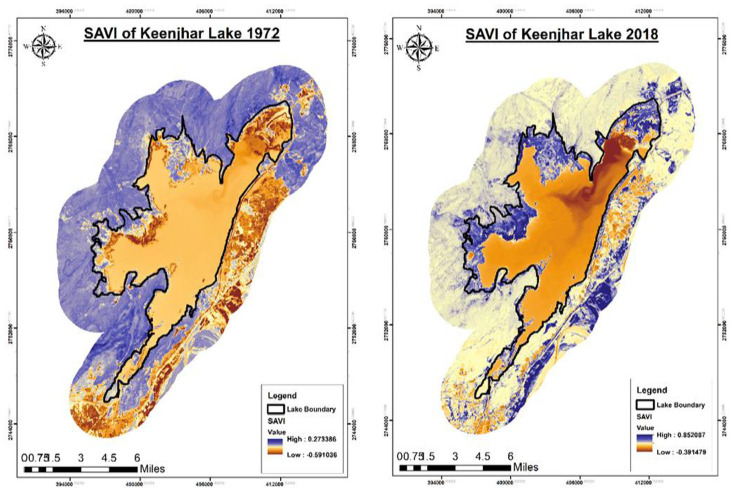
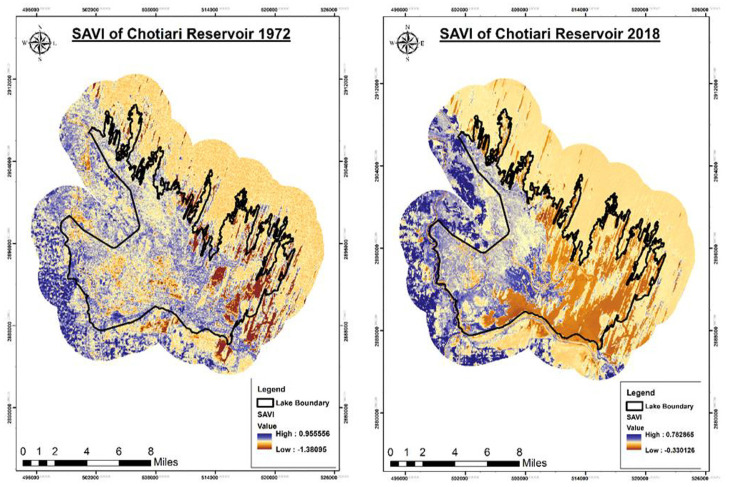
Results of SAVI analysis showed that wetlands face great variations in vegetation indices which affect their natural ecosystem and habitat (Figures 3–5). SAVI indices of Manchar Lake in 1972 were 0.67 when the water availability was only 3666.9 hectares. As time passed, the water availability increases but the quality continues to degrade because of industrial effluents and sewage water discharge which drastically affects the vegetation cover. Several studies have been done on the physiochemical assessment of Manchar Lake. The constant source of pollutants including domestic, agricultural, and industrial is the Main Nara Valley Drain (MNVD) which continuously deteriorating this valuable wetland. 41 It has been reported that the concentration of Se, Pb, Ni, K, Na, Mg, Fe, Cd, Ca, As, and Al exceeded the permissible limits.32,44,45 The water of Manchar Lake has an alkaline pH and having higher conductivity and hardness values, which resulted in the loss of vegetation cover and agricultural productivity. It also threatens the natural aesthetics of wetland as well as to the indigenous community. 46 The continuous increase of wastewater discharge and excessive use of pesticides and fertilizers lead to affect the natural vegetation and also affect the soil quality. 47
Figure 3.
SAVI of Manchar 1972 and 2018.
Figure 4.
SAVI of Keenjhar 1972 and 2018.
Figure 5.
SAVI of Chotiari 1972 and 2018.
Maximum likelihood classification
Maximum Likelihood Classification (MLC) is considered one of the most common techniques used for image classification in remote sensing. 48 MLC can classify unknown pixels by evaluating variance and covariance of spectral response.13,17 It can place the pixels in the class where the highest probability exists.25,49 Based on the characteristics of the area, a classification scheme was developed for further image analysis by MLC. The study covers wetlands of different sizes of deep and shallow water so it has classified as a class of water. The buffer zone of all wetland sites is included in bare land and agricultural land as it is mostly covered with settlements and agriculture fields. While the vegetative structure of the wetlands was classified as natural vegetation. After making the signature files, MLS was applied on all remotely sensed images.
Classification accuracy assessment
Accuracy assessment plays an important role in image classification to validate the LULC. In MLS, many pixels remain misclassified because of the uneven distribution of the data. In this study, an accuracy assessment was conducted by summarizing and quantifying the data using an error matrix. Four different accuracy results were produced including producer accuracy, user accuracy, overall accuracy, and kappa coefficient index from overall accuracy assessment which provide a better understanding of the classification accuracy. The overall accuracy was computed for each satellite image of Lake Manshar in 1972, 1986, 1992. 2000, 2010 and 2020 are given as 99.71%, 99.59%, 100%, 98.50%, 98.62%, and 99.66%, respectively, with kappa statistics of 0.99, 0.99, 1.00, 0.97, 0.97, and 0.99, respectively. The overall accuracy results for Keenjhar Lake in 1972, 1986, 1992. 2000, 2010, and 2020 are 99.46%, 99.30, 99.27%, 95.07%, 93.95%, and 92.85% having kappa results 0.99, 0.98, 0.98, 0.93, 0.91, and 0.90, respectively. The accuracy assessment of Chotiari Reservoir provides overall accuracy of 96.17%, 98.01%, 96.17%, 98.94%, 96.40%, and 95.92% with calculated kappa statistics of 0.94, 0.96, 0.94, 0.98, 0.94, and 0.94 from 1972 to 2020, respectively. The overall assessment results of each classified image from 1972 to 2020 are shown in (Figures 6–8 & Table 3).
Figure 6.
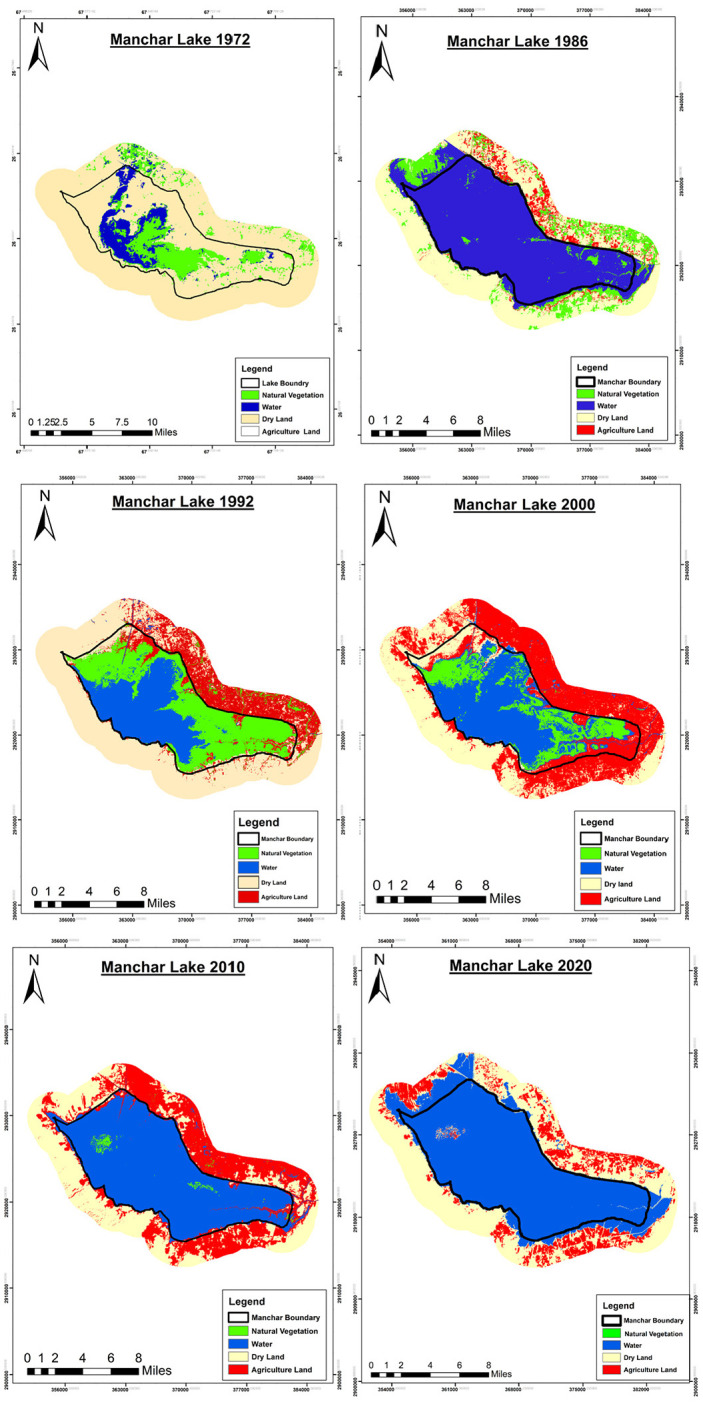
LULC maps of Manchar Lake from 1972 to 2020.
Figure 7.
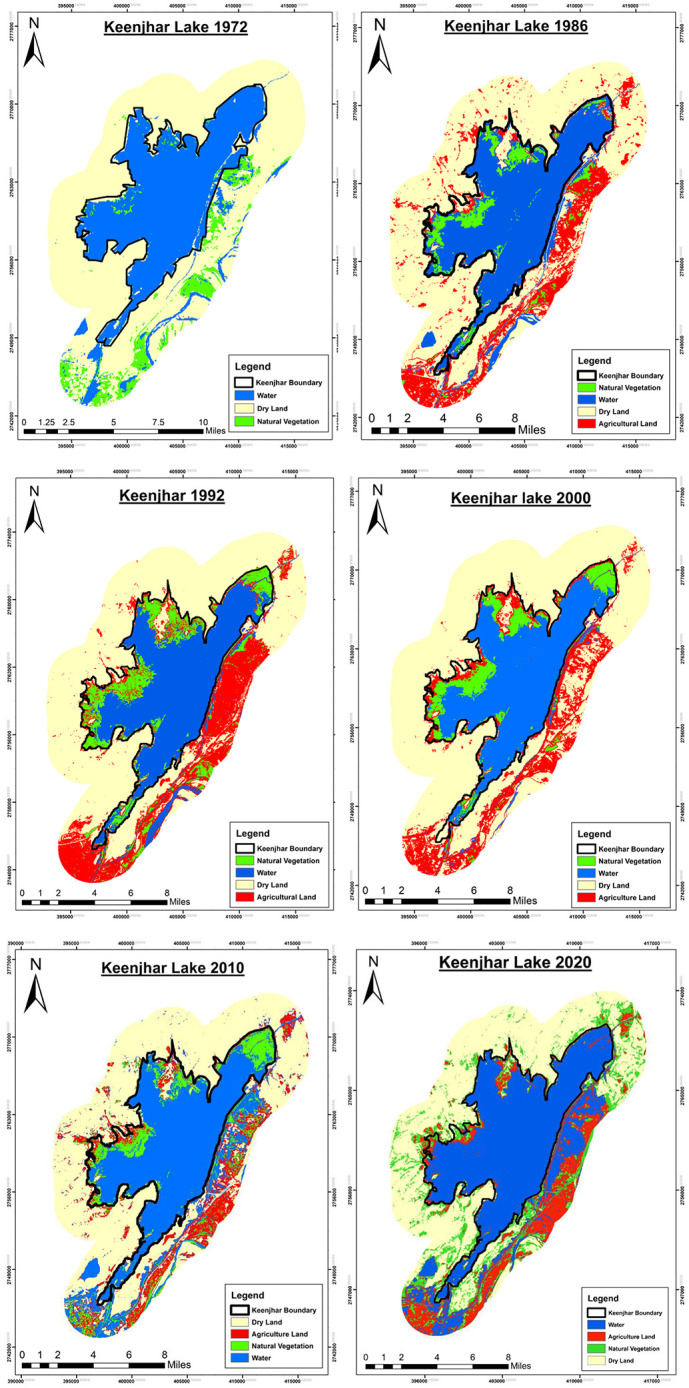
LULC maps of Keenjhar Lake from 1972 to 2020.
Figure 8.
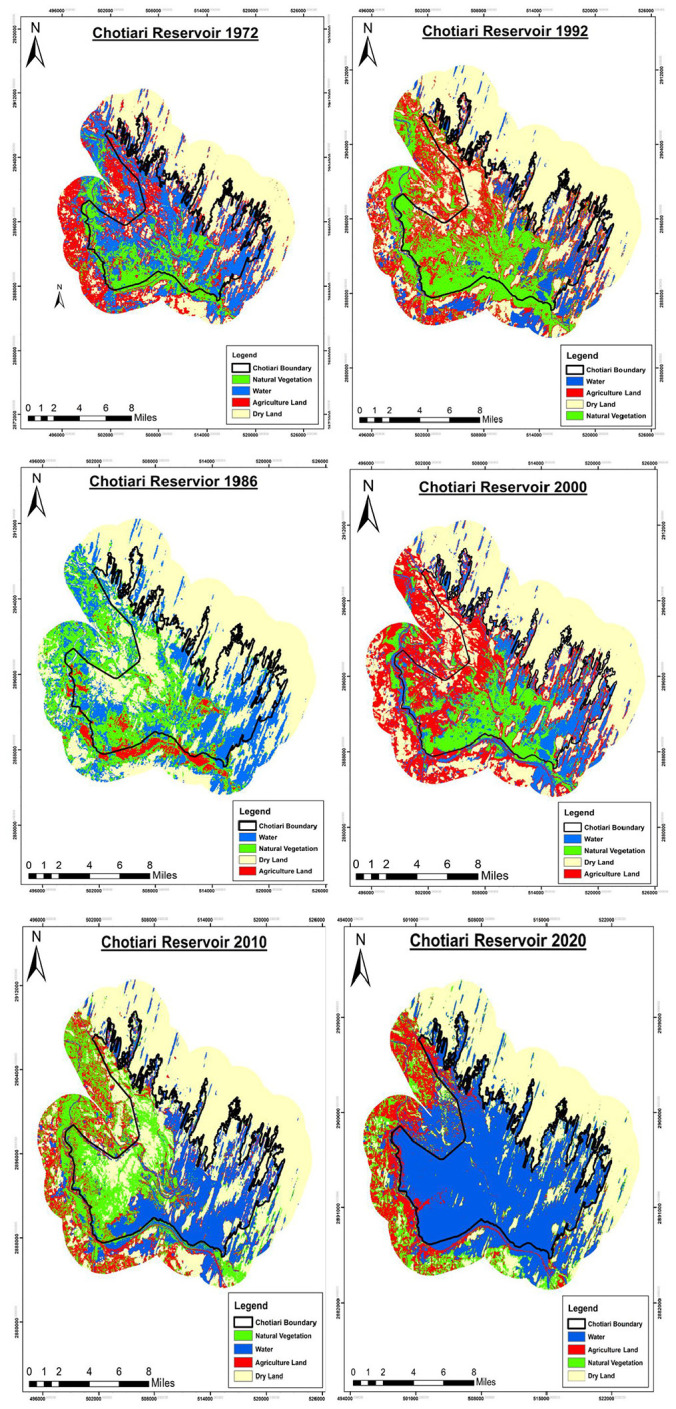
LULC maps of Chotiari Reservoir from 1972 to 2020.
Table 3.
A statistical table showing the LULC change and accuracy assessment from 1972 to 2020.
| Manchar Lake |
Keenjhar Lake |
Chotiari Reservoir |
||||||||||||||||
|---|---|---|---|---|---|---|---|---|---|---|---|---|---|---|---|---|---|---|
| Area (ha) |
Area (ha) |
Area (ha) |
||||||||||||||||
| 1972 | 1986 | 1992 | 2000 | 2010 | 2020 | 1972 | 1986 | 1992 | 2000 | 2010 | 2020 | 1972 | 1986 | 1992 | 2000 | 2010 | 2020 | |
| Water | 3666.9 | 23,717.9 | 8488.6 | 11,647.1 | 21,036.8 | 25,041.7 | 14,937.5 | 12,675.7 | 10,682.5 | 10,510.1 | 14,428.1 | 11,070.2 | 16,426.8 | 13,198.3 | 6240.3 | 9458.9 | 11,072.7 | 5814.1 |
| Naturalvegetation | 6510.6 | 5539.2 | 10,691.6 | 5375.2 | 369.6 | 173.4 | 2751.48 | 1959.5 | 3642.8 | 2607.39 | 3519.72 | 2193.3 | 7230.6 | 2397.2 | 12,802.7 | 7342.1 | 11,369.3 | 12,703.3 |
| Agricultureland | 0.0 | 4761.8 | 8515.9 | 12,555.1 | 9692.8 | 3214.8 | 0.0 | 6092.5 | 7565.7 | 6153.3 | 4257.4 | 7938.4 | 13112.3 | 12,528 | 12,379.1 | 15,837.4 | 7094.4 | 12,462.9 |
| Dry land | 36,274.7 | 2394.6 | 18719.8 | 11,839.7 | 12,316.4 | 19,984.1 | 25,067.2 | 21,996.8 | 20,843.6 | 23,456.3 | 20,527.2 | 21,524.4 | 21,459.6 | 29,191.6 | 26,782.7 | 25,566.1 | 28,661.3 | 27,224.5 |
| Overallaccuracy (%) | 99.71 | 99.59 | 100 | 98.50 | 98.62 | 99.66 | 99.46 | 99.30 | 99.27 | 95.07 | 93.95 | 92.85 | 96.17 | 98.01 | 96.17 | 98.94 | 96.40 | 95.92 |
| Kappaco-efficient (%) | 0.99 | 0.99 | 1.0 | 0.97 | 0.97 | 0.99 | 0.99 | 0.98 | 0.98 | 0.93 | 0.91 | 0.90 | 0.94 | 0.96 | 0.94 | 0.98 | 0.94 | 0.94 |
Discussion
In this study, the LULC analysis and Landsat imagery helped to identify the changes in wetlands from 1972 to 2020. Also, the drifts of impacts on wetlands due to unplanned agricultural activities and excessive discharge of industrial and sewage wastewater have been identified. The satellite images after image processing showed the LULC of the study area in Figures 6 to 8. These classified images present a better understanding of the LULC patterns of the study area. The present study reveals that the spatial patterns of land use are continuously increasing in an unplanned manner which leads to cause many environmental issues. The gained data from Figures 6 to 8 revealed that there was a rapid increase in the amount of wastewater discharge into the wetlands and also the excessive use of synthesized chemicals in agricultural activities which can harm the environment and affect public health. Table 3 summarizes the area statistics of the analyzed LULC from 1972 to 2020. Water availability and natural land cover have a major role in newly emerging croplands. However, the decrease in water availability and unplanned agricultural practices can affect the aesthetics of the natural land cover and also drive desertification and soil erosion. The overall changes in the availability of each variable in wetland locations are illustrated in (Table 3) which shows both increasing and decreasing trends. The classified images of the whole studied sites; Manchar Lake, Keenjhar Lake, and Chotiari Reservoir show a significant variation that tends to be invisible reduction over the last 10 years in the whole studied classes; water, natural vegetation, agricultural land, and dry land (Table 3). This indicates the extent of the negative impacts that humans may have on the environment, which must be addressed. Similarly, the dynamics of plant and temperature were investigated using NDVI from 1972 to 2017 in Ekiti State, Nigeria. 13 The resultant LULC maps indicated a decrease in forests and woodlands at a change rate of 51.25 and 0.72% over the studied period, however croplands, bare soils, and water sources have been increased by 267.58, 197.30, 714.11, and 4421.43%, respectively. The classified images of Manchar Lake in 1972 show that 6,510.6 ha were occupied by natural vegetation, which had shrunk to 173.43 ha in 2020. As for Keenjhar Lake which was occupied by 2751.48 ha of natural vegetation in 1972 has become 2193.3 ha in 2020. While the natural vegetation sites have become 12703.3 ha in 2020 after being 7230.6 ha in 1972 at the studied Chotiari Reservoir site. This significant decline in vegetation is attributed to the excessive discharge of industrial, municipal, and agricultural constituents through MNVD which also affects the availability of agricultural land (Figure 9) within the buffer zone of the wetland. The average availability of water during the pre and post-monsoon season has been increased due to the excessive discharge of wastewater and effluents in Manchar. Similarly, Keenjhar Lake is facing somehow the same environmental issues which conquered the natural aesthetic of wetland. Several studies have reported that the pollution rate in Kenjar is constantly increasing and threatening aquatic life as well as the local community. It was also observed that the natural vegetation cover had been depleted from 2751.48 to 2193.3 ha (Table 3) during the study period of this research. The continuous pollution load on Keenjhar via the KB Feeder Canal, Haroolo Drain, and municipal solid waste disposal contributes to the deterioration of this important wetland and gradually affects the soil quality, and tends to increase soil salinity. The variations in coastal belt characteristics including built-up land cover, mangroves & vegetation cover, and interrelationship of coastline morphology at the Karachi Coast (FKC) boundary, Pakistan have been studied by Khan et al. 19 In similar, the land parcels recognized with a reduction in vegetation cover of mangroves by the built-up at respective sites of the FKC. Dense mangroves on the FKC are found to be declining dramatically from 119.7 to 96.3 hectares over the period 2010–2018. Moreover, our interpretation agrees with Kazi et al. 50 The water quality of Manchar Lake has been assessed based on multivariate statistical techniques. Complex water quality data sets have been evaluated and interpreted to gain improved knowledge on the water quality of Manchar Lake. The results showed that the main causes of the deterioration in water quality were attributed to the inflow of effluents from industrial, household, agricultural and saline seeps into the lake. Chotiari is an off-canal reservoir to store floodwater in the Indus River from June to September. It is constructed according to sustainable agricultural practices during the offseason of water when the flow of the Indus River at its minimum level. The obtained results revealed that this vital resource has disappeared due to the improper management and anthropogenic activities which vigorously affect the natural regime of the reservoir as shown in Figures 6 to 8. In another study, 51 the study aimed to determine the impact of the Chotiari reservoir construction on the vegetation cover and water saturation in the adjacent areas of the reservoir by using RS and geospatial tools. Satellite imagery analysis of the 5 km buffer zone around the perimeter of the reservoir showed that about 9% of the natural vegetation cover has reduced within the lake boundaries owing to the diversion of natural wetlands into the reservoir and led to lake depletion and to an environmental catastrophe.
Figure 9.
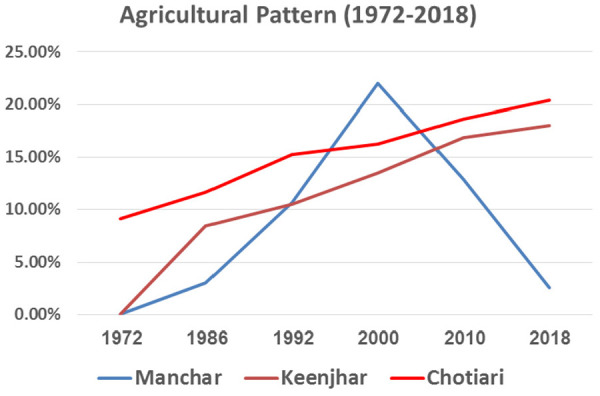
The agricultural trend over the wetland sites.
Conclusion
This research study focused on the major wetlands of Sindh in which remote sensing along with GIS tools are coupled to examine the LULC dynamics and mapped the changes that occurred within the study area. Results illustrate the increasing anthropogenic activities including the industrial effluents, municipal discharge, waste disposal, and increase in population which lead to the direct and indirect impacts on LULC of the wetlands. The net decrease in the vegetation cover of Manchar lake is 6337.17 ha during the study period which attributes to the expansion of agriculture. The Main Nara Valley is the main source of industrial and domestic effluents which deteriorate the water quality of Manchar. While the Chotiari is suffering from the lack of water availability up to 64.60% due to the least flow of Indus and illegal construction of watercourses along the Chotiari. The continuous discharge of pollutants from KB Feeder Canal, Haroolo Drain, municipal and agricultural runoff has decreased the Vegetation of cover Keenjhar was by 558.18 ha. It is revealed that the ground roots of wetlands degradation are lack of proper freshwater recharge of wetlands through rivers and canals, extensive agricultural expansion, untreated industrial and wastewater discharge, urban expansion, and excessive drawing of groundwater. This study has limitations to encompass the aspect ratio between MSS, TM, and OLI. However, it concludes a more comprehensive scientific study to evaluate the current and future scenarios for ongoing analyses of changes in land management to enable decision-makers to establish strategies for effectively using land resources.
Author biographies
Hamza Islam, a University of Sindh Bachelors graduate, is currently an M.Phil. Scholar in the Center of Environmental Sciences. His Bachelors focused on research Remote Sensing and GIS applications for environmental assessment and monitoring. His current research interests include the development of an integrated AI based algorithm for the assessment of greenhouse gases through space borne sensors. Mr. Hamza Islam also has many research publications in reputable journals. He also served as a Research Assistant on different research projects.
Dr. Habibuulah Abbasi received the Ph.D. degree in Environmental Sciences from University of Sindh, Jamshoro in 2011. He currently works as an assistant professor at the Center of Environmental Sciences, University of Sindh, Jamshoro. Also, he worked as Scientific Officer, Assistant Professor, and Visiting Scholar in many highly reputable Institutions. His current research interests include Atmospheric Environment, Interpretation of Earth’s surface by satellites to find out effective ways to monitor global and regional changes on Earth surface, including the application of Climate and Environmental modeling. Dr. Habibullah Abbasi has been Principal Investigator of his research team in several National and International projects and serves as a peer reviewer for several national and international peer reviewed journals.
Dr. Ahmed Karam is an assistant professor in the Civil & Infrastructure Engineering and Management Program, Faculty of Engineering and Applied Science, Nile University - Egypt. He is working in the field of environmental engineering for more than 8 years between teaching in the largest universities and designing in diverse consulting offices in Egypt. He has many publications distributed between high impacted journals (Q1 & Q2) and conferences. Also, he serves as a peer reviewer for several Elsevier, Springer, Sage and Taylor & Francis journals. He received the recognized reviewer award from many international journals. Dr. Karam served as Co-PI and senior research assistant for many national and international funded grants with total budget (988,219 $/5years). Dr. Karam is a specialist in water/wastewater pilot plants design, fabrication and implementation. He is also focusing on wastewater treatment and applying different optimization techniques using artificial intelligence and linear regression analysis.
Ali Hassan Chughtai is a PhD candidate in the Center of Environmental Sciences at University of Sindh. He has many national and international research publications in peer reviewed journals. He also serves as a Peer Reviewer for Elsevier Journal. His current research is concerned with AI based classification algorithms. He has worked on Environmental Assessment research projects with several domestic research institutions.
Mansoor Ahmed Jiskani received his BS degree in Environmental Science from University of Sindh, Jamshoro in 2017, and completed his MS degree in Integrated Water Resource Management from U.S-Pakistan Center for Advance Studies in Water, Mehran University of Engineering and Technology in 2021, and now currently working as research assistant at U.S-Pakistan Center for Advance Studies in Water, Mehran University of Engineering and Technology, his current research interest include; hydrological modeling and climate change, environmental monitoring and remote sensing.
Footnotes
Authors’ contributions: HI: Gathered, interpreted, and analyzed the satellite data of wetlands and their buffers. HA: Supervised this research, guides the authors, and provides resources. He also participated in the drafting of the manuscript. AK: Plays a major role in writing, editing, and reviewing the manuscript. MA: Contributed to the assessment of Soil Adjusted Vegetation Index and Normalized Vegetation Index to developed maps. AH: Performed the field survey and helps to perform the geometric and atmospheric correction of the data. All authors read and approved the final manuscript.
The author(s) declared no potential conflicts of interest with respect to the research, authorship, and/or publication of this article.
Funding: The author(s) received no financial support for the research, authorship, and/or publication of this article.
Ethical approval: This research does not contain any studies with human participants or animals performed by any of the authors.
Consent to participate/informed consent: Informed consent was obtained from all individual participants included in the study.
ORCID iDs: Hamza Islam  https://orcid.org/0000-0002-1337-332X
Ahmed Karam  https://orcid.org/0000-0002-2075-653X
Availability of data and materials: The datasets used and/or analyzed during this study are available from the corresponding author on reasonable request.
References
- 1.Stagg CL, Osland MJ, Moon JA, et al. Quantifying hydrologic controls on local-and landscape-scale indicators of coastal wetland loss. Ann Bot 2020; 125(2): 365–376. [DOI] [PMC free article] [PubMed] [Google Scholar]
- 2.Rhyma PP, Norizah K, Hamdan O, et al. Integration of normalised different vegetation index and soil-adjusted vegetation index for mangrove vegetation delineation. Remote Sens Appl 2020; 17: 100280. [Google Scholar]
- 3.Elawwad A, Karam A, Zaher K. Using an algal photo-bioreactor as a polishing step for secondary treated wastewater. Pol J Environ Stud 2017; 26(4): 1493–1500. [Google Scholar]
- 4.Kumwimba MN, Dzakpasu M, Li X. Potential of invasive watermilfoil (Myriophyllum spp.) to remediate eutrophic waterbodies with organic and inorganic pollutants. J Environ Manag 2020; 270: 110919. [DOI] [PubMed] [Google Scholar]
- 5.Karam A, Bakhoum ES, Zaher K. Coagulation/flocculation process for textile mill effluent treatment: experimental and numerical perspectives. Int J Sustain Eng. Epub ahead of print 11November2020. DOI: 10.1080/19397038.2020.1842547. [DOI] [Google Scholar]
- 6.Fallati L, Savini A, Sterlacchini S, et al. Land use and land cover (LULC) of the Republic of the Maldives: first national map and LULC change analysis using remote-sensing data. Environ Monit Assess 2017; 189(8): 417. [DOI] [PubMed] [Google Scholar]
- 7.Somvanshi SS, Bhalla O, Kunwar P, et al. Monitoring spatial LULC changes and its growth prediction based on statistical models and earth observation datasets of Gautam Budh Nagar, Uttar Pradesh, India. Environ Dev Sustain 2020; 22(2): 1073–1091. [Google Scholar]
- 8.Tripathi DK, Kumar M. Remote sensing based analysis of land use/land cover dynamics in Takula Block, Almora District (Uttarakhand). J Human Ecol 2017; 38(3): 207–212. [Google Scholar]
- 9.Yohannes H, Soromessa T, Argaw M, et al. Spatio-temporal changes in habitat quality and linkage with landscape characteristics in the Beressa watershed, Blue Nile basin of Ethiopian highlands. J Environ Manag 2021; 281: 111885. [DOI] [PubMed] [Google Scholar]
- 10.de Almeida AS, Vieira ICG, Ferraz SFB. Long-term assessment of oil palm expansion and landscape change in the eastern Brazilian Amazon. Land Use Policy 2020; 90: 104321. [Google Scholar]
- 11.Ullah S, Tahir AA, Akbar TA, et al. Remote sensing-based quantification of the relationships between land use land cover changes and surface temperature over the Lower Himalayan Region. Sustainability 2019; 11(19): 5492. [Google Scholar]
- 12.Yohannes H, Soromessa T, Argaw M, et al. Changes in landscape composition and configuration in the Beressa watershed, Blue Nile basin of Ethiopian Highlands: historical and future exploration. Heliyon 2020; 6(9): e04859. [DOI] [PMC free article] [PubMed] [Google Scholar]
- 13.Olorunfemi IE, Fasinmirin JT, Olufayo AA, et al. GIS and remote sensing-based analysis of the impacts of land use/land cover change (LULCC) on the environmental sustainability of Ekiti State, southwestern Nigeria. Environ Dev Sustain 2020; 22(2): 661–692. [Google Scholar]
- 14.Mohajane M, Essahlaoui A, Oudija F, et al. Land use/land cover (LULC) using landsat data series (MSS, TM, ETM+ and OLI) in Azrou Forest, in the Central Middle Atlas of Morocco. Environments 2018; 5(12): 131. [Google Scholar]
- 15.Hussain S, Mubeen M, Ahmad A, et al. Using GIS tools to detect the land use/land cover changes during forty years in Lodhran District of Pakistan. Environ Sci Pollut Res 2020; 27(32): 39676–39692. [DOI] [PubMed] [Google Scholar]
- 16.Qadir J, Singh P. Land use/cover mapping and assessing the impact of solid waste on water quality of Dal Lake catchment using remote sensing and GIS (Srinagar, India). SN Appl Sci 2019; 1(1): 25. [Google Scholar]
- 17.Mallinis G, Mitsopoulos I, Chrysafi I. Evaluating and comparing Sentinel 2A and Landsat-8 Operational Land Imager (OLI) spectral indices for estimating fire severity in a Mediterranean pine ecosystem of Greece. GIsci Remote Sens 2018; 55(1): 1–18. [Google Scholar]
- 18.Mondal B, Dolui G, Pramanik M, et al. Urban expansion and wetland shrinkage estimation using a GIS-based model in the East Kolkata Wetland, India. Ecol Indic 2017; 83: 62–73. [Google Scholar]
- 19.Khan MJ, Zeeshan MM, Ali SS. GIS-based change detection of coastal features along karachi coast Pakistan. Pak J Sci 2020; 72(2): 124. [Google Scholar]
- 20.Fatemi M, Narangifard M. Monitoring LULC changes and its impact on the LST and NDVI in District 1 of Shiraz City. Arab J Geosci 2019; 12(4):1–12. [Google Scholar]
- 21.Ritse V, Basumatary H, Kulnu AS, et al. Monitoring land use land cover changes in the Eastern Himalayan landscape of Nagaland, Northeast India. Environ Monit Assess 2020; 192(11): 1–17. [DOI] [PubMed] [Google Scholar]
- 22.Hasan ME, Nath B, Sarker AH, et al. Applying multi-temporal landsat satellite data and markov-cellular automata to predict forest cover change and forest degradation of Sundarban Reserve Forest, Bangladesh. Forests 2020; 11(9): 1016. [Google Scholar]
- 23.Zhang HK, Roy DP. Landsat 5 thematic mapper reflectance and NDVI 27-year time series inconsistencies due to satellite orbit change. Remote Sens Environ 2016; 186: 217–233. [Google Scholar]
- 24.Storey J, Roy DP, Masek J, et al. A note on the temporary misregistration of Landsat-8 Operational Land Imager (OLI) and Sentinel-2 Multi Spectral Instrument (MSI) imagery. Remote Sens Environ 2016; 186: 121–122. [Google Scholar]
- 25.Ozesmi SL, Bauer ME. Satellite remote sensing of wetlands. Wetl Ecol Manag 2002; 10(5): 381–402. [Google Scholar]
- 26.Pal S, Talukdar S. Drivers of vulnerability to wetlands in Punarbhaba river basin of India-Bangladesh. Ecol Indic 2018; 93: 612–626. [Google Scholar]
- 27.Chuvieco E, Martin MP, Palacios A. Assessment of different spectral indices in the red-near-infrared spectral domain for burned land discrimination. Int J Remote Sens 2002; 23(23): 5103–5110. [Google Scholar]
- 28.Escuin S, Navarro R, Fernandez P. Fire severity assessment by using NBR (Normalized Burn Ratio) and NDVI (Normalized Difference Vegetation Index) derived from LANDSAT TM/ETM images. Int J Remote Sens 2008; 29(4): 1053–1073. [Google Scholar]
- 29.López S, López-Sandoval MF, Gerique A, et al. Landscape change in Southern Ecuador: an indicator-based and multi-temporal evaluation of land use and land cover in a mixed-use protected area. Ecol Indic 2020; 115: 106357. [Google Scholar]
- 30.Islam H, Abbasi H, Sultana G, et al. Spatial-temporal change assessment of Manchar and Keenjhar Lake using RS and GIS. Sindh Univer Res J (Science Series), 2019; 51(2): 223–230. [Google Scholar]
- 31.Sibal LN, Espino MPB. Heavy metals in lake water: a review on occurrence and analytical determination. Int J Environ Anal Chem 2018; 98(6): 536–554. [Google Scholar]
- 32.Arain MB, Kazi TG, Jamali MK, et al. Evaluation of physico-chemical parameters of Manchar Lake water and their comparison with other global published values. Pak J Anal Environ Chem 2008; 9(2): 9. [Google Scholar]
- 33.Lashari K, Korai AL, Sahato GA, et al. Limnological studies of Keenjhar lake, district, Thatta, Sindh, Pakistan. Pak J Anal Environ Chem 2009; 10(–2): 39–47. [Google Scholar]
- 34.Sahato G, Kazi T. Limnological Studies of Keenjhar lake, district, Thatta, Sindh, Pakistan. Pak J Anal Environ Chem 2009; 10(1–2): 9. [Google Scholar]
- 35.Panhwar A, Bhutto S, Rashid U, et al. Effects of historic floodonwater qualityof fresh water reservoir keenjhar Lakeofsindh, Pakistan. Asian J Sci Technol 2019; 10(11): 10499–10505. [Google Scholar]
- 36.Magsi H, Torre A. Social network legitimacy and Property right loopholes: evidences from an infrastructural water project in Pakistan. J Infrastruct Dev 2012; 4(2): 59–76. [Google Scholar]
- 37.Islam S, Nawaz R, Moazzam M. A survey of Smooth-coated Otter (Lutrogale perspicillata sindica) and Fishing Cat (Prionailurus viverrinus) in Chotiari Reservoir, Sanghar, Pakistan, using camera traps. Int J Biol Biotech 2015; 12(4): 579–584. [Google Scholar]
- 38.Chavez PS., Jr.An improved dark-object subtraction technique for atmospheric scattering correction of multispectral data. Remote Sens Environ 1988; 24(3): 459–479. [Google Scholar]
- 39.Teodoro A, Amaral A. A statistical and spatial analysis of Portuguese forest fires in summer 2016 considering Landsat 8 and Sentinel 2A data. Environments 2019; 6(3): 36. [Google Scholar]
- 40.Huete A. A soil-adjusted vegetation index (SAVI). Remote Sens Environ 1988; 25(3): 295–309. [Google Scholar]
- 41.Huete A, Post D, Jackson R. Soil spectral effects on 4-space vegetation discrimination. Remote Sens Environ 1984; 15(2): 155–165. [Google Scholar]
- 42.Gilabert M, González-Piqueras J, Garcıa-Haro FJ, et al. A generalized soil-adjusted vegetation index. Remote Sens Environ 2002; 82(2–3): 303–310. [Google Scholar]
- 43.Abbasi HU, Baluch MA, Soomro AS. Impact assessment on Mancher lake of water scarcity through remote sensing based study. In: Proceeding of GIS, Saudi Arabia. [Google Scholar]
- 44.Mastoi GM, Shah SG, Khuhawar MY. Assessment of water quality of Manchar Lake in Sindh (Pakistan). 2008; 141(1–3): 287–296. [DOI] [PubMed] [Google Scholar]
- 45.Husien S, Labena A, El-Belely E, et al. Application of Nostoc sp. for hexavalent chromium [Cr (VI)] removal: planktonic and biofilm. Int J Environ Anal Chem. Epub ahead of print 5June2020. DOI: 10.1080/03067319.2020.1773454. [DOI] [Google Scholar]
- 46.Badawi AK, Zaher K. Hybrid treatment system for real textile wastewater remediation based on coagulation/flocculation, adsorption and filtration processes: performance and economic evaluation. J Water Process Eng 2021; 40: 101963. [Google Scholar]
- 47.Badawi AK, Bakhoum ES, Zaher K. Sustainable evaluation of using nano zero-valent iron and activated carbon for real textile effluent remediation. Arab J Sci Eng. Epub ahead of print 29January2021. DOI: 10.1007/s13369-021-05349-5. [DOI] [Google Scholar]
- 48.Shalaby A, Tateishi R. Remote sensing and GIS for mapping and monitoring land cover and land-use changes in the Northwestern coastal zone of Egypt. Appl Geogr 2007; 27(1): 28–41. [Google Scholar]
- 49.Pettorelli N, Laurance WF, O’Brien TG, et al. Satellite remote sensing for applied ecologists: opportunities and challenges. J Appl Ecol 2014; 51(4): 839–848. [Google Scholar]
- 50.Kazi TG, Arain MB, Jamali MK, et al. Assessment of water quality of polluted lake using multivariate statistical techniques: a case study. Ecotoxicol Environ Saf 2009; 72(2): 301–309. [DOI] [PubMed] [Google Scholar]
- 51.Siyal AA, Bhatti AM, Babar MM, et al. Environmental impact of conversion of natural wetland into reservoir: a case study of Chotiari Reservoir in Pakistan. Reston, VA: American Society of Civil Engineers, 2019. [Google Scholar]


