

Abstract
Awareness is one of the first steps in a lifestyle modification process. Since older adults are at a higher risk of hypertension, maintaining low sodium intake is of utmost importance. Yet, it is uncertain if older adults have an awareness of their sodium intake. This study aimed to explore self-perceived sodium intake among older Chinese people and compare it with various measures of sodium intake. A cross-sectional study was conducted in Hong Kong in 2015. Data were collected from 24-h urinary sodium excretion (UNa24) measurements, dietary sodium intake by 24-h diet recalls and self-perceived salt intake levels among the older Hong Kong population. Kappa statistics and a paired t-test were used to compare the different measures. Fifty-nine participants provided complete 24-h urine samples. The mean (±SD) UNa24 of participants was 2846 ± 1253 mg, of which 74.6% exceeded the recommended daily sodium intake. About 87.8% of participants with UNa24 values >2000 mg perceived their sodium intake as too little or just right. The kappa statistic between UNa24 and self-perception was insignificantly different from zero (κ = −0.003, p-value = 0.909). The UNa24 estimates were significantly higher than those estimated from the 24-h diet recalls by 1203 mg (p-value <0.001). The findings imply that the low awareness of excessive sodium intake should be raised among older people to promote a healthy intake of sodium.
Keywords: Sodium, salt, urinary sodium excretion, diet, self-perceived, hypertension
Introduction
Reducing sodium intake effectively controls hypertension.1,2 The World Health Organization (WHO) recommends a daily sodium intake of less than 2000 mg. 3 In Hong Kong, sodium intake in the general population has been found to exceed the recommended level.4–6 Therefore, reducing salt intake is a high-priority goal in the effort to halt the increasing trend of hypertension. Various forms of intervention, such as nutrition education programs and public education campaigns, have been developed to help people reduce their sodium intake. 7 According to the Stages of Change Model, 8 those who have no intention of taking action belong to the stage of precontemplation. To promote behavioural change for people at this stage, increasing their awareness of the need for change is important.
Awareness is one of the first steps in a lifestyle modification process. If people with high sodium intake perceive themselves as having a normal or even low sodium intake, they will not realise the need to reduce the amount of sodium they consume. Therefore, a person’s self-perceived level of sodium intake could affect one’s motivation to reduce sodium intake. However, people with a high sodium intake often do not recognise that their intake is high. In a study in China, participants aged 18–69 reported themselves as having low sodium intake, even though their urinary sodium excretion was exceeding 9 g per day. 9 In a US study, sodium intake estimated from the 24-h diet recall also underestimated the actual sodium intake estimated from urinary sodium excretion. 10
Since older adults are at a higher risk of hypertension, maintaining low sodium intake is of utmost importance. Yet, it is uncertain if older adults have an awareness of their sodium intake. The objectives of this study were to explore self-perception of sodium intake of Chinese older adults and compare it with laboratory measures.
Methods
Study design
A cross-sectional observational study was conducted in Hong Kong during June through August of 2015. Ethics approval was granted by the Institutional Review Board.
Participants
The target population consisted of older Chinese people in Hong Kong. Inclusion criteria included older Chinese aged ≥65 years without communication problems. Exclusion criteria included those with renal illness who were taking diuretics, as their urinary sodium excretion might differ from normal.
The sample size calculation was based on detecting a moderate agreement between two measurements based on a kappa statistic of 0.4. 11 According to the guidelines of a sample size requirement, 12 a minimal sample size of 62 was required to detect such a value with 90% statistical power and 5% level of significance. It was reported that 10% of the participants were unable to provide both a urine sample and food diary 6 ; hence, it was required that 70 participants should be recruited to accommodate the missing information.
Sodium intake measurements
24-h urinary sodium excretion measurement
The 24-h urinary sodium excretion (UNa24) measurement is regarded as the gold standard for measuring dietary sodium intake. 13 Trained research assistants instructed participants how to store urine voids for 24 h according to the standard procedure used in clinical practice. The first morning void on the collection day was discarded, and all urine voids in the subsequent 24 h were stored in a 3-L bottle. At the end of the 24-h period, the last void was made. Each participant was asked to urinate in the jug provided and then pour the urine into the given 3-L bottle. Participants were asked to place the urine collection bottle in a cool place and return it to the research team within the day of the last void. The participants recorded any missing voids. The 24-h collection was considered to be complete if the total urine volume was >500 mL, the reported collection period was >20 h and a ≤1 missed void was reported. 10 The urine volume and urinary sodium excretion were estimated by an accredited laboratory.
Dietary sodium intake based on a 24-h diet recall
Participants had a 24-h diet recall when returning the urine sample. To minimise recall bias, participants recorded their diets and any discretionary salt and condiments. During the recall interview, pictures of food portions aided the recall of the amount of food consumed. Sodium intake was estimated using the online Food Nutrient Calculator of the Centre for Food Safety of Hong Kong. 14
Self-perception
A participant’s self-perceived salt intake level was assessed by single question: ‘What do you think of your salt intake?’ 9 Participants could choose one of four responses: ‘too little’, ‘just right’, ‘too much’ and ‘I don’t know/not sure’.
Procedure
A convenience sample was recruited from two senior community centres in Hong Kong. Trained research assistants explained the study to potential participants and screened them for eligibility. After obtaining written informed consent, the research team taught the participants how to collect 24-h urine samples and record their diets. On a designated date, the participants returned the collected urine samples, which were sent to a certified laboratory on the same day. The research assistant also assisted the participants in completing the 24-h diet recall, in which they answered the question on self-perceived sodium intake level and provided demographic information. Upon completion, each participant received a HK$50 supermarket coupon.
During June through August of 2015, 75 potential older Chinese participants from two senior community centres in Hong Kong were screened. Among 72 eligible participants, 2 withdrew because they perceived they could not comply to the protocols. A further six participants dropped out by not returning the urine sample. Among the 64 participants who returned the urine sample, 5 had incomplete urine collections. Thus, 59 participants with complete 24-h urine collection samples were included in the analysis (Figure 1).
Figure 1.
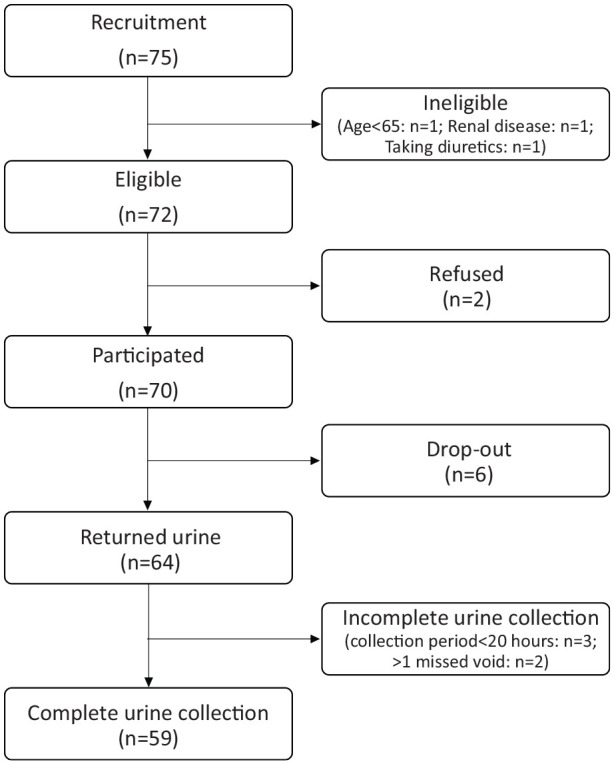
Recruitment of participants.
Statistical analysis
UNa24 results were dichotomised into a ‘high sodium intake group’ (UNa24 >2000 mg/day) and a ‘regular sodium intake group’ (≤2000 mg/day), according to the recommended sodium intake. 3 Kappa statistics and the Pearson’s correlation coefficient were used to examine associations across different measures. A paired t-test was used to test the difference between estimated sodium intake based on UNa24 and a 24-h diet recall. SPSS version 23 was used. A significance level of 5% was adopted.
Results
Fifty-nine participants were included in the data analysis. The majority were women (83.1%), and the mean age was 76.6 ± 6.8 years (Table 1). Most (>70%) had a primary education level or no formal education, and >60% had received a diagnosis of hypertension from a medical doctor.
Table 1.
Characteristics of participants with complete 24-h urine collection samples (n = 59).
| Characteristic | Count (%) | Mean | SD |
|---|---|---|---|
| Age (years), mean ± SD | 76.6 | 6.8 | |
| Sex | |||
| Male | 10 (16.9) | ||
| Female | 49 (83.1) | ||
| Education level | |||
| Primary or below | 42 (71.2) | ||
| Secondary or above | 17 (28.8) | ||
| Occupation | |||
| Retired | 50 (84.7) | ||
| Home-maker | 8 (13.6) | ||
| Full-time employment | 1 (1.7) | ||
| Previous diagnosis of hypertension by medical doctor | |||
| Yes | 36 (61.0) | ||
| No | 23 (39.0) | ||
| 24-h urinary sodium excretion (in mg) | 2846 | 1253 | |
| Estimated sodium intake based on 24-h diet recall (in mg) | 1643 | 1044 | |
SD: standard deviation.
Among the 59 participants, 16.9% perceived their sodium intake as being ‘too little’, 66.1% as ‘just right’, 12.0% as ‘too much’ and 5.1% were not sure about their salt intake level. The mean UNa24 was 2846 ± 1253 mg/day, and 44 (74.6%) participants had values >2000 mg/day. Table 2 shows that 87.8% of participants with UNa24 values >2000 mg perceived their sodium intake as too little or just right. Three participants who reported ‘don’t know/not sure’ in the high sodium intake group were excluded in the calculation of kappa statistics. The kappa statistic between the sodium intake level based on UNa24 and self-perception was insignificantly different from zero (κ = −0.003, p-value = 0.909).
Table 2.
Self-perceived salt intake level and sodium intake level based on 24-h urinary sodium excretion (n = 59).
| Self-perceived saltintake level | Regular sodiumintake a (%) | High sodium intake b (%) | Total (%) |
|---|---|---|---|
| Too little/just right | 13 (86.7) | 36 (87.8) | 49 (87.5) |
| Too much | 2 (13.3) | 5 (12.2) | 7 (12.5) |
| Total c | 15 (100) | 41 (100) | 56 (100) |
24-h urinary sodium excretion ≤2000 mg per day.
24-h urinary sodium excretion >2000 mg per day.
Three participants who reported ‘don’t know/not sure’ in the high sodium intake group were excluded; Kappa statistic = −0.003 (p-value = 0.909).
The mean estimated sodium intake based on the 24-h diet recall was 1643 ± 1044 mg/day. The key sources of sodium intake included discretionary salt added during cooking, fried rice/noodles, rice vermicelli/noodles in soup and Dim Sum. The estimated sodium intake based on UNa24 was 1203 mg/day more than that from the 24-h diet recall (p-value <0.001). Moreover, the Pearson’s correlation coefficient between estimated sodium intake based on the 24-h diet recall and UNa24 was insignificantly different from zero (r = 0.086, p-value = 0.516).
Discussion
Our findings showed a systematic bias towards underestimation of sodium intake among older Chinese adults in Hong Kong, which was consistent with those from previous studies.9,15 Incomplete measurements of UNa24 are not uncommon due to subject compliance and logistic issues. 16 Other outcome measures to be considered for the older population include estimating UNa24 from a single void or using spot urine. 16 The low accuracy of the 24-h diet recall in sodium intake estimation could be due to reporting bias, social desirability and social approval bias. 17 Moreover, actual sodium amounts contained in the same food category can vary substantially. Our findings were consistent with previous studies about the underestimation of sodium intake as measured by urinary excretion 18 and the weak correlation between the estimated dietary sodium intake and the UNa24.6,10 Estimation accuracy could be improved by recording the food diary across multiple days, 19 at the expense of a lower-income respondent’s cooperation and poorer data quality. The low education level of the older population should be taken into consideration in the data collection process.
Despite the underestimation of sodium intake by various measures, such estimates were still far above the recommended level of daily intake. Yet, most of the participants still perceived their intake as too little or just right. Older people with hypertension were willing to switch to a low sodium diet given that they learned about the potential health benefits. 20 The first step in getting older individuals to follow low sodium diets is to encourage individuals to realise their high sodium intake. Therefore, it is important to develop simpler methods for collecting information on biomarkers to provide objective and reliable measures of sodium intake.
The strength of this study was the use of the gold standard UNa24 to estimate daily sodium intake. Furthermore, the low education level of the majority of the study population increases the applicability of this study into populations in low- and middle-income countries where large portions of the population have low education levels. There were some limitations in our study. First, our study employed a small sample size, which may lower its statistical power. Second, a large proportion of data were lost due to attrition or incomplete collection of the 24-h urine samples. The results could be biased in that only more knowledgeable participants were included in the analysis. However, if the more knowledgeable participants showed poor agreement between self-perceived sodium intake and objective measurement, those less knowledgeable might have demonstrated even larger discrepancies.
Conclusion
To promote a healthy intake of sodium, an awareness of excessive sodium intake should be raised among the older population. However, objective measures like UNa24 are not user-friendly to older people. Simpler methods of collecting objective and reliable biomarkers of sodium intake are critical for the reduction of sodium intake in the older population.
Acknowledgments
The authors wish to thank our participants for their support and colleagues at the elderly community centres for their assistance during data collection. We would also like to thank the Food and Environmental Hygiene Department of Hong Kong for granting permission to use their photo booklet of the Food Consumption Survey to assist in the dietary recall.
Author biographies
Pui-Hing Chau is currently an Associate Professor in the School of Nursing, The University of Hong Kong. She is also an Honorary Research Fellow at Sau Po Centre on Ageing and a Fellow at HKJC Centre for Suicide Research and Prevention of The University of Hong Kong.
Dr Kris Yuet-Wan Lok is an Assistant Professor in the School of Nursing of The University of Hong Kong. She is a registered dietitian who has worked in academic institutions and hospitals both in Hong Kong and the United Kingdom.
Angela Yee-Man Leung is an Associate Professor in the School of Nursing of the Hong Kong Polytechnic University. She is a registered nurse. She is the Deputy Director of WHO Collaborating Centre for Community Health Services and the Director of Centre for Gerontological Nursing at the Hong Kong Polytechnic University.
Sze Chow participated in this study when she served as Assistant Professor (Practice) in the School of Nursing of The University of Hong Kong. She is a registered nurse with ample practice experience with the older population.
Ms Wing-Tung Lo participated in this study when she served as the Research Assistant in the School of Nursing of The University of Hong Kong.
Siu-Fan Li participated in this study when she served in The Salvation Army.
Alice Ka-Lai Fu participated in this study when she served in the Aberdeen Kai-fong Welfare Association Social Service.
Bernard Man-Yung Cheung is the Sun Chieh Yeh Heart Foundation Professor in Cardiovascular Therapeutics and heads the Division of Clinical Pharmacology and Therapeutics in the Department of Medicine of the University of Hong Kong. He is also the Director of the Institute of Cardiovascular Science and Medicine, and the Medical Director of the Phase 1 Clinical Trials Centre.
Footnotes
The author(s) declared no potential conflicts of interest with respect to the research, authorship, and/or publication of this article.
Funding: The author(s) disclosed receipt of the following financial support for the research, authorship, and/or publication of this article: This work was supported by the Small Project Funding (no. 201409176162) of The University of Hong Kong.
Ethics approval: Ethical approval for this study was obtained from Institutional Review Board of the University of Hong Kong/Hospital Authority Hong Kong West Cluster (UW 15-202).
Informed consent: Written informed consent was obtained from all subjects or their legally authorised representatives before the study.
ORCID iD: Pui-Hing Chau  https://orcid.org/0000-0003-0287-8020
References
- 1.He FJ, MacGregor GA.Reducing population salt intake worldwide: from evidence to implementation. Prog Cardiovasc Dis 2010; 52(5): 363–382. [DOI] [PubMed] [Google Scholar]
- 2.Strazzullo P, D’Elia L, Cairella G, et al. Recommending salt intake reduction to the hypertensive patient. High Blood Press Cardiovasc Prev 2012; 19(2): 59–64. [DOI] [PubMed] [Google Scholar]
- 3.World Health Organization. Guideline: sodium intake for adults and children. Geneva: World Health Organization, 2012. [PubMed] [Google Scholar]
- 4.Woo J, Leung S, Ho S, et al. Dietary intake and practices in the Hong Kong Chinese population. J Epidemiol Community Health 1998; 52(10): 631–637. [DOI] [PMC free article] [PubMed] [Google Scholar]
- 5.Study on Sodium Content in Local Foods [Internet]. Nutrition. Centre for Food Safety, https://www.cfs.gov.hk/english/programme/programme_rafs/programme_rafs_n_01_14.html (2012, accessed 17 December 2020).
- 6.Liu Z, Ho SC, Tang N, et al. Urinary sodium excretion and dietary sources of sodium intake in Chinese postmenopausal women with prehypertension. PLoS One 2014; 9(8): e104018. [DOI] [PMC free article] [PubMed] [Google Scholar]
- 7.Christoforou A, Trieu K, Land MA, et al. State-level and community-level salt reduction initiatives: a systematic review of global programmes and their impact. J Epidemiol Community Health. 2016; 70(11): 1140–1150. [DOI] [PubMed] [Google Scholar]
- 8.Prochaska JO, DiClemente CC.Stages and processes of self-change of smoking: toward an integrative model of change. J Consult Clin Psychol 1983; 51(3): 390. [DOI] [PubMed] [Google Scholar]
- 9.Zhang J, Guo XL, Seo DC, et al. Inaccuracy of self-reported low sodium diet among Chinese: findings from baseline survey for Shandong & Ministry of Health Action on Salt and Hypertension (SMASH) project. Biomed Environ Sci 2015; 28(2): 161–167. [DOI] [PubMed] [Google Scholar]
- 10.Mercado CI, Cogswell ME, Valderrama AL, et al. Difference between 24-h diet recall and urine excretion for assessing population sodium and potassium intake in adults aged 18–39 y. Am J Clin Nutr 2015; 101(2): 376–386. [DOI] [PMC free article] [PubMed] [Google Scholar]
- 11.Cohen J.A coefficient of agreement for nominal scales. Educ Psychol Meas 1960; 20: 37–46. [Google Scholar]
- 12.Bujang M.Guidelines of the minimum sample size requirements for Cohen’s Kappa. Epidemiol Biostat Public Health 2017; 14: e12267-1. [Google Scholar]
- 13.Day NE, McKeown N, Wong MY, et al. Epidemiological assessment of diet: a comparison of a 7-day diary with a food frequency questionnaire using urinary markers of nitrogen, potassium and sodium. Int J Epidemiol 2001; 30(2): 309–317. [DOI] [PubMed] [Google Scholar]
- 14.Food Nutrient Calculator [Internet]. Nutrient information inquiry. Centre for Food Safety, http://www.cfs.gov.hk/english/nutrient/fc-introduction.php (2017, accessed 17 December 2020).
- 15.Gerber LM, Mann SJ.Inaccuracy of self-reported low sodium diet. Am J Hum Biol 2012; 24(2): 189–191. [DOI] [PubMed] [Google Scholar]
- 16.McLean RM.Measuring population sodium intake: a review of methods. Nutrients 2014; 6(11): 4651–44662. [DOI] [PMC free article] [PubMed] [Google Scholar]
- 17.Hebert JR, Ma Y, Clemow L, et al. Gender differences in social desirability and social approval bias in dietary self-report. Am J Epidemiol 1997; 146(12): 1046–1055. [DOI] [PubMed] [Google Scholar]
- 18.Espeland MA, Kumanyika S, Wilson AC, et al. Statistical issues in analyzing 24-hour dietary recall and 24-hour urine collection data for sodium and potassium intakes. Am J Epidemiol 2001; 153(10): 996–1006. [DOI] [PubMed] [Google Scholar]
- 19.Bentley B.A review of methods to measure dietary sodium intake. J Cardiovasc Nurs 2006; 21(1): 63–67. [DOI] [PubMed] [Google Scholar]
- 20.Chau P, Ngai H, Leung A, et al. Preference of food saltiness and willingness to consume low-sodium content food in a Chinese population. J Nutr Health Aging 2017; 21(1): 3–10. [DOI] [PubMed] [Google Scholar]