

Abstract
Gastric adenocarcinoma is the most common histologic type of gastric cancer; however, the pathogenic mechanisms remain unclear. To improve mechanistic understanding and identify new treatment targets or diagnostic biomarkers, we used bioinformatic tools to predict the hub genes related to the process of gastric adenocarcinoma development from public datasets, and explored their prognostic significance. We screened differentially expressed genes between gastric adenocarcinoma and normal gastric tissues in Gene Expression Omnibus datasets (GSE79973, GSE118916, and GSE29998) using the GEO2R tool, and their functions were annotated with Gene Ontology and Kyoto Encyclopedia of Genes and Genomes signaling pathway enrichment analyses in the DAVID database. Hub genes were identified based on the protein-protein network constructed in the STRING database with Cytoscape software. A total of 10 hub genes were selected for further analysis, and their expression patterns in gastric adenocarcinoma patients were investigated using the Oncomine GEPIA database. The expression levels of ATP4A, CA9, FGA, ALDH1A1, and GHRL were reduced, whereas those of TIMP1, SPP1, CXCL8, THY1, and COL1A1 were increased in gastric adenocarcinoma. The Kaplan–Meier online plotter tool showed associations of all hub genes except for CA9 with prognosis in gastric adenocarcinoma patients; CXCL8 and ALDH1A1 were positively correlated with survival, and the other genes were negatively correlated with survival. These 10 hub genes may be involved in important processes in gastric adenocarcinoma development, providing new directions for research to clarify the role of these genes and offer insight for improved treatment.
Keywords: Gastric adenocarcinoma, survival analysis, hub genes, prognostic values, gene expression
Introduction
Gastric cancer is currently one of the most common malignant tumors worldwide, and the prognosis remains poor; the 5-year survival rate of gastric cancer patients in China is still below 40%. 1 Gastric cancer-related genes involved in the process of tumor development have been identified, which define the histological type of tumors. Gastric cancer is histologically classified as adenocarcinoma, adenosquamous carcinoma, squamous cell carcinoma, undifferentiated carcinoma, and carcinoid tumor. Gastric adenocarcinoma is the most common histological type of gastric cancer, accounting for 95% of all cases, and its morbidity and mortality are high. 2 Most patients with gastric adenocarcinoma are diagnosed when the cancer is at an intermediate or advanced stage of development, with high rates of recurrence and metastasis after surgery. 3 Although chemotherapy can help some patients improve their quality of life and prolong survival time, the effect remains limited, which is mainly due to delayed diagnosis and treatment. Despite research to uncover the molecular mechanism of gastric adenocarcinoma, specific genes that are responsible for gastric adenocarcinoma development have not been identified. Therefore, further work is needed to elucidate the potential mechanism in the occurrence and development of gastric adenocarcinoma, identify biomarkers of prognosis, and provide new targets and research directions to improve diagnosis and treatment.
Microarray technology and bioinformatic techniques are commonly used to screen genetic variants at the genomic level. However, false-positive results may be obtained in independent microarray analyses. Hub genes are defined as genes that play crucial roles in biological processes, and also influence the regulation of other genes in related pathways. Therefore, hub genes can represent important research targets to guide the precise treatment of cancer and the application of drugs.4,5
The Gene Expression Omnibus (GEO) database offers a rich genetic data resource, which has been widely used for analyses of lung cancer, ovarian cancer, breast cancer, and other cancer types.6–8 Therefore, in this study, we screened datasets derived from multiple gastric adenocarcinoma gene chips in the GEO database for differentially expressed genes, searched for hub genes among the candidates, and explored their expression distribution and prognostic significance. These results can provide a theoretical basis for the discovery of possible prognostic markers toward improving the clinical diagnosis and treatment of gastric adenocarcinoma.
Materials and methods
Datasets
The entire GEO database, including 488 series of human gastric cancer, was screened for relevant datasets based on the following criteria: (1) data based on expression profiling by microarray, (2) gastric cancer-related project, (3) analysis of gastric adenocarcinoma tissue and normal gastric tissue, and (4) at least two samples analyzed. After careful screening, three datasets (GSE79973, GSE118916, and GSE29998) were selected. GSE79973 was based on GPL570 ([HG-U133Plus2] Affymetrix Human Genome U133 Plus 2.0 Array), GSE118916 was based on GPL15207 ([PrimeView] Affymetrix Human Gene Expression Array), and GSE29998 was based on GPL6947 (Illumina HumanHT-12 V3.0 beadchip expression).9–11
Screening of differentially expressed genes
The GEO2R analysis tool was used to screen the differentially expressed genes between gastric adenocarcinoma tissues and normal tissues in the three databases. GEO2R uses the GEOquery and limma R packages of the Bioconductor project (an analytical tool for high-throughput genomic data) to compare the processed data sheets provided by the original submitter. Specifically, the GEOquery R package parses GEO data into R-compatible data structures that can be used by other R packages. The limma R package can handle a wide range of experimental designs and data types, and performs multiple testing corrections on p-values to help correct for the occurrence of false positives.12–14 Genes with differences in expression levels between tissue types at adjusted p-value <0.05 and |log fold-change (FC)| >1.5 were considered as differentially expressed genes. Statistical analysis was performed on each dataset and the Venn diagram online tool was used to identify intersecting parts.
Gene Ontology (GO) and Kyoto Encyclopedia of Genes and Genomes (KEGG) pathway enrichment analysis of differentially expressed genes
To reveal the biological function of the differentially expressed genes in gastric adenocarcinoma, enrichment analysis was performed with GO and KEGG pathway analyses. GO analysis is mainly used for functional enrichment based on biological process, molecular function, and cellular component catogories. 15 KEGG is a database that integrates genomic, chemical, and systems functional information to identify biological pathways associated with genes of interest. 16 The DAVID tool was used for GO and KEGG pathway enrichment analyses of differentially expressed genes.17,18 GO enrichment terms with p value <0.05 and gene count ≥10 were further analyzed. We also screened the KEGG analysis results according to p-value <0.05; the p values were ranked from small to large, and the top 10 most significant pathways were further analyzed and plotted as a bubble diagram.
Protein-protein interaction (PPI) network construction and selection of hug genes
The STRING database was used to explore PPIs among the differentially expressed genes in gastric adenocarcinoma according to a confidence level of <0.04, 19 and Cytoscape was used to visualize interactive networks. 20
The nodes with a higher degree of connection in the PPI network are more essential for maintaining the stability of the whole network, and are therefore considered to be more relevant to the biological process as a whole. Radiality method is a topological analysis method based on the path, which plays an important role in the prediction of key nodes.21 The top 10 genes in the network were screened as hub genes using the radiality method with the CytoHubba plugin in Cytoscape software.
Oncomine analysis
Oncomine is a database for the analysis of large tumor gene chip datasets, which integrates the data of several public databases, including GEO, The Cancer Genome Atlas (TCGA), and others. The Oncomine database currently contains 715 gene expression datasets with related information from 86,733 human tumor tissues and normal tissue samples, and is continuously updated. In this study, Oncomine was used to retrieve information on the expression of candidate hub genes to verify their expression patterns in gastric cancer under the following screening thresholds: p-value <1E-4, fold change >2, gene rank = top 10%.
Expression of candidate genes in gastric adenocarcinoma
Differences in expression levels of hub genes in normal gastric tissues and gastric adenocarcinoma tissues were further confirmed with gene expression profiling interactive analysis (GEPIA) based on the TCGA and GTEx datasets, 22 including data on 9736 tumors and 8587 normal samples.
Survival analysis
The Kaplan–Meier plotter can be used to assess the impact of 54,000 genes on survival in 21 cancer types. We used the breast cancer (n = 6234), ovarian cancer (n = 2190), lung cancer (n = 3452), and gastric cancer (n = 1440) datasets 23 to evaluate the prognostic value of the hub genes in the gastric adenocarcinoma network. p < 0.05 was considered to indicate a statistically significant association with prognosis (overall survival).
Results
Screening of differentially expressed genes
Screening of the three GEO datasets (GSE79973, GSE118916, and GSE29998; Table 1) identified a total of 922 up-regulated genes and 1442 down-regulated genes in gastric adenocarcinoma compared to normal gastric tissues (Table 2). Venn diagrams demonstrated an overlap of 171 common differentially expressed genes in the three datasets (Figure 1).
Table 1.
Gene expression profile information of data set.
Table 2.
The number of up-regulated and down-regulated genes in the gene expression profile dataset.
Figure 1.
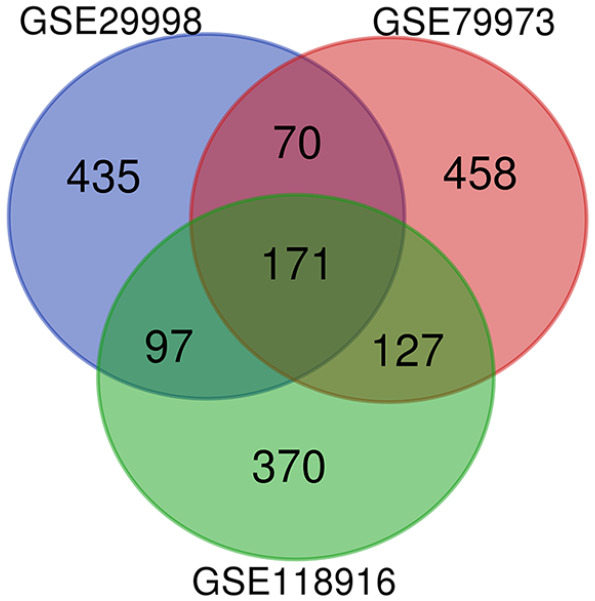
Differential gene Venn plots common to all three GEO datasets. Identification of DEGs in mRNA expression profiling datasets GSE29998, GSE79973, GSE118916.
The areas of overlap meant the commonly DEGs.
DEGs: differentially expressed genes.
GO and KEGG pathway enrichment analysis of differentially expressed genes
We analyzed 171 differentially expressed genes. The differentially expressed genes were significantly enriched in the GO cellular component terms extracellular exosome, extracellular space, extracellular region, endoplasmic reticulum lumen, cell surface, apical plasma membrane, and integral component of the plasma membrane; in the biological process terms digestion, extracellular matrix organization, oxidation-reduction process, cell adhesion, and proteolysis; and in the molecular function terms zinc ion binding and identical protein binding (Figure 2). The genes were most significantly enriched in the KEGG pathways protein digestion and absorption, metabolism of xenobiotics by cytochrome P450, and drug metabolism–cytochrome P450 (Figure 3).
Figure 2.

GO enrichment analysis. The results of GO enrichment analysis are shown in the figure.
Analysis with p-value < 0.05 and gene enrichment number greater than 10 will be selected.
BP: biological process; CC: cellular component; GO: gene ontology; MF: molecular function.
Figure 3.
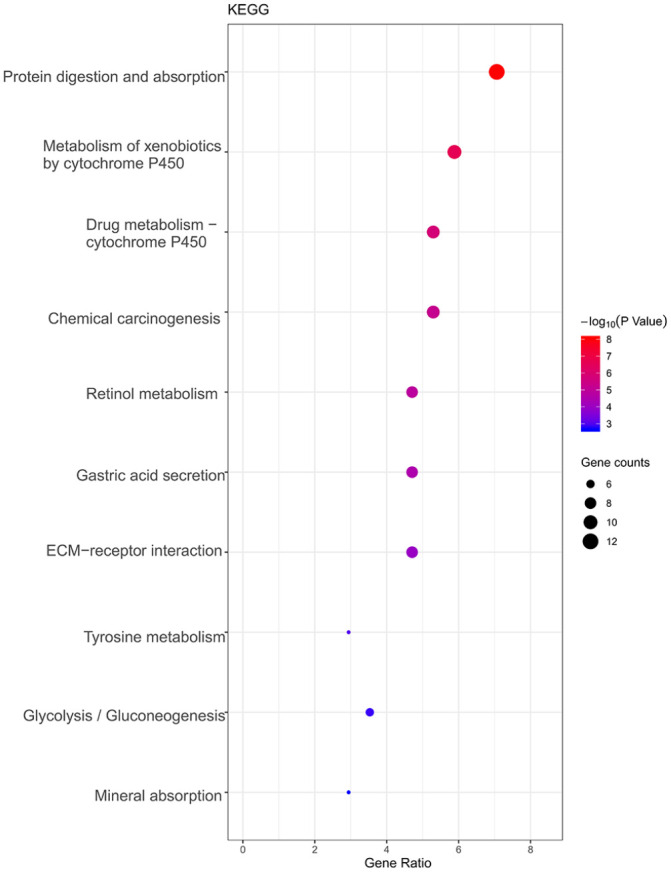
KEGG Enrichment Analysis. A bubble diagram showing the enrichment of KEGG.
Statistics of the first 10 enrichment results with p-value < 0.05. The color change in the legend represents the size of −log10 (p-value). The size of the circle represents the number of genes enriched in the corresponding pathway.
KEGG: Kyoto encyclopedia of genes and genomes.
PPI network and hub gene identification
The PPI network based on the common differentially expressed genes included 171 nodes and 246 edges (Figure 4). The top 10 significant genes (p < 1.0e-16) were identified with the radiality method as follows (in order): ATP4A, TIMP1, SPP1, CXCL8, THY1, CA9, FGA, ALDH1A1, GHRL, and COL1A1 (Figure 5). Table 3 shows the specific scores of the hub genes in the network.
Figure 4.

PPI network of differential genes. The interaction between up-regulated and down-regulated gene protein networks is shown in the figure.
Red nodes stand for up-regulated genes, while green nodes stand for down-regulated genes.
DEGs: differentially expressed genes; PPI: protein–protein interaction.
Figure 5.
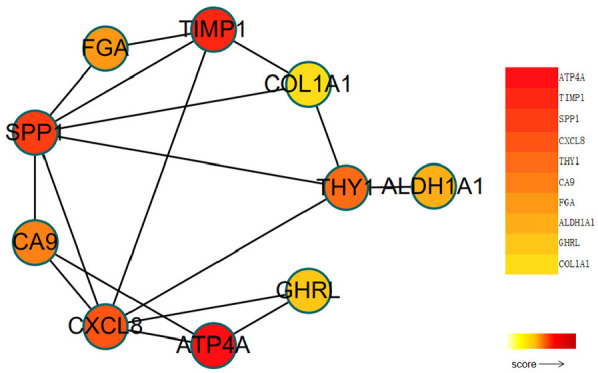
Ten hub genes based on radiality. The top 10 hub genes obtained based on the radiality algorithm using Cytoscape software.
The degree of color from yellow to red indicates the degree of importance of hub genes.
Table 3.
Hub gene sequencing.
| Rank | Name | Score |
|---|---|---|
| 1 | ATP4A | 10.1185 |
| 2 | TIMP1 | 10.1098 |
| 3 | SPP1 | 10.1012 |
| 4 | CXCL8 | 10.0930 |
| 5 | THY1 | 10.0495 |
| 6 | CA9 | 9.92007 |
| 7 | FGA | 9.89419 |
| 8 | ALDH1A1 | 9.88557 |
| 9 | GHRL | 9.85969 |
| 10 | COL1A1 | 9.85106 |
Oncomine analysis
A search of the Oncomine database for mRNA expression levels of the 10 hub genes in different cancer types revealed that ATP4A, CA9, FGA, ALDH1A1, and GHRL are consistently expressed at low levels in gastric cancer, and TIMP1, SPP1, CXCL8, THY1, and COL1A1 are expressed at higher levels in gastric cancer (Figure 6). We found that these 10 genes also had significant high or low expression in other cancer tissues.
Figure 6.

Expression levels of 10 hub genes in different cancers: (a) ATP4A, (b) FGA, (c) GHRL, (d) ALDH1A1, (e) CA9, (f) TIMP1, (g) SPP1, (h) CXCL8, (i) THY1, and (j) COL1A1.
Red indicates high expression and blue indicates low expression. The shade of color represents the degree of expression. The darker the red, the higher the expression. The darker the blue, the lower the expression.
GEPIA
The GEPIA results showed that ATP4A, CA9, FGA, ALDH1A1, and GHRL are expressed at lower levels in gastric adenocarcinoma tissues compared with normal gastric tissues, whereas the expression levels of TIMP1, SPP1, CXCL8, THY1, and COL1A1 are elevated in gastric adenocarcinoma. There was a significant difference in the expression levels of all hub genes between tissue types (p < 0.05; Figure 7).
Figure 7.

Expression of 10 hub genes in gastric cancer: (a) ATP4A, (b) FGA, (c) GHRL, (d) ALDH1A1, (e) CA9, (f) TIMP1, (g) SPP1, (h) CXCL8, (i) THY1, and (j) COL1A1.
GEPIA boxed plots of hub genes in human gastric tumor tissue and normal gastric tissue.
GEPIA: gene expression profiling interactive analysis.
*p < 0.05.
Survival analysis
Kaplan–Meier plotting results showed the effect of different genes on the prognosis of gastric cancer. We found that CXCL8 and ALDH1A1 were positively correlated with overall survival of gastric cancer patients, whereas the other hub genes (except for CA9) were positively correlated with survival (Figure 8).
Figure 8.
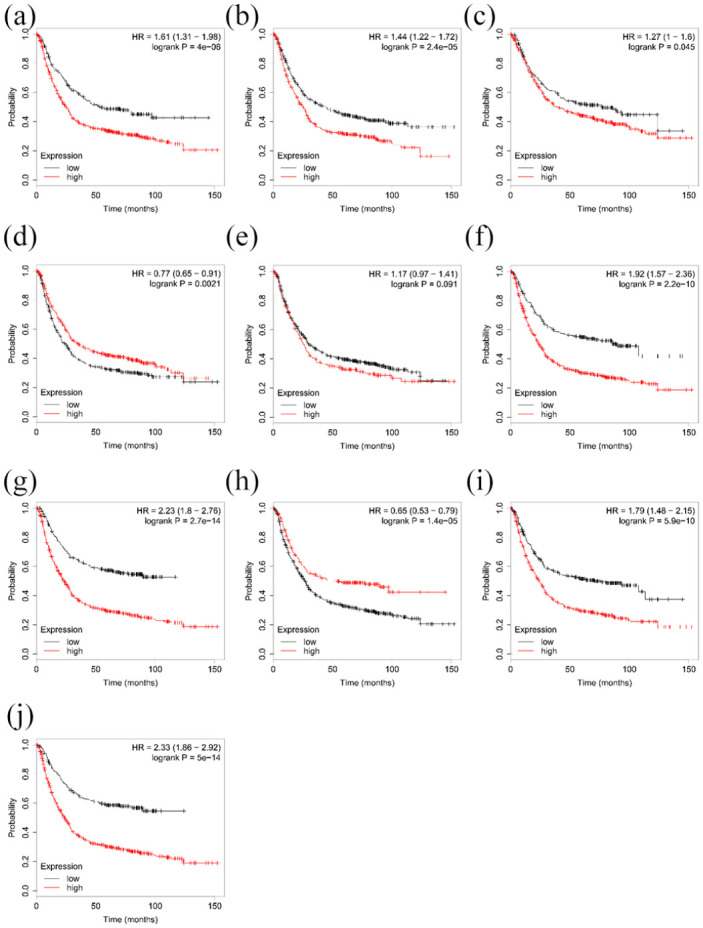
Survival analysis. Results: (a) ATP4A, (b) FGA, (c) GHRL, (d) ALDH1A1, (e) CA9, (f) TIMP1, (g) SPP1, (h) CXCL8, (i) THY1, and (j) COL1A1.
Prognostic value of hub genes in gastric cancer patients.
Log-rank test was performed to evaluate the survival differences between the two curves.
Discussion
Gastric cancer is a progressive disease characterized by accumulation and transformation involving multiple genes. 24 We identified 171 differentially expressed genes in gastric adenocarcinoma, which mainly play roles in digestion, extracellular body/extracellular space, and in protein digestion and absorption, exogenous substance metabolism-cytochrome P450, and drug metabolism-cytochrome P450 pathways. Cytochrome P450 can affect the metabolism of drugs and xenobiotics, and a variety of cytochrome P450 genes and proteins have been associated with the susceptibility of gastric cancer or the biological function of the stomach.25,26 Our results therefore offer new insight for exploring the development process and detailed mechanism of gastric adenocarcinoma.
Oncomine analysis and GEPIA showed that the 10 hub genes in the PPI network exhibit significant differences in expression levels between gastric cancer tissues and normal tissues, suggesting a crucial role in the development of gastric adenocarcinoma. Among the up-regulated genes, TIMP1 encodes a protein that is an inhibitor of matrix metalloproteinases (MMPs), which regulates cell differentiation, migration, and anti-apoptosis pathways. 27 TIMP1 could promote or inhibit the progression of colorectal cancer, 28 and showed some predictive value in the N3 stage of gastric cancer. 29 The SPP1-encoded protein is mainly involved in the attachment of osteoclasts to the mineralized bone matrix, affects cell matrix interactions, and is overexpressed in gastric cancer, influencing cancer progression. 30 CXCL8 is a major mediator of the inflammatory response and encodes a protein that acts as a chemokine. CXC chemokines and their receptors affect tumor development by regulating the transformation, invasion, and metastasis of gastric cancer, and can also regulate angiogenesis and the interaction between tumors and the microenvironment to affect tumorigenesis. 31 CXCL8 expression has been correlated with the prognosis of patients with cancer. 32 THY1 encodes cell surface glycoproteins and immunoglobulins, which affect cell adhesion and cell communication in the immune and nervous systems, and was also found to promote the growth of gastric cancer cells. 33 Collagen can provide growth attachment and a scaffold for cancer cells and induces the migration of cancer cells. COL1A1 belongs to the collagen family and encodes procollagen type I chains to participate in collagen formation.34,35 COL1A1 has also been reported to be overexpressed in various cancers such as liver cancer, cervical cancer, and gastric cancer.36–38
Among the down-regulated genes, ATP4A encodes a protein belonging to the P-type cation-transporting ATPase family, which is a gastric proton pump whose function is to maintain an acidic environment in the stomach, and DNA methylation of ATP4A is involved in the down-regulation of its expression in association with gastric cancer prognosis. 39 CA9 encodes a carbonic anhydrase involved in various biological processes such as acid-base balance and gastric acid formation. CA9 was proposed as a key differentiation factor in the stomach that can control cell proliferation and growth in the gastric mucosa, and is associated with infiltration of gastric cancer. 40 FGA encodes the α subunit of the coagulation factor fibrinogen and is involved in fibrinogen production. 41 Fibrinogen contributes to the adhesion of tumor cells to endothelial cells of target tissues and promotes the connection between tumor cells and host cells, thereby increasing tumor invasiveness. Fibrinogen may allow tumor cells and platelets to bind into aggregates, thus allowing tumor cells to evade attack by the immune system.42–44 Moreover, FGA was reported to be associated with liver cancer, pancreatic cancer, and gastric cancer.45–47ALDH1A1 encodes a protein of the aldehyde dehydrogenase family, which is an essential substance for the growth and differentiation of normal stem cells in tissues.48,49 ALDH1A1-overexpressing cancer cells showed higher invasion and metastatic activity to affect the prognosis of cancer. GHRL encodes ghrel in protein that induces growth hormone release from the pituitary gland and has effects of stimulating appetite, inducing obesity, and stimulating gastric acid secretion. The loss of ghrelin-producing cells is thought to be associated with atrophic gastritis, and ghrelin in serum may be a surrogate for mucosal function in upper gastrointestinal cancer, 50 although its specific role in gastric cancer progression is unknown.
Analysis of the Oncomine database showed that these 10 genes also had significantly high or low expression in other cancer tissues, such as lung cancer, liver cancer, and breast cancer. This suggests a common role of these genes in influencing the pattern and process of the development of different cancers, and the mechanism needs to be further explored.
Nine of the ten hub genes except for CA9 were associated with gastric cancer prognosis. In general, high expression levels of most genes in tumor samples are associated with poor prognosis. However, we found that the high expression of ALDH1A1 and CXCL8 in gastric cancer tissues was a favorable prognostic factor for patients, which can provide new insights into treatment and intervention strategies. Shen et al.51,52 also found a positive correlation between high expression of ALDH1A1 and the prognosis of gastric cancer patients. Yan et al. 53 and Qi et al. 54 also suggested that high expression of CXCL8 was positively correlated with the prognosis of gastric cancer patients. In addition, high expression of ALDH1A1 was identified as a positive prognostic factor for patients with hepatocellular carcinoma and primary glioblastoma.55,56 The regulatory mechanisms of various biological behaviors of tumor cells, and the interactions of various biomolecules may affect the ultimate clinical outcome of patients, especially the regulation of genes in the tumor microenvironment and the impact on the immune system. Such mechanisms might help to reveal how ALDH1A1 and CXCL8 improve the prognosis of gastric cancer patients, which requires further investigation. Extracellular matrix degradation is a key process in tumor invasion and metastasis, and MMPs are important enzymes that degrade the extracellular matrix and play a crucial role in mediating tumor angiogenesis, metastasis, and invasion. Although TIMP1 is an inhibitor of MMP, its expression was found to be negatively correlated with the prognosis of gastric cancer, and this gene was also reported to promote the occurrence of colorectal cancer; 57 however, its precise role in gastric adenocarcinoma is still unclear. Overall, our analysis and previous studies suggest that these 10 hub genes may be involved in and affect the progression of gastric adenocarcinoma.
The main limitation of the study is that the results were obtained from bioinformatic analysis of public databases with no corresponding experiments for confirmation. Moreover, we focused on only 10 hub genes that met our screening conditions, but other genes might also have significance in the occurrence and development of gastric adenocarcinoma. The detailed prognostic and therapeutic roles of these genes require further investigation in large clinical samples to confirm our hypothesis.
Conclusions
In summary, using comprehensive bioinformatic analysis, ATP4A, TIMP1, SPP1, CXCL8, THY1, CA9, FGA, ALDH1A1, ALDH1A1, GHRL, and COL1A1 were found to be significantly differentially expressed in gastric cancer tissues and may be involved in important processes related to the development of gastric adenocarcinoma. Except for the CA9 gene, the remaining nine genes have some value in predicting the prognosis of gastric adenocarcinoma patients. The CA9 gene may also play an important role in the progression of gastric adenocarcinoma, but has not been as widely reported. Although CXCL8 and ALDH1A1 can promote tumor invasiveness, they showed a positive association with prognosis in gastric adenocarcinoma patients. Similarly, TIMP1 has been shown to inhibit tumor invasiveness, but was associated with a poor prognosis in gastric adenocarcinoma patients. Based on our analysis, these 10 genes are likely to be important components in the development of gastric adenocarcinoma, which can offer new research directions to improve the early diagnosis of gastric adenocarcinoma, and in the development of targeted therapy and drugs.
Acknowledgments
The authors thank the members of the Department of General Surgery of The Affiliated Hospital of Qingdao University for sharing their data mining knowledge. We would like to thank Editage (www.editage.cn) for English language editing.
Author biographies
Hao Liu, Qingdao University, is a Graduate Student. He is mainly engaged in the relevant research on the mechanism of the occurrence and development of digestive tract tumors.
Yidan Qu, Qingdao University, is a Graduate Student. She is mainly engaged in bioinformatics related research.
Hao Zhou, Qingdao University, is a Graduate Student. He is mainly engaged in the relevant research on the mechanism of the occurrence and development of digestive tract tumors.
Ziwen Zheng, Qingdao University, is a Graduate Student. He is mainly engaged in the relevant research on the mechanism of the occurrence and development of digestive tract tumors.
Junjiang Zhao, Qingdao University, is a Graduate Student. He is mainly engaged in the relevant research on the mechanism of the occurrence and development of digestive tract tumors.
Jian Zhang, Affiliated Hospital of Qingdao University, is a Professor,. He is mainly engaged in the relevant research on the molecular mechanism of digestive tract tumors.
Footnotes
The author(s) declared no potential conflicts of interest with respect to the research, authorship, and/or publication of this article.
Funding: The author(s) disclosed receipt of the following financial support for the research, authorship, and/or publication of this article: This study was supported by the National Natural Science Foundation of China (No. 81770631)
ORCID iD: Hao Liu  https://orcid.org/0000-0002-3625-0437
References
- 1.Allemani C, Matsuda T, Di Carlo V, et al. Global surveillance of trends in cancer survival 2000-14 (CONCORD-3): analysis of individual records for 37 513 025 patients diagnosed with one of 18 cancers from 322 population-based registries in 71 countries. Lancet 2018; 391(10125): 1023–1075. [DOI] [PMC free article] [PubMed] [Google Scholar]
- 2.Ferlay J, Shin HR, Bray F, et al. Estimates of worldwide burden of cancer in 2008: GLOBOCAN 2008. Int J Cancer 2010; 127(12): 2893–2917. [DOI] [PubMed] [Google Scholar]
- 3.Asplund J, Kauppila JH, Mattsson F, et al. Survival trends in gastric adenocarcinoma: a population-based study in Sweden. Ann Surg Oncol 2018; 25(9): 2693–2702. [DOI] [PMC free article] [PubMed] [Google Scholar]
- 4.Li C, Zeng X, Yu H, et al. Identification of hub genes with diagnostic values in pancreatic cancer by bioinformatics analyses and supervised learning methods. World J Surg Oncol 2018; 16(1): 223. [DOI] [PMC free article] [PubMed] [Google Scholar]
- 5.Yang W, Zhao X, Han Y, et al. Identification of hub genes and therapeutic drugs in esophageal squamous cell carcinoma based on integrated bioinformatics strategy Cancer Cell Int 2019; 19: 142. [DOI] [PMC free article] [PubMed] [Google Scholar]
- 6.Song YJ, Tan J, Gao XH, et al. Integrated analysis reveals key genes with prognostic value in lung adenocarcinoma. Cancer Manag Res 2018; 10: 6097–6108. [DOI] [PMC free article] [PubMed] [Google Scholar]
- 7.Yang D, He Y, Wu B, et al. Integrated bioinformatics analysis for the screening of hub genes and therapeutic drugs in ovarian cancer. J Ovarian Res 2020; 13(1): 10. [DOI] [PMC free article] [PubMed] [Google Scholar]
- 8.Fu Y, Zhou QZ, Zhang XL, et al. Identification of hub genes using co-expression network analysis in breast cancer as a tool to predict different stages. Med Sci Monit 2019; 25: 8873–8890. [DOI] [PMC free article] [PubMed] [Google Scholar]
- 9.Jin Y, He J, Du J, et al. Overexpression of HS6ST2 is associated with poor prognosis in patients with gastric cancer. Oncol Lett 2017; 14(5): 6191–6197. [DOI] [PMC free article] [PubMed] [Google Scholar]
- 10.Li L, Zhu Z, Zhao Y, et al. FN1, SPARC, and SERPINE1 are highly expressed and significantly related to a poor prognosis of gastric adenocarcinoma revealed by microarray and bioinformatics. Sci Rep 2019; 9(1): 7827. [DOI] [PMC free article] [PubMed] [Google Scholar]
- 11.Holbrook JD, Parker JS, Gallagher KT, et al. Deep sequencing of gastric carcinoma reveals somatic mutations relevant to personalized medicine. J Transl Med 2011; 9: 119. [DOI] [PMC free article] [PubMed] [Google Scholar]
- 12.Smyth GK.Linear models and empirical bayes methods for assessing differential expression in microarray experiments. Stat Appl Genet Mol Biol 2004; 3: Article 3. [DOI] [PubMed] [Google Scholar]
- 13.Smyth GK. Limma: linear models for microarray data. In: Gentleman R, Carey V, Dudoit S, et al. (eds.), Bioinformatics and computational biology solutions using R and bioconductor. New York, NY: Springer, 2005, pp.397–420. [Google Scholar]
- 14.Davis S, Meltzer PS.GEOquery: a bridge between the gene expression omnibus (GEO) and BioConductor. Bioinformatics 2007; 23(14): 1846–1847. [DOI] [PubMed] [Google Scholar]
- 15.Ashburner M, Ball CA, Blake JA, et al. Gene ontology: tool for the unification of biology. The Gene Ontology Consortium. Nat Genet 2000; 25(1): 25–29. [DOI] [PMC free article] [PubMed] [Google Scholar]
- 16.Kanehisa M, Sato Y, Kawashima M, et al. KEGG as a reference resource for gene and protein annotation. Nucleic Acids Res 2016; 44(D1): D457–D462. [DOI] [PMC free article] [PubMed] [Google Scholar]
- 17.Huang da W, Sherman BT, Lempicki RA.Systematic and integrative analysis of large gene lists using DAVID bioinformatics resources. Nat Protoc 2009; 4(1): 44–57. [DOI] [PubMed] [Google Scholar]
- 18.Huang da W, Sherman BT, Lempicki RA.Bioinformatics enrichment tools: paths toward the comprehensive functional analysis of large gene lists. Nucleic Acids Res 2009; 37(1): 1–13. [DOI] [PMC free article] [PubMed] [Google Scholar]
- 19.Szklarczyk D, Gable AL, Lyon D, et al. STRING v11: protein-protein association networks with increased coverage, supporting functional discovery in genome-wide experimental datasets. Nucleic Acids Res 2019; 47(D1): D607–D613. [DOI] [PMC free article] [PubMed] [Google Scholar]
- 20.Smoot ME, Ono K, Ruscheinski J, et al. cytoscape 28: new features for data integration and network visualization. Bioinformatics 2011; 27(3): 431–432. [DOI] [PMC free article] [PubMed] [Google Scholar]
- 21.Chin CH, Chen SH, Wu HH, et al. CytoHubba: identifying hub objects and sub-networks from complex interactome. BMC Syst Biol 2014; 8 Suppl 4(Suppl 4): S11. [DOI] [PMC free article] [PubMed] [Google Scholar]
- 22.Tang Z, Li C, Kang B, et al. GEPIA: a web server for cancer and normal gene expression profiling and interactive analyses. Nucleic Acids Res 2017; 45(W1): W98–W102. [DOI] [PMC free article] [PubMed] [Google Scholar]
- 23.Szász AM, Lánczky A, Nagy Á, et al. Cross-validation of survival associated biomarkers in gastric cancer using transcriptomic data of 1,065 patients. Oncotarget 2016; 7(31): 49322–49333. [DOI] [PMC free article] [PubMed] [Google Scholar]
- 24.Molaei F, Forghanifard MM, Fahim Y, et al. Molecular signaling in tumorigenesis of gastric cancer. Iran Biomed J 2018; 22(4): 217–230. [DOI] [PMC free article] [PubMed] [Google Scholar]
- 25.Kandel SE, Lampe JN.Role of protein-protein interactions in cytochrome P450-mediated drug metabolism and toxicity. Chem Res Toxicol 2014; 27(9): 1474–1486. [DOI] [PMC free article] [PubMed] [Google Scholar]
- 26.Ghoshal U, Tripathi S, Kumar S, et al. Genetic polymorphism of cytochrome P450 (CYP) 1A1, CYP1A2, and CYP2E1 genes modulate susceptibility to gastric cancer in patients with Helicobacter pylori infection. Gastric Cancer 2014; 17(2): 226–234. [DOI] [PubMed] [Google Scholar]
- 27.Stilley JA, Sharpe-Timms KL.TIMP1 contributes to ovarian anomalies in both an MMP-dependent and -independent manner in a rat model. Biol Reprod 2012; 86(2): 47. [DOI] [PMC free article] [PubMed] [Google Scholar]
- 28.Song G, Xu S, Zhang H, et al. TIMP1 is a prognostic marker for the progression and metastasis of colon cancer through FAK-PI3K/AKT and MAPK pathway. J Exp Clin Cancer Res 2016; 35(1): 148. [DOI] [PMC free article] [PubMed] [Google Scholar]
- 29.Peduk S, Tatar C, Dincer M, et al. The role of serum CK18, TIMP1, and MMP-9 levels in predicting R0 resection in patients with gastric cancer. Dis Markers 2018; 2018: 5604702. [DOI] [PMC free article] [PubMed] [Google Scholar]
- 30.Junnila S, Kokkola A, Mizuguchi T, et al. Gene expression analysis identifies over-expression of CXCL1, SPARC, SPP1, and SULF1 in gastric cancer. Genes Chromosomes Cancer 2010; 49(1): 28–39. [DOI] [PubMed] [Google Scholar]
- 31.Lee HJ, Song IC, Yun HJ, et al. CXC chemokines and chemokine receptors in gastric cancer: from basic findings towards therapeutic targeting. World J Gastroenterol 2014; 20(7): 1681–1693. [DOI] [PMC free article] [PubMed] [Google Scholar]
- 32.Jia X, Lu M, Rui C, et al. Consensus-expressed CXCL8 and MMP9 identified by meta-analyzed perineural invasion gene signature in gastric cancer microarray data. Front Genet 2019; 10: 851. [DOI] [PMC free article] [PubMed] [Google Scholar]
- 33.Wang CJ, Zhang ZZ, Xu J, et al. THY-1 (CD90) expression promotes the growth of gastric cancer cells. Int J Clin Exp Pathol 2017; 10(9): 9878–9888. [PMC free article] [PubMed] [Google Scholar]
- 34.Climent M, Pera M, Aymar I, et al. Bone health in long-term gastric cancer survivors: a prospective study of high-dose vitamin D supplementation using an easy administration scheme. J Bone Miner Metab 2018; 36(4): 462–469. [DOI] [PubMed] [Google Scholar]
- 35.Wang Z, Xu DL, Chen Z, et al. A new mutation in COL1A1 gene in a family with osteogenesis imperfecta. Zhonghua yi xue za zhi 2006; 86(3): 170–173. [PubMed] [Google Scholar]
- 36.Ma HP, Chang HL, Bamodu OA, et al. Collagen 1A1 (COL1A1) Is a reliable biomarker and putative therapeutic target for hepatocellular carcinogenesis and metastasis. Cancers (Basel) 2019; 11(6): 786. [DOI] [PMC free article] [PubMed] [Google Scholar]
- 37.Liu S, Liao G, Li G.Regulatory effects of COL1A1 on apoptosis induced by radiation in cervical cancer cells. Cancer Cell Int 2017; 17: 73. [DOI] [PMC free article] [PubMed] [Google Scholar]
- 38.Shi Y, Wang J, Xin Z, et al. Transcription factors and microRNA-co-regulated genes in gastric cancer invasion in ex vivo. PLoS One 2015; 10(4): e0122882. [DOI] [PMC free article] [PubMed] [Google Scholar]
- 39.Raja UM, Gopal G, Rajkumar T.Intragenic DNA methylation concomitant with repression of ATP4B and ATP4A gene expression in gastric cancer is a potential serum biomarker. Asian Pac J Cancer Prev 2012; 13(11): 5563–5568. doi:10.7314/apjcp. 2012.13.11.5563 [DOI] [PubMed] [Google Scholar]
- 40.Chen J, Röcken C, Hoffmann J, et al. Expression of carbonic anhydrase 9 at the invasion front of gastric cancers. Gut 2005; 54(7): 920–927. [DOI] [PMC free article] [PubMed] [Google Scholar]
- 41.Wang H, Meyer CA, Fei T, et al. A systematic approach identifies FOXA1 as a key factor in the loss of epithelial traits during the epithelial-to-mesenchymal transition in lung cancer. BMC Genomics 2013; 14: 680. [DOI] [PMC free article] [PubMed] [Google Scholar]
- 42.Yano H, Kitayama J, Hatano K, et al. Clustered cancer cells show a distinct adhesion behavior from single cell form under physiological shear conditions. J Exp Clin Cancer Res 2001; 20(3): 407–412. [PubMed] [Google Scholar]
- 43.Nieswandt B, Hafner M, Echtenacher B, et al. Lysis of tumor cells by natural killer cells in mice is impeded by platelets. Cancer Res 1999; 59(6): 1295–1300. [PubMed] [Google Scholar]
- 44.Palumbo JS, Kombrinck KW, Drew AF, et al. Fibrinogen is an important determinant of the metastatic potential of circulating tumor cells. Blood 2000; 96(10): 3302–3309. [PubMed] [Google Scholar]
- 45.Shi F, Wu H, Qu K, et al. Identification of serum proteins AHSG, FGA and APOA-I as diagnostic biomarkers for gastric cancer. Clin Proteomics 2018; 15: 18. [DOI] [PMC free article] [PubMed] [Google Scholar]
- 46.Bloomston M, Zhou JX, Rosemurgy AS, et al. Fibrinogen gamma overexpression in pancreatic cancer identified by large-scale proteomic analysis of serum samples. Cancer Res 2006; 66(5): 2592–2599. [DOI] [PubMed] [Google Scholar]
- 47.Duan S, Gong B, Wang P, et al. Novel prognostic biomarkers of gastric cancer based on gene expression microarray: COL12A1, GSTA3, FGA and FGG. Mol Med Rep 2018; 18(4): 3727–3736. [DOI] [PMC free article] [PubMed] [Google Scholar]
- 48.Li XS, Xu Q, Fu XY, et al. ALDH1A1 overexpression is associated with the progression and prognosis in gastric cancer. BMC Cancer 2014; 14: 705. [DOI] [PMC free article] [PubMed] [Google Scholar]
- 49.Xu SL, Liu S, Cui W, et al. Aldehyde dehydrogenase 1A1 circumscribes high invasive glioma cells and predicts poor prognosis. Am J Cancer Res 2015; 5(4): 1471–1483. [PMC free article] [PubMed] [Google Scholar]
- 50.Sadjadi A, Yazdanbod A, Lee YY, et al. Serum ghrelin; a new surrogate marker of gastric mucosal alterations in upper gastrointestinal carcinogenesis. PLoS One 2013; 8(9): e74440. [DOI] [PMC free article] [PubMed] [Google Scholar]
- 51.Liu WT, Liu WB, Gao M, et al. Expression of ALDH1A1 and CD133 is associated with the prognosis and effect of different chemotherapeutic regimens in gastric cancer. Oncol Lett 2019; 18(5): 4573–4582. [DOI] [PMC free article] [PubMed] [Google Scholar]
- 52.Shen JX, Liu J, Li GW, et al. Mining distinct aldehyde dehydrogenase 1 (ALDH1) isoenzymes in gastric cancer. Oncotarget 2016; 7(18): 25340–25349. [DOI] [PMC free article] [PubMed] [Google Scholar]
- 53.Yan P, He Y, Xie K, et al. In silico analyses for potential key genes associated with gastric cancer. PeerJ 2018; 6: e6092. [DOI] [PMC free article] [PubMed] [Google Scholar]
- 54.Qi W, Sun L, Liu N, et al. Tetraspanin family identified as the central genes detected in gastric cancer using bioinformatics analysis. Mol Med Rep 2018; 18(4): 3599–3610. [DOI] [PMC free article] [PubMed] [Google Scholar]
- 55.Yang CK, Wang XK, Liao XW, et al. Aldehyde dehydrogenase 1 (ALDH1) isoform expression and potential clinical implications in hepatocellular carcinoma. PLoS One 2017; 12(8): e0182208. [DOI] [PMC free article] [PubMed] [Google Scholar]
- 56.Adam SA, Schnell O, Pöschl J, et al. ALDH1A1 is a marker of astrocytic differentiation during brain development and correlates with better survival in glioblastoma patients. Brain Pathol 2012; 22(6): 788–797. [DOI] [PMC free article] [PubMed] [Google Scholar]
- 57.Böckelman C, Beilmann-Lehtonen I, Kaprio T, et al. Serum MMP-8 and TIMP-1 predict prognosis in colorectal cancer. BMC Cancer 2018; 18(1): 679. [DOI] [PMC free article] [PubMed] [Google Scholar]