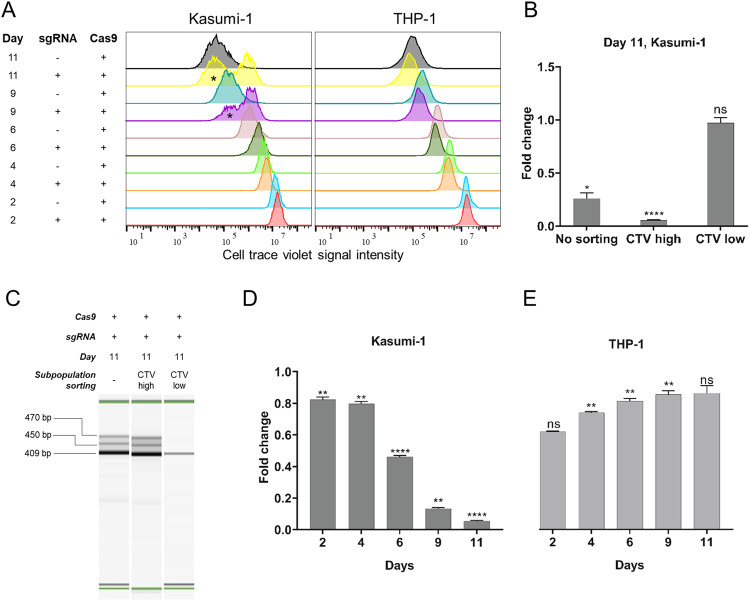
Fig. 4. In vitro RUNX1-RUNX1T1 disruption effectively inhibits AML t(8;21) cancer cell proliferation.
A Flow cytometry analysis of cell proliferation rate 2, 4, 6, 9 and 11 days following electroporation delivery of RNPs (RX2-RXT1) to Kasumi-1 (left) and THP-1 cells (right). Asterisk (*) marks the in silico sorted CTV-low subpopulations at day 9 and 11 which were excluded from the analysis. B Fold change Kasumi-1 cell proliferation rate in the in silico sorted CTV high and CTV low subpopulations 11 days following electroporation delivery of RNPs (RX2-RXT1). CTV cell trace violet signal intensity. No sorting (left) *p = 0.011, CTV high (middle) ****p < 0.0001, CTV low (right) nsp = 0.993. C PCR analysis of CRISPR-Cas9 cleavage products 11 days following electroporation delivery of RNPs (RX2-RXT1) to Kasumi-1 and flow cytometry CTV-signal-intensity based in vitro sorting. No sorting: day 11 cell population before sorting, CTV high: day 11 cell population with high CTV signal intensity, CTV low: day 11 cell population with low CTV signal intensity. Theoretical PCR product sizes (bp) for RX2-RXT1 = 391. Green lines at 15 and 1000 bp: capillary electrophoresis alignment marker. Bands above theoretical band size are on-target CRISPR-Cas9 cleavage products with DNA repair generated insertions. D Fold change Kasumi-1 cell proliferation rate 2, 4, 6, 9 and 11 days following electroporation delivery of RNPs (RX2-RXT1). D2 **p = 0.002, D4 **p = 0.001, D6 ****p < 0.0001, D9 **p = 0.004, D11 ****p < 0.0001. E Fold change THP-1 cell proliferation rate 2, 4, 6, 9 and 11 days following electroporation delivery of RNPs (RX2-RXT1). D2 ns p = 0.056, D4 **p = 0.001, D6 **p = 0.002, D9 **p = 0.003, D11 ns p = 0.054.

