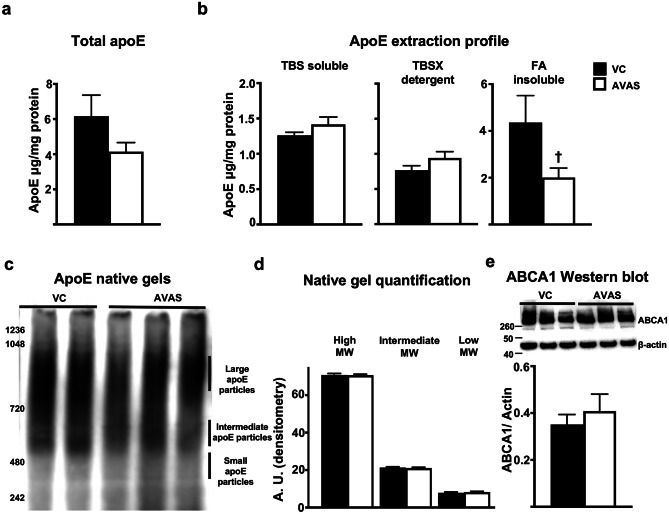
Fig. 7.
ApoE4 levels, lipidated apoE4, and ABCA1 levels are not affected by AVAS treatment. a Total apoE and b apoE extraction profile from the CX measured by apoE ELISA. c Native gel for apoE. d Quantification of apoE particles by size from native gel. e Western blot (top) for ABCA1 levels in the CX, normalized to β-actin for quantification (bottom). Data are expressed as mean ± SEM (n = 6–10), analyzed by Student’s t test, p < 0.05, † = vs. VC

