

Abstract
Clinical prediction of underlying pathologic substrates in people with Alzheimer’s disease (AD) dementia or related dementia syndromes (ADRD) has limited accuracy. Etiologic biomarkers — including cerebrospinal fluid (CSF) levels of AD proteins and cerebral amyloid PET imaging — have greatly modernized disease-modifying clinical trials in AD, but their integration into medical practice has been slow. Beyond core CSF AD biomarkers (including beta-amyloid 1–42, total tau, and tau phosphorylated at threonine 181), novel biomarkers have been interrogated in single- and multi-centered studies with uneven rigor. Here, we review early expectations for ideal AD/ADRD biomarkers, assess these goals’ future applicability, and propose study designs and performance thresholds for meeting these ideals with a focus on CSF biomarkers. We further propose three new characteristics: equity (oversampling of diverse populations in the design and testing of biomarkers), access (reasonable availability to 80% of people at risk for disease, along with pre- and post-biomarker processes), and reliability (thorough evaluation of pre-analytical and analytical factors influencing measurements and performance). Finally, we urge biomarker scientists to balance the desire and evidence for a biomarker to reflect its namesake function, indulge data- as well as theory-driven associations, re-visit the subset of rigorously measured CSF biomarkers in large datasets (such as Alzheimer’s disease neuroimaging initiative), and resist the temptation to favor ease over fail-safe in the development phase. This shift from discovery to application, and from suspended disbelief to cogent ingenuity, should allow the AD/ADRD biomarker field to live up to its billing during the next phase of neurodegenerative disease research.
Supplementary Information
The online version contains supplementary material available at 10.1007/s13311-023-01370-8.
Keywords: CSF biomarkers, Alzheimer’s disease, Dementias, Cerebrospinal fluid, Validation
Introduction
2022 saw the regulatory approval of the first in vitro diagnostic test for Alzheimer’s disease (AD), 35 years after the first published attempt to measure beta-amyloid peptides in human cerebrospinal fluid (CSF) in people with clinically diagnosed AD dementia [1] and 10 years after the first human position emission tomography (PET) tracers for amyloid was approved. This regulatory milestone somewhat detracts from the commercial availability of CSF measures for beta-amyloid 1–42 (Aβ42), total tau (t-Tau), and tau phosphorylated at threonine 181 (p-Tau181) predating the approval for human amyloid PET imaging, as well as the standardized for-research-use-only measures of the same proteins in key laboratories across the world first by enzyme-linked immunosorbent assay (ELISA) and then by multi-plexed immuneassay-based analyte profiling. As a frame of reference, one of us (WTH) first performed Aβ42 and the related beta-amyloid 1–40 (Aβ40) assays more than 20 years ago. Ironically, the reliance on a diagnostic threshold entirely immune to human and manufacturing errors likely slowed the acceptance of CSF AD biomarkers relative to the clinician/reader-based interpretation of amyloid PET imaging. This was made worse by US neurologists’ reluctance to perform lumbar punctures due to low reimbursement rates relative to procedures performed under fluoroscopy or by advanced practice providers [2]. Nevertheless, this prolonged reduction to actual practice provides a sobering opportunity to reflect on earlier standards set for CSF biomarker performance and validation within evolving conceptual models of neurodegeneration, disease-modifying therapies, and care financing.
Contemporary biomarker work in AD and related neurodegenerative disorders (ADRD, including tau- and TDP-43-related frontotemporal lobar degeneration [FTLD], α-synucleinopathy such Parkinson’s disease [PD] or Lewy body disease [LBD], and prionopathy among others) often followed initial goals set forth by the 1998 National Institute of Health Working Group which defined biomarkers as “a characteristic that is objectively measured and evaluated as an indicator of normal biological processes, pathogenic processes, or pharmacologic responses to a therapeutic intervention” [3]. A biomarker is thus epistemologically distinct in its objectivity from findings arising from structured interviews (e.g., fall, pacing) as well as physical examinations (e.g., postural instability, perceptual boundedness), since these clinician-observable/elicited measures are subject to reporting and recall biases. However, their objective nature comes with additional caveats related to manufacturing standards, ease of use, cost, operator characteristics, reproducibility across space and time, and evolving technology. These challenges are not unique to AD/ADRD biomarkers but have few precedents in AD/ADRD biomarker research. Better known examples in neurology and medicine include CSF oligoclonal banding which went through slow uptake [4, 5], automation [6–9], protocol standardization [10, 11], and even patient blaming [12]; anti-nuclear antibodies which evolved from visual interpretation to objective imaging [13], automated antibody detection [14–16], protocol harmonization [17–21], and further innovation in technology and quality [22–26]. Biomarkers as objective clinical findings are thus not infallible, but are magnitudes more reproducible than clinician reported findings [27, 28].
It is critical to recognize that advances in biomarkers do not diminish the clinician’s role in a patient’s diagnostic or care journey. Whereas biomarkers are developed and tested in participant cohorts, they will be most frequently used at the individual patient level. Reducing past population-level performance characteristics (e.g., sensitivity, specific) to a prospective patient’s clinical profile calls for professional judgment which can be poorly algorithmic [29]. We previously proposed a fluid cut-off threshold for CSF AD biomarkers according to purpose at the cohort level [30], such that we maximize specificity over sensitivity for a disease-modifying clinical trial but sensitivity over specificity for natural history or prevention studies. We may alternatively need adjustable thresholds at the individual patient level according to factors such as co-neuropathologies (e.g., positive AD biomarkers in someone with PD), medical co-morbidities (plasma p-Tau181 in someone with chronic renal disease [31]), and each individual’s risk tolerance (for false biomarker findings). Clinicians must judiciously select appropriate biomarkers based on the probability of a patient having the disease relative to the alternate explanation, and refrain from catastrophizing or excessive follow-up testing when unexpected findings return (e.g., reduced CSF Aβ42 or increased p-Tau181 levels associated with neuroinflammation rather than AD in HIV-associated neurocognitive disorders [32–34]). Biomarkers thus have the potential to simultaneously complement, supplant, approximate, or hinder clinician-based decision making in a user-dependent fashion, and the definition of “user” in the USA has been vastly expanded by the 21st Century Cures Act’s mandate for immediate electronic release of test results to patients [35, 36].
Revisiting Disease-Related Characteristics of Biomarkers
Early goals of biomarkers — most applicable to diagnosis in AD/ADRD due to poor clinicopathologic correlation — can be conveniently summarized as “good, straightforward, and inexpensive” [37–39] (Table 1). Some of these goals had defined thresholds (sensitivity, specificity) while others were aspirational without suitable comparator (e.g., affordable, non-invasive). Quantified thresholds for sensitivity and specificity (≥ 80%) were straightforward goals in a clinical setting with a reasonable suspicion that an individual undergoing testing has the disease of interest, but studies evaluating biomarker performances are more often carried out using convenient samples without adequate healthy control subjects (for sensitivity, due to perceived challenges in recruiting healthy older adults for LPs) or appropriate neurological controls (for specificity, in the absence of a standard bank of CSF samples representing conditions mimicking the disease of interest). Differential inclusion of convenient neurological control samples (especially those investigated via LPs such as normal pressure hydrocephalus [NPH] and idiopathic intracranial hypertension) stands to skew the performance of one or more biomarkers. For example, NPH has been associated with reduced levels of Aβ42, t-Tau, and p-Tau181 [40–43], and juxtaposing NPH with AD inflates the sensitivity of t-Tau and p-Tau181 while overlooking the same in Aβ42.
Table 1.
Ideal characteristics of biomarkers
| Goal | Intended study design to assess characteristic (gold standard: confirmation by autopsy, genetic, or other means) | Commonly used study design to assess characteristic | Proposed assessment study design | |
|---|---|---|---|---|
| Sensitivity | > 80% | Disease (gold standard) vs. healthy control | Disease (gold standard or clinical) vs. available (local or external) healthy control or any clinical neurological control |
Confirmatory (differential diagnosis): disease (gold standard) vs. matched neurological control (gold standard), collected through same SOP at ratio reflecting differential diagnosis; Population-level screening: disease (gold standard) vs. matched healthy control, collected through same SOP at ratio reflecting disease prevalence |
| Specificity | > 80% | Disease (gold standard) vs. other similar neurological conditions (gold standard) | ||
| Validated in at least two independent laboratories | N/A | Comparable assays used in similar study design in two independent laboratories, each using a standardized cohort | Assays targeting same antigen/biomarker in two established laboratories, sourcing available samples | Originating laboratory reporting of technical assay performance (freeze/thaw, delay, assay) and level differences using samples collected through SOP, and qualifying validating laboratory reporting on adherence to SOP, using same assay platform and samples collected through SOP |
| Easy to use | N/A | Limited specialized training necessary |
Collection away from clinic (phlebotomy, imaging); Easily detectable using a common unstandardized method (e.g., ELISA) |
Collection practical based on professional licensing/credential (not necessarily reimbursement) of usual clinical personnel; Assays theoretically translatable through SOP and reasonable training; Automated assays |
| Affordable | N/A |
Small financial burden on individuals relative to income and other living/medical expenses; equivalent to cost of prior clinical assessments; Minor societal burden relative to current financial cost of disease |
Cost effectiveness using quality-adjusted life year and country-specific threshold based on current treatment modalities; Coverage by insurance plan |
Cost relative to substituted/replaced clinical pathways; cost effectiveness relative to current and expected range of future treatment modalities |
| Equitable | New | N/A | Affordable by people from diverse racial/ethnic backgrounds, socio-economic status | Inclusive in development and validation of people from affected sexual/gender, racial/ethnic, socioeconomic, cultural, rural vs. urban, and co-morbidities/disabilities with sufficient power to detect inter-group differences |
| Accessible | New | N/A | Existing in current medical environment regardless of pre/post-biomarker processes | Readily accessible (physical distance, wait time) to 80% of at-risk and affected population, with similarly accessible pre/post-biomarker processes (e.g., confirmatory test for screening test) |
| Reliable | New | N/A | Stable through freeze–thaw, pre-analyical delay, human errors | Well-characterized effects from pre-analytical/analytical variables (including human errors), with performance modifiable through training and process improvement |
In addition, two evolving recognitions in neurodegenerative disorders have repeatedly challenged the interpretation of biomarkers’ performance characteristics: pre-symptomatic and mixed neuropathologic changes (NC). Pre-symptomatic ADNCs and α-synuclein NCs are expected to have CSF correlates in the absence of clinical symptoms [44–49]. While older adults with a combination of abnormal core CSF AD biomarkers and normal cognition would not carry a diagnosis of very mild AD dementia according to most clinical criteria [50, 51], their inclusion in a biomarker validation study would artificially diminish abnormal core CSF AD biomarkers’ specificity [52, 53]. Mixed NCs in people with a clinically homogeneous neurological disorder (e.g., AD and TDP-43 neuropathologic changes in someone with clinical and pathologic PD) [54–58] may also lead to premature dismissal of promising biomarkers when those with mixed NCs are included as neurological controls, and it remains to be seen if mixed NCs themselves influence the NC-biomarker association.
One solution is to conduct biomarker studies proximal to death. Florbetapir was confirmed as a PET biomarker for cerebral amyloid deposition by recruiting people referred to hospice or palliative care for temporally linked clinicopathologic analysis [59]. While this design was conceptually novel, it is impractical for multiple investigators to target people in terminal stage of their illnesses (neurological and non-neurological) to participate in most biomarker studies. Because protein composition also differs greatly between ventricular and lumbar CSF [60–66], using post-mortem ventricular CSF for biomarker discovery with hopes of translating to early disease diagnosis — especially in people who experience agonal or septic states prior to death — is not a viable alternative. Another approach is to leverage familial cases with highly predictable etiologies, and pathogenic mutations for AD, FTLD TDP-immunoreactive lesions (FTLD-TDP), and FTLD (FTLD-Tau) are continuing to expand in number and complexity [67–71]. For diagnostic biomarkers, we thus propose that sensitivity and specificity analysis be determined first against etiologically (neuropathology, pathogenic mutations, CSF amyloid and tau markers) defined neurological controls most likely to mimic the disease of interest, before similar analyses are carried out between the disease of interest and healthy participants.
Revisiting Human Factors of Ideal Biomarkers
More aspirational goals of an ideal biomarker include ease of performance and affordability, with non-invasive procedures considered easier to perform. This interpretation may reflect more the clinicians’ preference than a patient, which is additionally worrisome since physicians poorly understand patients’ preferences [72–74]. Acceptance for each biomarker modality also varies according to regional culture [75], and even the definition of non-invasive (physically defined as not penetrating the skin or entering the body) seems to shift [76–81]. Better known ease-of-performance examples in AD/ADRD biomarkers involve those with defined performance characteristics: MRI, CSF, and PET. MRI — useful for the detection of neurodegeneration irrespective of etiology — is easy to perform from the clinicians’ perspective as most of the data collection is performed by the scanner and the technician. Unanticipated events do require clinician attention, with the most common being claustrophobia in approximately 3% of imaging sessions [82]. LPs — necessary for CSF-based determination of ADNC and α-synucleinopathy — are performed mostly by non-radiology physicians in Europe and a mix of radiologists and non-radiologists in the USA. A multi-center LP feasibility study involving 3868 European patients as part of BIOMARKAPD [83] showed most participants to be calm before the procedure (77%), and a similar proportion of procedures (71%) were technically easy (defined as involving a single attempt). Approximately 5% of the LPs attempted in BIOMARKAPD were difficult or unsuccessful. Similarly, fluoroscopy — most often deployed when LPs are unsuccessful without imaging-guidance in the USA — was only required for 5.4% of participants undergoing CSF collection in the Parkinson’s Progression Marker Initiative [84]. Thus, both MRI and LPs are easy to perform after appropriate training, although acceptability — by patients — of either has been infrequently studied [75, 85–87].
Both MRI and LPs have relative contraindications which influence ease of performance. Cardiac implantable electronic devices (CIED such as pacemakers and defibrillators) have historically been contraindicated in MRI procedures, and even those with abandoned leads from older devices are routinely denied access. Recent studies, however, suggest that even older CIEDs have acceptable MRI safety. In a registry-based study of 1000 patients with CIEDs not approved specifically by the FDA for MRI, there was only one case of device failure after 1.5T MRI due to inappropriate pre-image device programming [88]. MRI was similarly safe in 80 patients with abandoned older device leads undergoing 1.5T MRI, with no biochemical evidence of cardiac injury detected by troponin [89]. Most recently, safety was further demonstrated in 26 patients undergoing 3T MRI with non-conditional CIED [90], but there remains a paucity of information on MRI safety for other implantable devices such as cochlear implants and implanted infusion pumps [91–94]. Yet, most centers continue to expend innumerable clinical and administrative days contacting device manufacturers for MRI safety information. For CSF collection, anti-coagulation is the most commonly encountered contraindication. The increased prescription of non-coumadin oral anticoagulants [95, 96] among older adults at risk for AD/ADRD pits ease of performance against safety when it comes to CSF biomarker-based AD diagnosis, with the only death in BIOMARKAPD resulting from premature re-initiation of anti-coagulation [83].
Compared to MRI and CSF, PET has fewer contraindications but is much less affordable both for the initial start-up and per-scan cost. In our region (northern New Jersey), AD CSF biomarkers have a 2023 national reimbursement cap of US $197 (US $162 for LP, US $35 for two AD protein immunoassays), compared to nearly US $4000 for amyloid PET (US $2103 for PET/CT, US $1800 for tracer). The real costs to consumers are much higher, with amyloid PET said to cost US $5–7000 [97]. At the same time, affordability has also been assessed by cost-effectiveness by health economists. Simulation studies in the USA showed that adopting amyloid scan in AD dementia is likely more cost-effective (based on mildly improved quality-adjusted life years [QALY]) than in the milder stages [98] using a threshold of US $50,000 per QALY gained. Conflicting data on the cost effectiveness of amyloid PET have emerged from France [99], Spain [100], and South Korea [101] with QALY gain of 0.003–0.08 (higher estimates assuming treatment-associated reduction in conversion from pre-dementia to dementia by 25–50%). Paradoxically, the US-based simulation found amyloid PET to be potentially more cost effective in the dementia than pre-dementia stage [98], even as biomarker confirmation is more clinically useful and recommended in the pre-dementia than dementia phase [102, 103]. More refined economic modeling taking into account current states of biomarker automation, disease-modifying therapies, and societal cost will ultimately be necessary to determine if QALY gained is the best indicator of a diagnostic modality.
Three New Traits of Ideal Biomarkers
Performance characteristics, cost, and availability bring us to propose three additional traits which have garnered significant discussion: equitable, accessible, and reliable. Equity in North America has often been defined along racial lines, and there is mounting corroborating evidence that genetic, CSF, and MRI biomarkers differ between major racial groups [34, 104–107]. We led the most significant work related to CSF AD biomarkers by recruiting older Black/African American participants from community events in the greater Atlanta area [104, 106], and the specific differences in tau-related biomarkers — but not amyloid — were entirely replicated in an independent cohort in St. Louis [105]. Even though we have been accused of biological racism, denying these differences would actually lead to AD under-diagnosis among older Black/African American patients and worsen existing inequity. Only bilateral discussion with the impacted communities and enhanced cultural as well as scientific humility can maximize these findings’ benefits to the health disparity populations, while reducing the scientific abuse of precision medicine to an irritation [108–110]. To accomplish these goals, partnerships with scholars in cultural anthropology beyond AD scientists of African descent, especially those at Historically Black Colleges and Universities, may have the greatest chance of achieving long-lasting authentic impact.
Equity extends further beyond race along the divides of ethnicity, sex, income, and residential location. Insufficient numbers of older adults from Asian subgroups have participated in North American or European studies to determine whether systemic differences in CSF biomarker levels exist, and some Asia-based biomarker studies have reported biomarker levels outside of the typical range [111, 112]. It is also already known that sex influences CSF tau-related biomarker levels [113, 114], but there is no information on whether disparate dementia rates between urban and rural are reflected in CSF and other biomarkers. Because over-enrollment of disparate populations is needed to identify group-level differences, we define the goal of equity as sufficiently powered investigations to determine whether biomarker findings developed in majority–majority cohorts replicate in non-majority populations [115, 116].
Separate from but related to equity is access. If affordability is gauged by the gap between cost and health coverage relative to one’s own ability to pay, access encompasses additional social, cultural, economic, and geographic factors which influence availability of health care goods — in this case, biomarker services — to individuals [117]. These factors may include physical distance to, acceptability of [118], timeliness of biomarker services [119, 120], as well as a trained workforce to perform and interpret said biomarker services [119]. For the case of diagnostic AD biomarkers, blood and retinal biomarkers are proposed to enhance access to specialists and more involved biomarker testing. However, incomplete understanding of properties necessary for screening biomarkers in a stage-wise algorithm — common in medical practice but relatively novel in AD/ADRD research — has led to acceptance of performance characteristics on par with APOE genotyping [121]. It remains controversial whether rural residents face greater AD/ADRD risks than urban residents [122–125], but rural Americans with AD/ADRD are less likely to have neuropsychological testing [126] and more likely to have emergency visits [127]. The closure of rural hospitals in the USA additionally led to further reduction of on-site diagnostic imaging [128]. Critical access hospital (CAH) status was created to maintain essential health services in these underserved areas, and make up 64% of all rural hospitals in the USA. Currently, only eight states offer PET/CT services in at least 25% of their CAHs, but none of the 50 states offering PET/CT in at least 50% of the same [129]. In contrast, LP can be completed with high success rates in rural Central Africa [130, 131], India [132], and Nepal [133], yet are not performed as often in US rural hospitals than US urban hospitals after adjusting for total visit differences [134]. Because health service availability in the USA is simultaneously linked to reimbursement and cost-effectiveness, increased reimbursement for CSF AD biomarkers in CAHs may be necessary to reduce the urban–rural access disparities [135].
Biomarker Reliability
For a biomarker to be tested for performance, affordability, equity, and access, its measurement must be first and foremost reliable. This need was perhaps presumed before, but failure-to-replicate biomarker reports over the past 20 years have proven the opposite. Compared to mechanistic studies, biomarker researchers invest an extraordinary amount of time on assay accuracy (how close a measurement approximates the true value) and precision (how close repeated measurements approximate one another). There is no doubt that these assay-level parameters enhance the technical measurement of a protein or molecule, but they alone are insufficient in rigor and reproducibility towards the measure’s qualification as a biomarker. Unlike aqueous buffer solutions, human fluids contain large numbers of biologically active substances which can influence any one biomarker’s structure, protein-binding, solubility, and antigenicity at room temperature or below. Because biofluid research relies heavily on previously collected samples in long term − 80 °C storage, there has been increasing scrutiny on the effect of processing, freezing, and thawing human CSF and blood-related products on measured biomarker levels.
Stability of Biomarkers Through Freeze–Thaw Cycles
Freezing of biofluid at − 80 °C or liquid nitrogen is routine and necessary for biobanking, but even one freeze–thaw cycle may decrease — or paradoxically increase — measured protein levels. The term freeze–thaw cycle originates in earth sciences and has been incorporated into chemical and biological development processes [136]. Frozen biofluids are known to lead to the formation of precipitant [137] which itself has been leveraged to extract genomic DNA [138]. Documenting the effects of repeated freeze–thaw cycles on biomarker measurements was uncommonly practiced in single [139]- or multi [140]-plex immunoassay-based studies including in AD biomarker work [141] until the past 10 years. Our group first learned of freeze-thawing effects serendipitously during pre-ADNI multi-analyte profiling using a 191-protein panel [53, 70]. In this effort, never thawed CSF and plasma samples from people with autopsy-confirmed AD and FTLD were shipped from University of Pennsylvania to an outside vendor, and measured protein levels were returned to us for subsequent statistical analysis and modeling. One pre-determined analysis sought to identify CSF proteins which could differentiate between people with the two main pathologic FTLD subtypes — FTLD-TDP and FTLD-Tau. CSF levels of agouti-related peptides (AgRP) and adrenocorticotropin release hormone (ACTH) appeared to robustly separate FTLD-TDP from FTLD-Tau [70], and this even led to immunohistochemical investigation of the hypothalamus in the two FTLD subtypes [142]. However, our replication attempt at Emory failed to show the same magnitudes of AgRP and ACTH level differences between the FTLD groups [71], and follow-up experiments showed marked degradation of the two markers after just one freeze–thaw cycle. We reasoned that freeze-thawing of FTLD-Tau CSF samples artifactually amplified the difference between the two groups, even though we could never confirm freeze–thaw cycles for these or other samples through the vendor. Following this incident, our group has incorporated into our standard operating procedures three practices. First, we always use never-thawed samples for large-scale biomarker discovery [34, 143–145] unless targeted protein or metabolite levels were previously validated to withstand freeze-thawing effects in the biological matrix. Second, when establishing contracts with outside vendors or academic collaborations where biomarker measurements will be performed elsewhere, we insist on the documentation of freeze–thaw cycles between external parties’ sample receipt and analysis.
Finally, when developing a new assay, we investigate freeze–thaw effects as an early indicator of biomarker stability (Fig. 1). To the best of our as knowledge, there is no standard recommendation for how best to assess the freeze-thawing effects [146, 147]. Because freeze-thawing most often occurs in academic laboratory settings when a frozen biofluid aliquot needs to be divided into smaller volumes, our laboratory uses thawing on wet-ice as the standard while others use thawing to room temperature [148]. Freeze–thaw effects may also differ between samples collected. We thus do not strictly rely on whether there is a statistically significant effect on the repeated measures. Even in the absence of a standardized approach to assess this effect, accounting for them (or at least minimizing freeze–thaw cycles) during study design is becoming more commonplace in the development of protein biomarkers for AD [149–152], PD [153, 154], and epilepsy [155] as well as in large epidemiological studies such as Atherosclerosis Risk in Communities [156], CSF metabolomics [157, 158], and even commercial laboratories such as ARUP. These incremental advances have been accompanied by calls for greater methodological transparency, but adherence to these calls waxes and wanes in the absence of a mandate. As rigor and reproducibility have again taken center stage in US federally funded research, such mandates by funders, publishers, and peer reviewers will likely be necessary to reduce waste associated with irreproducible biomarker science.
Fig. 1.

Freeze–thaw effects on assays performed in our laboratory. CSF analytes generally have a minimum of one freeze–thaw cycle after collection from living participants, unless analyzed immediately without banking. Analytes can have stable levels across multiple freeze–thaw cycles (A), or have stable levels in some samples but not others (B). Otherwise, CSF analytes may undergo loss after multiple freeze–thaw cycles even when not readily apparent to investigators (C), or with appreciable loss much greater than measurement variability (D; p values reflect main effect of cycle number)
Stability of Biomarkers Through Post-Collection Lag
Other than variances during assay preparation, inconsistent interpretation of or adherence to pre-analytical protocols by support staff represents another source of variability often invisible to upstream clinicians or downstream laboratories. In the multi-centered ADNI, CSF was to be collected using Sprotte spinal needles to reduce the incidence of post-lumbar puncture headaches into polypropylene collection tubes, immediately frozen, and shipped to the Biomarker Core at Penn; blood was also to be expeditiously centrifuged at 4 °C temperature, aliquoted, and frozen.
The period of time between biofluid removal from a living person to freezer-based banking has two potential delays: before centrifugation (obligatory for plasma and optional for CSF) and before freezing. These delays are entirely dictated by physical access, including distance to centrifuge/freezer and a capacity-associated queue to access them relative to other clinical research teams. These delays are worthy investigation as biochemical processes can continue to alter measured biomarker levels ex vivo. Because of the need to separate blood components to generate plasma aliquots, there is an intrinsic difference (typically 10–15 min) between the CSF and plasma delays. Some studies have an optional CSF centrifugation process to either remove cellular debris or collect cellular components for additional analysis, and studies collecting serum have a 30-min room temperature coagulation time prior to centrifugation.
We are not aware of systemic effort to characterize the effects of small differences in delay time on CSF biomarker stability and measures. This may be due to the limited overall availability of CSF samples and the desire to maximize all collected fluids [159]. In blood, studies on the impact of pre-analytical factors such as delay time (as well as temperature) on AD/ADRD biomarkers [106, 117–121] are greatly dwarfed by the number of papers demonstrating their diagnostic and prognostic potential, but already such effects have been observed for plasma t-Tau, p-Tau181, and NfL leves [103]. During the course of a previous pilot for which our group had to transport blood samples on wet ice from one physical site to another, we simulated the effects of lag time (including transportation) on the commonly measured brain derived neurotrophic factor (BNDF; Invitrogen Human ELISA Kit) levels using two sites each equipped with a refrigerated centrifuge (Fig. 2). We found that, when kept in whole blood on wet ice (followed by typical centrifugation, aliquoting, freeze/thawing, and measurement), plasma BDNF levels had a half-life of approximately 1 h. Based on this pilot, we elected to only prospectively use samples which can undergo immediate centrifugation because of the unpredictable nature of commute-related delays, at the expense of a smaller participant cohort. A similar experiment involving BDNF was carried out recently in a larger group of 17 healthy men with lag time of 30, 60, 180, 240, and 300 min using a mature BDNF assay (Biosensis, Thebarton, Australia) [160]. Remarkably, only three individuals had appreciable degradation within 60 min of lag time, while others had stable or even increases in BDNF levels. These differences could be potentially reconciled by findings from a third study that K2EDTA tubes preferentially influenced more the measured plasma BDNF levels in women than men [161]. The same study further showed increases in BDNF levels after freezing at − 80 °C for 12 months regardless of the type of tubes used. Altogether, these findings raise moderate concerns over the feasibility of BDNF as a biomarker outside most specialized centers.
Fig. 2.

Effects of ice time and specimen transportation on BDNF levels. Three vials of whole blood were collected from two individuals in K2-EDTA tubes at site 1. One tube was immediately centrifuged, aliquoted, and frozen, while the other two tubes were transported and processed approximately 2 and 4 h later (A). Measured plasma BDNF levels showed a half-life of ~ 1 h (56 and 57 min) (B)
Meaning Behind Altered Biomarker Levels — One Too Many, or One of Many?
Many CSF biomarkers have been variably labeled as markers for individual pathogenic processes based on the presence of these proteins in pathologic lesions. Prime examples include Aβ42 as a marker of cerebral amyloidosis, t-Tau as a marker of neurodegeneration, and p-Tau181 as a marker of tangle deposition [50]. There is currently no recommendation on if/how a biomarker level change should be associated with a particular function. Without elaborate labeling studies in animals or in humans, the shared molecular identity between a fluid-phase marker and insoluble neurodegenerative pathology often seems to have greater mechanistic significance than the fluid-phase marker’s association with the more abundant soluble proteome. Several examples suggest such practices to be flawed in theory and practice:
Reduced CSF Aβ42 levels are related to cerebral amyloid deposition in AD, but low levels in HIV [32, 33, 162] and tuberculous meningitis [163] are not associated with amyloid deposition. Low CSF levels are also relatively common in young adults (< 50 years of age) with normal cognition (Fig. 1).
The only evidence supporting distinct roles for t-Tau and p-Tau181 — often captured or detected using the same antibody — comes from the observation that t-Tau levels have been elevated in strokes and Creutzfeldt Jakob disease as well as AD. For as long as CSF biomarker work has been carried out in FTLD especially FTLD-Tau with abundant tau-immunoreactive lesions, it is also well established that CSF p-Tau181 and t-Tau levels remain within physiologic ranges despite tau hyperphosphorylation, aggregation, and neurodegeneration.
Neurofilament light chain (NfL) was an agnostic marker of prognosis in multiple sclerosis (MS) before it became a marker for neurodegeneration. Altered CSF NfL levels were first found during MS flares, and their levels were noted to normalize after the acute inflammatory phase completed. Even though neurodegeneration is a known long-term sequalae of chronic MS, the magnitude of change in CSF NfL levels in MS — if one were to use NfL as a marker of neurodegeneration — would be magnitudes greater than in AD or even amyotrophic lateral sclerosis (ALS). In children with spinal muscular atrophy undergoing gene therapy, we recently showed CSF NfL levels to first decrease following therapy initiation, but then undergo elevations paralleling improved neuromuscular and clinical functions [164].
These functional assignments — more connotations than annotation in terms of rigor — often build on out-of-context conceptual models but are some of the better-known examples in the field of neurodegeneration. While it is not practical to toss out all such linkage identified to-date or require the development of a suitable transgenic animal model before biomarker refinement, sufficient caution should be exercised if a reductionist approach is used to select a biomarker for surrogate functional outcomes. This is especially pertinent if biomarker-role inconsistencies (such as in the case of t-Tau) are well established and could be potentially overcome by using multiple biomarkers reflecting a single process much in the same manner that multiple clinical measures (Mini-Mental State Examination, Alzheimer’s Disease Assessment Scale — Cognitive Subscale, Clinical Dementia Rating-Sum of Boxes) are used to assess cognition.
Some data-driven strategies have been proposed to replace the annotation-based assignment of biomarkers’ pathogenic or clinical significance. First, modern bioinformatics analyses suggest that neurodegenerative disorders influence the coupling of proteins beyond levels of individual proteins — much in the same way that they affect the coordinated functioning of large-scale brain networks [165–167] beyond volume of individual Brodmann areas:
CSF Aβ42 (Fig. 3), t-Tau, and p-Tau181 levels all increase linearly with age during early and mid-life [168–171], but CSF Aβ42 levels diverge from t-Tau and p-Tau181 with the onset of AD.
CSF t-Tau and p-Tau181 also correlate well with levels of Aβ40 and NfL despite distinct functions often assigned to each.
Normalized CSF levels of IL-6 (often used as a surrogate marker of proinflammatory response) and IL-10 (similarly used as a surrogate marker of anti-inflammatory response) are largely indistinguishable if their molecular labels were removed from analysis [144].
Fig. 3.
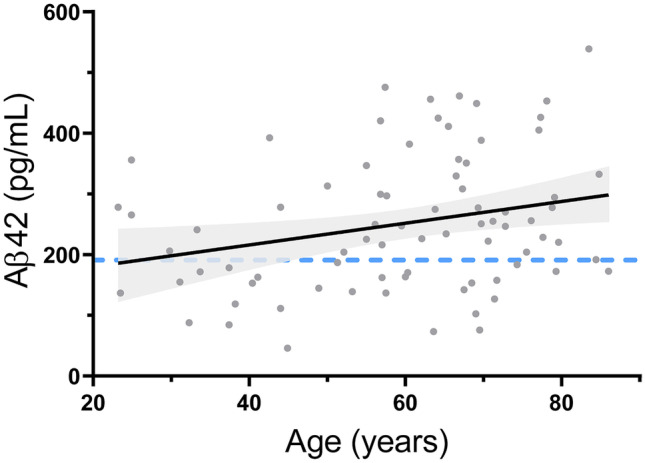
Effect of age on CSF Aβ42 levels in people with normal cognition recruited by our group. Best fit line and associated 95% confidence interval are shown (p = 0.01 for positive slope). Blue dotted line represents ADNI-derived threshold below which cerebral amyloid deposition is likely
Dimension reduction approaches such as principal component analyses are commonplace to identify whether a similar disease influence associates with coordinated changes in groups of biomarkers. A variance-based instead of a correlation-based approach has the advantage of putting forth latent or composite measures predictive as well as independent of the lowest common feature (e.g., reduced CSF Aβ42/Aβ40 levels). Even though it is tempting to suggest cause-effect relationships (a la pathway analysis), coordinated changes between biomarkers result from similar half-lives or a shared surface sheddase. If they are technically valid, however, their agnostic value-added should allow for accelerated laboratory standardization and clinical utility without complete biochemical characterization. Follow-up hypotheses and experiments centered around these proteins’ coupling and decoupling can indeed test their cellular origins in health compared to disease, processes which contribute to differential turn-over, and post-translational modifications beyond one-way gene-protein up or downregulations.
Beyond Diagnostic Biomarkers
Sensitivity and specificity measures are statistically most fitting for diagnostic biomarkers but are also relevant when biomarkers are used for other purposes. The FDA-NIH BEST (Biomarkers, EndpointS, and other Tools) Resource laid out eight major biomarker categories: diagnostic, monitoring, response, predictive, prognostic, reasonably likely surrogate, safety, and susceptibility/risk (Table 2). Among these, susceptibility/risk biomarkers — especially genomic markers and polygenic risk scores [172–175] — are most widely known in AD/ADRD. For others, testing for candidate response biomarkers has only begun over the past 10 years with introduction of anti-amyloid clinical trials. Because immunoassays for Aβ42 and Aβ40 rely on monoclonal antibodies to capture and detect the peptides, these assays had to be modified for samples derived from people treated with therapeutic anti-amyloid antibodies [176]. This was a necessary advance as an earlier anti-amyloid trial did not show bapineuzumab to alter CSF Aβ levels in conventional assays [177]. Newer assays indeed showed solanezumab treatment to elevate CSF and plasma Aβ42 and Aβ40 levels [178], but these antibody-mediated increases were challenging to interpret.
Table 2.
Relationships between biomarkers and clinician-generated information
| Biomarker function | Information provided | Relationship to clinician-derived information | Examples |
|---|---|---|---|
| Susceptibility/risk | Likelihood of healthy people to develop condition/disease | Supersedes population-level risk | APOE e4 genotype |
| Diagnostic | Presence/absence of a disease or disease subtype | Supersedes clinical diagnosis, when applied appropriately (e.g., rule-in vs. rule-out) |
CSF Aβ42/Aβ40, t-Tau/Aβ42, p-Tau181/Aβ42 |
| Prognostic | Risk of disease progression, recurrence, or a specific clinical event in a person with a specific disease | Supersedes or complements clinical prognosis according to prognostic model | PSA in prostate cancer follow-up |
| Predictive | People who more likely to respond to an exposure/intervention | Supersedes or complements clinician prediction when selecting therapies according to predictive model | Hypermethylation of the MGMT promoter in glioblastoma |
| Monitoring | Disease status without or with treatment | Supersedes or complements clinical evaluation | HIV viral load |
| Response (pharmaco-dynamic) | Biological activity of a medical product | Most often undetectable by clinical evaluation | CSF Ab42 levels with BACE1 inhibitor treatment |
| Response (surrogate endpoint) | Validated linkage to clinical outcome | May be undetectable by clinical evaluation | LDL in statin treatment trials for FDA approval |
| Reasonably likely surrogate endpoint | Expected correlation with clinical outcome without sufficient clinical data for validated surrogate endpoint | May be undetectable by clinical evaluation | Amyloid PET in FDA approval of aducanumab |
| Safety | Likelihood of toxicity or adverse side effect | Variable according to safety measures | MRI for amyloid-related imaging abnormality in aducanumab therapy |
More expected findings came with drugs targeting the enzymatic pathway necessary for the cleavage of amyloid precursor protein to generate Aβ42 and Aβ40. Verubecestat — a potent inhibitor of the beta-secretase — reduced CSF Aβ40 and Aβ42 levels by 90% in a dose-dependent manner in healthy adults as well in people with mild to moderate AD [179]. Together, anti-amyloid immunotherapy and BACE1 inhibition clearly demonstrated mechanism-dependent directions of change for CSF Aβ peptides, despite each drug’s failure to delay clinical decline. These early studies additionally laid the foundation for subsequent biomarker read-outs through the demonstration that verubecestat had no effect on time-dependent increases of CSF t-Tau levels by 7.5% over 78 weeks [180]. In contrast, aducanumab and lecanemab each increased CSF Aβ42 while also reducing t-Tau and p-Tau181 levels in their respective CSF substudies [181–183]. Therefore, assessing CSF t-Tau and p-Tau181 levels in these disease-modifying trials sequentially progressed these peptides towards becoming the first reasonably likely surrogate biomarker for anti-amyloid drugs.
Akin to the use of multiple genetic risk loci to model AD risks, our group has investigated the relationship between inflammatory protein levels and disease progression in those with biomarker-supported AD [53, 144, 184]. The inclusion of only those with abnormal core CSF AD biomarkers in these efforts avoids the pitfall of conflating diagnostic with prognostic biomarkers. For example, core CSF AD biomarkers were repeatedly heralded as prognostic markers for clinically diagnosed cases of MCI, even though the outcomes for those with underlying AD greatly diverge from those with suspected non-amyloid pathology. This type of circular logic is thankfully losing support, but work on prognostic biomarkers is still in its infancy. We propose that, to be truly independent of diagnostic biomarkers, markers of prognostic value must fluctuate between individuals in a manner orthogonal to the core diagnostic markers. This conceptual framework represents a departure from earlier work at Penn and ADNI, when we sought biomarkers which could overcome the false positive and negative outcomes of core AD biomarkers. In keeping with this, a study design comparing AD vs. non-AD is generally insufficient to discover true prognostic biomarkers, but investigating proteins and molecules which co-vary in networks within AD has identified proteins related to complement 3 [184] and soluble tumor necrosis receptor 1 [144] to each confer prognostic information. Other studies have identified soluble TREM2 [185–187] and progranulin [188] as potential biomarkers for prognosis.
Care to Dance? Presenting Biomarkers-(Still-)in-Waiting
A major advance in biomarker development over the past 15 years is the development of large datasets such as ADNI and PPMI (Table 3). Following our use of vendor-based multi-analyte profiling at Penn, similar experiments were conducted in ADNI-1 participants for plasma and CSF [189, 190]. As part of the study design, we submitted blinded duplicates from 8 participants to the outside vendor to determine measurement reliability. This resulted in the effective reduction of 190 included analytes [191, 192] first down to 159 analytes [193, 194] with measurable levels, and then to 83 [195–199] or fewer [46, 200] analytes with acceptable precision between duplicates. We recently re-examined the original list of 109 CSF analytes and found 105 (53%) with detectable CSF levels in at least half (eight or more out of 16) of the quality control samples (Fig. 4A). Among these, 34 met nominal threshold (p < 0.05) and 24 met Benjamini–Hochberg threshold for reproducible measures in blinded duplicates (Fig. 4B).
Table 3.
Variability in number of ADNI CSF analytes included in discovery-based studies
| Year | Findings | Proteins analyzed | Publication |
|---|---|---|---|
| 2013 | Using CSF proteins to differentiate between AD dementia and physiological aging | 83 | Guo et al. [195] |
| 2014 | Correlation of CSF proteins involved in microglia activation, synaptic functions, and Aβ metabolism with longitudinal Aβ42 reduction in cognitively healthy elders | 67 | Mattsson et al. [46] |
| 2014 | Genome-wide association study of CSF biomarkers | 59 | Kauwe et al. [200] |
| 2014 | Correlation of CSF proteins with AD progression | 190 | Harari et al. [191] |
| 2014 | Identification of CSF biomarkers associated with neurodegeneration | 83 | Paterson et al. [197] |
| 2015 | Identification of CSF biomarkers associated with conversion from MCI to AD dementia | 83 | Khan et al. [196] |
| 2017 | Identification of CSF protein levels with hippocampal sclerosis-aging risk SNPs | 159 | Fardo et al. [193] |
| 2018 | Examining relative sequencing of immune and core AD biomarker alterations in AD pathogenesis | 83 | Meyer et al. [199] |
| 2019 | Identification of peripheral and central pathways associated with MCI stage of AD | 159 | Pillai et al. [194] |
| 2020 | Ability of CSF biomarkers to discover AD subtypes | 83 | Tijms et al. [198] |
| 2020 | Identification of inflammatory analytes useful in AD | 83 | Pillai et al. [216] |
| 2021 | Ability of CSF biomarkers to discover AD subtypes in healthy adults | 83 | Tijms et al. [217] |
| 2022 | Association between CSF tau and non-tau biomarkers | 190 | Visser et al. [192] |
Fig. 4.

Quality control experiment in ADNI CSF multi-analyte profiling. Mean differences in analyte levels within each of eight duplicate pairs (represented as a percentage of averaged levels, A are inversely correlated with number of samples with detectable analytes (R.2 = 0.363, p < 0.001). The list of analytes with statistically determined reproducibility in the duplicates (B) according to nominal (open circles) or Benjamini–Hochberg-adjusted (closed circles) thresholds includes many analytes identified to associate with AD according to hypothesis-(asterisk by protein name) or discovery (no asterisk)-based methods. Only limited proteins have been independently verified in ADNI CSF samples (orange)
While some of these (apoJ/clusterin, chemokine C–C motif ligand 4, fibroblast growth factor 4, matrix metalloprotease 2, resistin, tumor necrosis factor-related apoptosis-inducing ligand receptor 3) were implicated in AD using discovery-based approaches, only apoE [201, 202], apoJ/clusterin [203], ferritin [204–206], alpha-2-macroglobulin [207], soluble tumor necrosis factor receptor 2 [185, 208], apolipoprotein D [209], and vascular endothelial growth factor [210, 211] have been individually investigated. Thus, nearly 20 CSF proteins with reliable measures in ADNI remain untested — and should be rapidly examined — for their association with clinical, genetic, proteomic, metabolomic, or imaging measures (Table 3).
Prioritization of Biomarker Ideals
Parallel to advances in AD/ADRD biomarkers have been leaps in AD/ADRD basic and clinical sciences. However, it is highly probable that some of the most impactful biomarker candidates have slipped into their own valleys of death due to inconsistent pre-analytical handling, assay standardization, and conceptual framing. Our group prioritizes type I over type II errors due to the large number of candidate biomarkers available and the costs for in-depth interrogation, yet there is no knowing how many of the best biomarkers have been rejected by similar philosophy. Scientists who develop and use biomarkers are thus left with a decision to concentrate their initial efforts on the trade-off between value (how the biomarker informs clinical outcomes) and performance (how good the biomarker measurements are). Most irreproducible discovery work emphasizes the former, yet each biomarker must advance through the latter to be clinically adopted. The perfect world would bring together makers of robust assays and stewards of irreproachable pre-analytical processing, but attaining such harmony may pit feasibility against practicality even with automation [212–214].
A critical ingredient in balancing value and performance may be scientist development. To-date, scientists tend to fall under the clinical/pre-analytical (collecting and processing biofluids, annotating the collection effort, and freezing the samples) or laboratory/analytical (maintaining, thawing, analyzing, and refreezing samples) branch of biomarker science. The traditional biomarker team thus pairs a clinician with a chemist, and the “hand-off” represents not only a physical transfer but also a culture shift. If we account for inter-individual biological variability, non-homogeneous properties of biofluid, ex vivo biochemical reactions, automation mishaps, and operator errors for a set of biomarkers, a minimal effect size can be empirically determined by each center such that only candidate biomarkers exceeding this minimum should be further developed. In this model, centers with better controlled pre-analytical and analytical parameters can pursue biomarkers of smaller effect sizes, while others earlier in the standardization process can limit their liability. Early career scientists affiliated with these centers can be trained at the bed, the bench, and the computer to reduce the prospect that AD/ADRD biomarkers and therapies will have similarly low rates of clinical success and regulatory approval. They will also gain insight into the clinical and laboratory teams’ mutual dependence and do away with laboratory teams establishing clinical protocols or vice versa.
Conclusion
Significant progress has taken place since our last comprehensive biomarker reviews [30, 215], yet only one biomarker has advanced to regulatory approval. The introduction of automated plasma AD biomarker assays has generated further enthusiasm in the field, but heterogeneity in blood collection and process represents an existential challenge to anything clinically meaningful. As we have reviewed here, there remains significant promise in CSF non-amyloid, non-tau biomarkers to inform human AD pathogenesis and challenge dogmatic theories, including the invariably harmful or stage-independent effects of neuroinflammation. The modernization of CSF collection and assessment in ADNI continues to bear fruit, even though most attention has centered around the proportion of analytes which failed to perform up to expectation. Looking across ADNI and other large cohorts’ available biomarker measures relative to their technical performance, the mostly unexplored panel of CSF biomarkers we annotated here — with moderate to high precision — easily forms the largest panel to be tested for prognostic, predictive, and monitoring functions.
Our colleague and mentor Dr. John Trojanwski was never one to back down from challenging, in open forums, the impact of endlessly expanding genome-wide association studies when little had been translated from pinpointing APOE as the first marker of genetic AD risk. As first the director and then co-director of the ADNI Biomarker Core, much of his vision for advancing neuropathology through CSF biomarkers in AD and PD continues to be realized through the Penn Center for Neurodegenerative Disease Research, ADNI, and PPMI. Over the past 5 years, we have witnessed a new arms race in biomarker discovery through newer platforms and unverifiable machine learning algorithms, even as promising biomarkers reviewed here are left out of most observational studies and therapeutic trials. We hope this review will renew the call to fully and rigorously test the rich, existing biomarker data with known accuracy, precision, and functional association for potential prognostic and treatment monitoring roles. After all, the ultimate goal of developing and validating a reliable core CSF biomarker panel through single- and multi-centered cohorts is to leverage its constituent biomarkers to advance medicine, and having assembled this panel of 30–50 proteins should finally shift our main focus from blithely discovery to more equitable, accessible, and clinically meaningful endeavors.
Supplementary Information
Below is the link to the electronic supplementary material.
Required Author Forms
Disclosure forms provided by the authors are available with the online version of this article.
Abbreviations
- ACTH
Adrenocorticotropic hormone
- AD
Alzheimer’s disease
- ADNC
Alzheimer’s disease neuropathologic changes
- ADRD
Alzheimer’s related disorders including FTLD, LBD, and vascular dementia
- ADNI
Alzheimer’s disease neuro-imaging initiative
- AgRP
Agouti-related peptide
- ALS
Amyotrophic lateral sclerosis
- BACE1
Beta-site amyloid precursor protein cleaving enzyme 1
- BDNF
Brain-derived neurotrophic factor
- CAH
Critical access hospital
- CIED
Cardiac implantable electronic device
- CSF
Cerebrospinal fluid
- EDTA
Ethylenediaminetetraacetic acid
- FDA
Food and Drug Administration
- FTLD
Frontotemporal lobar degeneration
- HIV
Human immunodeficiency virus
- IL
Interleukin
- IP-10
Interferon response protein 10
- LBD
Lewy body disease
- LP
Lumbar puncture
- MCI
Mild cognitive impairment
- MCP1
Monocyte chemoattractant protein 1
- MS
Multiple sclerosis
- QALY
Quality-adjusted life years
- NfL
Neurofilament light chain
- NIH
National Institute of Health
- PD
Parkinson’s disease
- PET
Positron emission tomography
- TDP-43
TAR DNA binding protein of 43 kD
Author Contribution
WTH conceived and designed the study; WTH and MK analyzed and interpreted the biomarker data; WTH and AN analyzed and interpreted the clinical, pathologic, and biomarker literature; WTH performed the statistical analysis; WTH and AN drafted a significant portion of the manuscript; MK revised the manuscript critically for important intellectual content. All authors read and approved the submission.
Funding
This work is supported by NIH R01 AG054046 and NIH RF1 AG054991.
Data Availability
Data available through ADNI or through reasonable requests.
Declarations
Competing Interests
WTH has patents on CSF-based diagnosis of FTLD-TDP, prognosis of very mild AD, and prognosis of spinal muscular atrophy following treatment; consulted for Apellis Pharmaceuticals, Biogen, Fujirebio Diagnostics, Hoffman-LaRoche; and received research support from Fujirebio Diagnostics and Linus Health.
Footnotes
Publisher's Note
Springer Nature remains neutral with regard to jurisdictional claims in published maps and institutional affiliations.
References
- 1.Pardridge WM, Vinters HV, Miller BL, Tourtellotte WW, Eisenberg JB, Yang J. High molecular weight Alzheimer’s disease amyloid peptide immunoreactivity in human serum and CSF is an immunoglobulin G. Biochem Biophys Res Commun. 1987;145(1):241–248. doi: 10.1016/0006-291X(87)91312-X. [DOI] [PubMed] [Google Scholar]
- 2.Trunz LM, Gandhi AV, Karambelkar AD, Lange SM, Rao VM, Flanders AE. National trends in lumbar puncture from 2010 to 2018: a shift reversal from the emergency department to the hospital setting for radiologists and advanced practice providers. AJNR Am J Neuroradiol. 2021;42(1):206–210. doi: 10.3174/ajnr.A6870. [DOI] [PMC free article] [PubMed] [Google Scholar]
- 3.Biomarkers Definitions Working Group Biomarkers and surrogate endpoints: preferred definitions and conceptual framework. Clin Pharmacol Ther. 2001;69(3):89–95. doi: 10.1067/mcp.2001.113989. [DOI] [PubMed] [Google Scholar]
- 4.Lowenthal A, Vansande M, Karcher D. The differential diagnosis of neurological diseases by fractionating electrophoretically the CSF gamma-globulins. J Neurochem. 1960;6:51–56. doi: 10.1111/j.1471-4159.1960.tb13448.x. [DOI] [PubMed] [Google Scholar]
- 5.Ebers GC, Paty DW. CSF electrophoresis in one thousand patients. Can J Neurol Sci. 1980;7(4):275–280. doi: 10.1017/S0317167100022733. [DOI] [PubMed] [Google Scholar]
- 6.Wybo I, Van Blerk M, Malfait R, Goubert P, Gorus F. Oligoclonal bands in cerebrospinal fluid detected by PhastSystem isoelectric focusing. Clin Chem. 1990;36(1):123–125. doi: 10.1093/clinchem/36.1.123. [DOI] [PubMed] [Google Scholar]
- 7.Desplat-Jego S, Feuillet L, Pelletier J, Bernard D, Cherif AA, Boucraut J. Quantification of immunoglobulin free light chains in cerebrospinal fluid by nephelometry. J Clin Immunol. 2005;25(4):338–345. doi: 10.1007/s10875-005-5371-9. [DOI] [PubMed] [Google Scholar]
- 8.Boudet S, Peyrodie L, Wang Z, Forzy G. Semi-automated image analysis of gel electrophoresis of cerebrospinal fluid for oligoclonal band detection. Annu Int Conf IEEE Eng Med Biol Soc. 2016;2016:744–747. doi: 10.1109/EMBC.2016.7590809. [DOI] [PubMed] [Google Scholar]
- 9.Puissant-Lubrano B. Evaluation of Cobas 8000(R) for the quantification of albumin and IgG in serum and cerebrospinal fluid. Clin Biochem. 2018;56:105–108. doi: 10.1016/j.clinbiochem.2018.04.005. [DOI] [PubMed] [Google Scholar]
- 10.Teunissen CE, Petzold A, Bennett JL, Berven FS, Brundin L, Comabella M, et al. A consensus protocol for the standardization of cerebrospinal fluid collection and biobanking. Neurology. 2009;73(22):1914–1922. doi: 10.1212/WNL.0b013e3181c47cc2. [DOI] [PMC free article] [PubMed] [Google Scholar]
- 11.Liu XN, Chen XJ, Sun XB, Qiu W, Peng LS, Li HF, et al. Establishment and consistency verification of the standard operation procedure for laboratory detection of immunoglobulin G oligoclonal bands in cerebrospinal fluid. Zhonghua Yi Xue Za Zhi. 2021;101(31):2465–2470. doi: 10.3760/cma.j.cn112137-20201127-03210. [DOI] [PubMed] [Google Scholar]
- 12.Edwards C, Leira EC, Gonzalez-Alegre P. Residency training: a failed lumbar puncture is more about obesity than lack of ability. Neurology. 2015;84(10):e69–72. doi: 10.1212/WNL.0000000000001335. [DOI] [PubMed] [Google Scholar]
- 13.Voigt J, Krause C, Rohwader E, Saschenbrecker S, Hahn M, Danckwardt M, et al. Automated indirect immunofluorescence evaluation of antinuclear autoantibodies on HEp-2 cells. Clin Dev Immunol. 2012;2012:651058. doi: 10.1155/2012/651058. [DOI] [PMC free article] [PubMed] [Google Scholar]
- 14.Grossmann K, Roggenbuck D, Schroder C, Conrad K, Schierack P, Sack U. Multiplex assessment of non-organ-specific autoantibodies with a novel microbead-based immunoassay. Cytometry A. 2011;79(2):118–125. doi: 10.1002/cyto.a.21009. [DOI] [PubMed] [Google Scholar]
- 15.Melegari A, Bonaguri C, Russo A, Luisita B, Trenti T, Lippi G. A comparative study on the reliability of an automated system for the evaluation of cell-based indirect immunofluorescence. Autoimmun Rev. 2012;11(10):713–716. doi: 10.1016/j.autrev.2011.12.010. [DOI] [PubMed] [Google Scholar]
- 16.Kivity S, Gilburd B, Agmon-Levin N, Carrasco MG, Tzafrir Y, Sofer Y, et al. A novel automated indirect immunofluorescence autoantibody evaluation. Clin Rheumatol. 2012;31(3):503–509. doi: 10.1007/s10067-011-1884-1. [DOI] [PubMed] [Google Scholar]
- 17.Bonroy C, Verfaillie C, Smith V, Persijn L, De Witte E, De Keyser F, et al. Automated indirect immunofluorescence antinuclear antibody analysis is a standardized alternative for visual microscope interpretation. Clin Chem Lab Med. 2013;51(9):1771–1779. doi: 10.1515/cclm-2013-0016. [DOI] [PubMed] [Google Scholar]
- 18.Agmon-Levin N, Damoiseaux J, Kallenberg C, Sack U, Witte T, Herold M, et al. International recommendations for the assessment of autoantibodies to cellular antigens referred to as anti-nuclear antibodies. Ann Rheum Dis. 2014;73(1):17–23. doi: 10.1136/annrheumdis-2013-203863. [DOI] [PubMed] [Google Scholar]
- 19.Bizzaro N, Antico A, Platzgummer S, Tonutti E, Bassetti D, Pesente F, et al. Automated antinuclear immunofluorescence antibody screening: a comparative study of six computer-aided diagnostic systems. Autoimmun Rev. 2014;13(3):292–298. doi: 10.1016/j.autrev.2013.10.015. [DOI] [PubMed] [Google Scholar]
- 20.Bertin D, Mouhajir Y, Bongrand P, Bardin N. ICARE improves antinuclear antibody detection by overcoming the barriers preventing accreditation. Clin Chim Acta. 2016;454:57–61. doi: 10.1016/j.cca.2015.12.034. [DOI] [PubMed] [Google Scholar]
- 21.Van den Bremt S, Schouwers S, Van Blerk M, Van Hoovels L. ANA IIF automation: moving towards harmonization? Results of a multicenter study. J Immunol Res. 2017;2017:6038137. doi: 10.1155/2017/6038137. [DOI] [PMC free article] [PubMed] [Google Scholar]
- 22.Ricchiuti V, Adams J, Hardy DJ, Katayev A, Fleming JK. Automated processing and evaluation of anti-nuclear antibody indirect immunofluorescence testing. Front Immunol. 2018;9:927. doi: 10.3389/fimmu.2018.00927. [DOI] [PMC free article] [PubMed] [Google Scholar]
- 23.Carbone T, Gilio M, Padula MC, Tramontano G, D'Angelo S, Pafundi V. A step towards standardization: a method for end-point titer determination by fluorescence index of an automated microscope. End-point titer determination by fluorescence index. J Immunol Methods. 2018;456:67–71. doi: 10.1016/j.jim.2018.02.014. [DOI] [PubMed] [Google Scholar]
- 24.Bogaert L, Van den Bremt S, Schouwers S, Bossuyt X, Van Hoovels L. Harmonizing by reducing inter-run variability: performance evaluation of a quality assurance program for antinuclear antibody detection by indirect immunofluorescence. Clin Chem Lab Med. 2019;57(7):990–998. doi: 10.1515/cclm-2018-0933. [DOI] [PubMed] [Google Scholar]
- 25.Van Hoovels L, Bossuyt X, Manfredi M, Grossi V, Benucci M, Van Den Bremt S, et al. Integrating quality assurance in autoimmunity: the changing face of the automated ANA IIF test. Clin Chem Lab Med. 2021;59(7):1247–1255. doi: 10.1515/cclm-2020-1669. [DOI] [PubMed] [Google Scholar]
- 26.Yoon S, Moon HW, Kim H, Hur M, Yun YM. Clinical performance of two automated immunoassays, EliA CTD screen and QUANTA flash CTD screen plus, for antinuclear antibody screening. Ann Lab Med. 2022;42(1):63–70. doi: 10.3343/alm.2022.42.1.63. [DOI] [PMC free article] [PubMed] [Google Scholar]
- 27.Miller TM, Johnston SC. Should the Babinski sign be part of the routine neurologic examination? Neurology. 2005;65(8):1165–1168. doi: 10.1212/01.wnl.0000180608.76190.10. [DOI] [PubMed] [Google Scholar]
- 28.Thaller M, Hughes T. Inter-rater agreement of observable and elicitable neurological signs. Clin Med (Lond) 2014;14(3):264–267. doi: 10.7861/clinmedicine.14-3-264. [DOI] [PMC free article] [PubMed] [Google Scholar]
- 29.Potnis KC, Ross JS, Aneja S, Gross CP, Richman IB. Artificial intelligence in breast cancer screening: evaluation of FDA device regulation and future recommendations. JAMA Intern Med. 2022;182(12):1306–1312. doi: 10.1001/jamainternmed.2022.4969. [DOI] [PMC free article] [PubMed] [Google Scholar]
- 30.Hu WT, Chen-Plotkin A, Arnold SE, Grossman M, Clark CM, Shaw LM, et al. Biomarker discovery for Alzheimer’s disease, frontotemporal lobar degeneration, and Parkinson’s disease. Acta Neuropathol. 2010;120(3):385–399. doi: 10.1007/s00401-010-0723-9. [DOI] [PMC free article] [PubMed] [Google Scholar]
- 31.Mielke MM, Frank RD, Dage JL, Jeromin A, Ashton NJ, Blennow K, et al. Comparison of plasma phosphorylated tau species with amyloid and tau positron emission tomography, neurodegeneration, vascular pathology, and cognitive outcomes. JAMA Neurol. 2021;78(9):1108–1117. doi: 10.1001/jamaneurol.2021.2293. [DOI] [PMC free article] [PubMed] [Google Scholar]
- 32.Clifford DB, Fagan AM, Holtzman DM, Morris JC, Teshome M, Shah AR, et al. CSF biomarkers of Alzheimer disease in HIV-associated neurologic disease. Neurology. 2009;73(23):1982–1987. doi: 10.1212/WNL.0b013e3181c5b445. [DOI] [PMC free article] [PubMed] [Google Scholar]
- 33.Ances BM, Benzinger TL, Christensen JJ, Thomas J, Venkat R, Teshome M, et al. 11C-PiB imaging of human immunodeficiency virus-associated neurocognitive disorder. Arch Neurol. 2012;69(1):72–77. doi: 10.1001/archneurol.2011.761. [DOI] [PMC free article] [PubMed] [Google Scholar]
- 34.Ozturk T, Kollhoff A, Anderson AM, Christina Howell J, Loring DW, Waldrop-Valverde D, et al. Linked CSF reduction of phosphorylated tau and IL-8 in HIV associated neurocognitive disorder. Sci Rep. 2019;9(1):8733. doi: 10.1038/s41598-019-45418-2. [DOI] [PMC free article] [PubMed] [Google Scholar]
- 35.Davis Giardina T, Menon S, Parrish DE, Sittig DF, Singh H. Patient access to medical records and healthcare outcomes: a systematic review. J Am Med Inform Assoc. 2014;21(4):737–741. doi: 10.1136/amiajnl-2013-002239. [DOI] [PMC free article] [PubMed] [Google Scholar]
- 36.Steitz BD, Sulieman L, Wright A, Rosenbloom ST. Association of immediate release of test results to patients with implications for clinical workflow. JAMA Netw Open. 2021;4(10):e2129553. doi: 10.1001/jamanetworkopen.2021.29553. [DOI] [PMC free article] [PubMed] [Google Scholar]
- 37.Mayeux R. Biomarkers: potential uses and limitations. NeuroRx. 2004;1(2):182–188. doi: 10.1602/neurorx.1.2.182. [DOI] [PMC free article] [PubMed] [Google Scholar]
- 38.Ghouneimy A, Mahfouz M. Straightforward, inexpensive and sensitive. Nat Biomed Eng. 2022;6(8):923–924. doi: 10.1038/s41551-022-00935-w. [DOI] [PubMed] [Google Scholar]
- 39.McMahon GM, Waikar SS. Biomarkers in nephrology: core curriculum 2013. Am J Kidney Dis. 2013;62(1):165–178. doi: 10.1053/j.ajkd.2012.12.022. [DOI] [PMC free article] [PubMed] [Google Scholar]
- 40.Taghdiri F, Gumus M, Algarni M, Fasano A, Tang-Wai D, Tartaglia MC. Association between cerebrospinal fluid biomarkers and age-related brain changes in patients with normal pressure hydrocephalus. Sci Rep. 2020;10(1):9106. doi: 10.1038/s41598-020-66154-y. [DOI] [PMC free article] [PubMed] [Google Scholar]
- 41.Vanninen A, Nakajima M, Miyajima M, Rauramaa T, Kokki M, Musialowicz T, et al. Elevated CSF LRG and decreased Alzheimer’s disease biomarkers in idiopathic normal pressure hydrocephalus. J Clin Med. 2021;10(5). [DOI] [PMC free article] [PubMed]
- 42.Mazzeo S, Emiliani F, Bagnoli S, Padiglioni S, Del Re LM, Giacomucci G, et al. Alzheimer’s disease CSF biomarker profiles in idiopathic normal pressure hydrocephalus. J Pers Med. 2022;12(6). [DOI] [PMC free article] [PubMed]
- 43.Graff-Radford NR. Alzheimer CSF biomarkers may be misleading in normal-pressure hydrocephalus. Neurology. 2014;83(17):1573–1575. doi: 10.1212/WNL.0000000000000916. [DOI] [PMC free article] [PubMed] [Google Scholar]
- 44.Wennberg AM, Whitwell JL, Tosakulwong N, Weigand SD, Murray ME, Machulda MM, et al. The influence of tau, amyloid, alpha-synuclein, TDP-43, and vascular pathology in clinically normal elderly individuals. Neurobiol Aging. 2019;77:26–36. doi: 10.1016/j.neurobiolaging.2019.01.008. [DOI] [PMC free article] [PubMed] [Google Scholar]
- 45.Gold BT, Brown CA, Hakun JG, Shaw LM, Trojanowski JQ, Smith CD. Clinically silent Alzheimer’s and vascular pathologies influence brain networks supporting executive function in healthy older adults. Neurobiol Aging. 2017;58:102–111. doi: 10.1016/j.neurobiolaging.2017.06.012. [DOI] [PMC free article] [PubMed] [Google Scholar]
- 46.Mattsson N, Insel P, Nosheny R, Trojanowski JQ, Shaw LM, Jack CR, Jr, et al. Effects of cerebrospinal fluid proteins on brain atrophy rates in cognitively healthy older adults. Neurobiol Aging. 2014;35(3):614–622. doi: 10.1016/j.neurobiolaging.2013.08.027. [DOI] [PMC free article] [PubMed] [Google Scholar]
- 47.Mattsson N, Insel P, Nosheny R, Zetterberg H, Trojanowski JQ, Shaw LM, et al. CSF protein biomarkers predicting longitudinal reduction of CSF beta-amyloid42 in cognitively healthy elders. Transl Psychiatry. 2013;3(8):e293. doi: 10.1038/tp.2013.69. [DOI] [PMC free article] [PubMed] [Google Scholar]
- 48.Mitchell TW, Mufson EJ, Schneider JA, Cochran EJ, Nissanov J, Han LY, et al. Parahippocampal tau pathology in healthy aging, mild cognitive impairment, and early Alzheimer’s disease. Ann Neurol. 2002;51(2):182–189. doi: 10.1002/ana.10086. [DOI] [PubMed] [Google Scholar]
- 49.Mollenhauer B, Caspell-Garcia CJ, Coffey CS, Taylor P, Shaw LM, Trojanowski JQ, et al. Longitudinal CSF biomarkers in patients with early Parkinson disease and healthy controls. Neurology. 2017;89(19):1959–1969. doi: 10.1212/WNL.0000000000004609. [DOI] [PMC free article] [PubMed] [Google Scholar]
- 50.Sperling RA, Aisen PS, Beckett LA, Bennett DA, Craft S, Fagan AM, et al. Toward defining the preclinical stages of Alzheimer’s disease: recommendations from the National Institute on Aging-Alzheimer’s Association workgroups on diagnostic guidelines for Alzheimer’s disease. Alzheimers Dement. 2011;7(3):280–292. doi: 10.1016/j.jalz.2011.03.003. [DOI] [PMC free article] [PubMed] [Google Scholar]
- 51.Dubois B, Feldman HH, Jacova C, Hampel H, Molinuevo JL, Blennow K, et al. Advancing research diagnostic criteria for Alzheimer’s disease: the IWG-2 criteria. Lancet Neurol. 2014;13(6):614–629. doi: 10.1016/S1474-4422(14)70090-0. [DOI] [PubMed] [Google Scholar]
- 52.Shaw LM, Vanderstichele H, Knapik-Czajka M, Clark CM, Aisen PS, Petersen RC, et al. Cerebrospinal fluid biomarker signature in Alzheimer’s disease neuroimaging initiative subjects. Ann Neurol. 2009;65(4):403–413. doi: 10.1002/ana.21610. [DOI] [PMC free article] [PubMed] [Google Scholar]
- 53.Hu WT, Chen-Plotkin A, Arnold SE, Grossman M, Clark CM, Shaw LM, et al. Novel CSF biomarkers for Alzheimer’s disease and mild cognitive impairment. Acta Neuropathol. 2010;119(6):669–678. doi: 10.1007/s00401-010-0667-0. [DOI] [PMC free article] [PubMed] [Google Scholar]
- 54.Hu WT, Josephs KA, Knopman DS, Boeve BF, Dickson DW, Petersen RC, et al. Temporal lobar predominance of TDP-43 neuronal cytoplasmic inclusions in Alzheimer disease. Acta Neuropathol. 2008;116(2):215–220. doi: 10.1007/s00401-008-0400-4. [DOI] [PMC free article] [PubMed] [Google Scholar]
- 55.James BD, Wilson RS, Boyle PA, Trojanowski JQ, Bennett DA, Schneider JA. TDP-43 stage, mixed pathologies, and clinical Alzheimer’s-type dementia. Brain. 2016;139(11):2983–2993. doi: 10.1093/brain/aww224. [DOI] [PMC free article] [PubMed] [Google Scholar]
- 56.de Flores R, Wisse LEM, Das SR, Xie L, McMillan CT, Trojanowski JQ, et al. Contribution of mixed pathology to medial temporal lobe atrophy in Alzheimer’s disease. Alzheimers Dement. 2020;16(6):843–852. doi: 10.1002/alz.12079. [DOI] [PMC free article] [PubMed] [Google Scholar]
- 57.Urwin H, Josephs KA, Rohrer JD, Mackenzie IR, Neumann M, Authier A, et al. FUS pathology defines the majority of tau- and TDP-43-negative frontotemporal lobar degeneration. Acta Neuropathol. 2010;120(1):33–41. doi: 10.1007/s00401-010-0698-6. [DOI] [PMC free article] [PubMed] [Google Scholar]
- 58.Koga S, Kouri N, Walton RL, Ebbert MTW, Josephs KA, Litvan I, et al. Corticobasal degeneration with TDP-43 pathology presenting with progressive supranuclear palsy syndrome: a distinct clinicopathologic subtype. Acta Neuropathol. 2018;136(3):389–404. doi: 10.1007/s00401-018-1878-z. [DOI] [PMC free article] [PubMed] [Google Scholar]
- 59.Clark CM, Schneider JA, Bedell BJ, Beach TG, Bilker WB, Mintun MA, et al. Use of florbetapir-PET for imaging beta-amyloid pathology. JAMA. 2011;305(3):275–283. doi: 10.1001/jama.2010.2008. [DOI] [PMC free article] [PubMed] [Google Scholar]
- 60.Waybright T, Avellino AM, Ellenbogen RG, Hollinger BJ, Veenstra TD, Morrison RS. Characterization of the human ventricular cerebrospinal fluid proteome obtained from hydrocephalic patients. J Proteomics. 2010;73(6):1156–1162. doi: 10.1016/j.jprot.2010.02.004. [DOI] [PubMed] [Google Scholar]
- 61.Rosler N, Wichart I, Jellinger KA. Ex vivo lumbar and post mortem ventricular cerebrospinal fluid substance P-immunoreactivity in Alzheimer’s disease patients. Neurosci Lett. 2001;299(1–2):117–120. doi: 10.1016/S0304-3940(01)01514-2. [DOI] [PubMed] [Google Scholar]
- 62.Tarnaris A, Toma AK, Chapman MD, Petzold A, Keir G, Kitchen ND, et al. Rostrocaudal dynamics of CSF biomarkers. Neurochem Res. 2011;36(3):528–532. doi: 10.1007/s11064-010-0374-1. [DOI] [PubMed] [Google Scholar]
- 63.Brandner S, Thaler C, Lewczuk P, Lelental N, Buchfelder M, Kleindienst A. Neuroprotein dynamics in the cerebrospinal fluid: intraindividual concomitant ventricular and lumbar measurements. Eur Neurol. 2013;70(3–4):189–194. doi: 10.1159/000352032. [DOI] [PubMed] [Google Scholar]
- 64.Brandner S, Thaler C, Lelental N, Buchfelder M, Kleindienst A, Maler JM, et al. Ventricular and lumbar cerebrospinal fluid concentrations of Alzheimer’s disease biomarkers in patients with normal pressure hydrocephalus and posttraumatic hydrocephalus. J Alzheimers Dis. 2014;41(4):1057–1062. doi: 10.3233/JAD-132708. [DOI] [PubMed] [Google Scholar]
- 65.Djukic M, Spreer A, Lange P, Bunkowski S, Wiltfang J, Nau R. Small cisterno-lumbar gradient of phosphorylated tau protein in geriatric patients with suspected normal pressure hydrocephalus. Fluids Barriers CNS. 2016;13(1):15. doi: 10.1186/s12987-016-0039-9. [DOI] [PMC free article] [PubMed] [Google Scholar]
- 66.Minta K, Jeppsson A, Brinkmalm G, Portelius E, Zetterberg H, Blennow K, et al. Lumbar and ventricular CSF concentrations of extracellular matrix proteins before and after shunt surgery in idiopathic normal pressure hydrocephalus. Fluids Barriers CNS. 2021;18(1):23. doi: 10.1186/s12987-021-00256-1. [DOI] [PMC free article] [PubMed] [Google Scholar]
- 67.Bateman RJ, Xiong C, Benzinger TL, Fagan AM, Goate A, Fox NC, et al. Clinical and biomarker changes in dominantly inherited Alzheimer’s disease. N Engl J Med. 2012;367(9):795–804. doi: 10.1056/NEJMoa1202753. [DOI] [PMC free article] [PubMed] [Google Scholar]
- 68.Gendron TF, Chew J, Stankowski JN, Hayes LR, Zhang YJ, Prudencio M, et al. Poly(GP) proteins are a useful pharmacodynamic marker for C9ORF72-associated amyotrophic lateral sclerosis. Sci Transl Med. 2017;9(383). [DOI] [PMC free article] [PubMed]
- 69.Gendron TF, C9ORF72 Neurofilament Study Group. Daughrity LM, Heckman MG, Diehl NN, Wuu J, et al. Phosphorylated neurofilament heavy chain: a biomarker of survival for C9ORF72-associated amyotrophic lateral sclerosis. Ann Neurol. 2017;82(1):139–146. doi: 10.1002/ana.24980. [DOI] [PMC free article] [PubMed] [Google Scholar]
- 70.Hu WT, Chen-Plotkin A, Grossman M, Arnold SE, Clark CM, Shaw LM, et al. Novel CSF biomarkers for frontotemporal lobar degenerations. Neurology. 2010;75(23):2079–2086. doi: 10.1212/WNL.0b013e318200d78d. [DOI] [PMC free article] [PubMed] [Google Scholar]
- 71.Hu WT, Watts K, Grossman M, Glass J, Lah JJ, Hales C, et al. Reduced CSF p-Tau181 to tau ratio is a biomarker for FTLD-TDP. Neurology. 2013;81(22):1945–1952. doi: 10.1212/01.wnl.0000436625.63650.27. [DOI] [PMC free article] [PubMed] [Google Scholar]
- 72.Strull WM, Lo B, Charles G. Do patients want to participate in medical decision making? JAMA. 1984;252(21):2990–2994. doi: 10.1001/jama.1984.03350210038026. [DOI] [PubMed] [Google Scholar]
- 73.Street RL, Jr, Gordon H, Haidet P. Physicians’ communication and perceptions of patients: is it how they look, how they talk, or is it just the doctor? Soc Sci Med. 2007;65(3):586–598. doi: 10.1016/j.socscimed.2007.03.036. [DOI] [PMC free article] [PubMed] [Google Scholar]
- 74.Street RL, Jr, Haidet P. How well do doctors know their patients? Factors affecting physician understanding of patients’ health beliefs. J Gen Intern Med. 2011;26(1):21–27. doi: 10.1007/s11606-010-1453-3. [DOI] [PMC free article] [PubMed] [Google Scholar]
- 75.Menendez-Gonzalez M. Routine lumbar puncture for the early diagnosis of Alzheimer’s disease. Is it safe? Front Aging Neurosci. 2014;6:65. doi: 10.3389/fnagi.2014.00065. [DOI] [PMC free article] [PubMed] [Google Scholar]
- 76.Jellinger KA, Janetzky B, Attems J, Kienzl E. Biomarkers for early diagnosis of Alzheimer disease: ‘ALZheimer ASsociated gene’–a new blood biomarker? J Cell Mol Med. 2008;12(4):1094–1117. doi: 10.1111/j.1582-4934.2008.00313.x. [DOI] [PMC free article] [PubMed] [Google Scholar]
- 77.Freudenberg JA, Bembas K, Greene MI, Zhang H. Non-invasive, ultra-sensitive, high-throughput assays to quantify rare biomarkers in the blood. Methods. 2008;46(1):33–38. doi: 10.1016/j.ymeth.2008.05.005. [DOI] [PMC free article] [PubMed] [Google Scholar]
- 78.Takeda S, Sato N, Uchio-Yamada K, Sawada K, Kunieda T, Takeuchi D, et al. Elevation of plasma beta-amyloid level by glucose loading in Alzheimer mouse models. Biochem Biophys Res Commun. 2009;385(2):193–197. doi: 10.1016/j.bbrc.2009.05.037. [DOI] [PubMed] [Google Scholar]
- 79.Laske C, Leyhe T, Stransky E, Hoffmann N, Fallgatter AJ, Dietzsch J. Identification of a blood-based biomarker panel for classification of Alzheimer’s disease. Int J Neuropsychopharmacol. 2011;14(9):1147–1155. doi: 10.1017/S1461145711000459. [DOI] [PubMed] [Google Scholar]
- 80.Meng X, Li T, Wang X, Lv X, Sun Z, Zhang J, et al. Association between increased levels of amyloid-beta oligomers in plasma and episodic memory loss in Alzheimer’s disease. Alzheimers Res Ther. 2019;11(1):89. doi: 10.1186/s13195-019-0535-7. [DOI] [PMC free article] [PubMed] [Google Scholar]
- 81.Cheng S, Banerjee S, Daiello LA, Nakashima A, Jash S, Huang Z, et al. Novel blood test for early biomarkers of preeclampsia and Alzheimer’s disease. Sci Rep. 2021;11(1):15934. doi: 10.1038/s41598-021-95611-5. [DOI] [PMC free article] [PubMed] [Google Scholar]
- 82.Sadigh G, Applegate KE, Saindane AM. Prevalence of unanticipated events associated with MRI examinations: a benchmark for MRI quality, safety, and patient experience. J Am Coll Radiol. 2017;14(6):765–772. doi: 10.1016/j.jacr.2017.01.043. [DOI] [PubMed] [Google Scholar]
- 83.Duits FH, Martinez-Lage P, Paquet C, Engelborghs S, Lleo A, Hausner L, et al. Performance and complications of lumbar puncture in memory clinics: results of the multicenter lumbar puncture feasibility study. Alzheimers Dement. 2016;12(2):154–163. doi: 10.1016/j.jalz.2015.08.003. [DOI] [PubMed] [Google Scholar]
- 84.Prakash N, Caspell-Garcia C, Coffey C, Siderowf A, Tanner CM, Kieburtz K, et al. Feasibility and safety of lumbar puncture in the Parkinson’s disease research participants: Parkinson’s Progression Marker Initiative (PPMI) Parkinsonism Relat Disord. 2019;62:201–209. doi: 10.1016/j.parkreldis.2018.12.025. [DOI] [PMC free article] [PubMed] [Google Scholar]
- 85.Howell JC, Parker MW, Watts KD, Kollhoff A, Tsvetkova DZ, Hu WT. Research lumbar punctures among African Americans and Caucasians: perception predicts experience. Front Aging Neurosci. 2016;8:296. doi: 10.3389/fnagi.2016.00296. [DOI] [PMC free article] [PubMed] [Google Scholar]
- 86.Peskind ER, Riekse R, Quinn JF, Kaye J, Clark CM, Farlow MR, et al. Safety and acceptability of the research lumbar puncture. Alzheimer Dis Assoc Disord. 2005;19(4):220–225. doi: 10.1097/01.wad.0000194014.43575.fd. [DOI] [PubMed] [Google Scholar]
- 87.Hampel H, Shaw LM, Aisen P, Chen C, Lleo A, Iwatsubo T, et al. State-of-the-art of lumbar puncture and its place in the journey of patients with Alzheimer’s disease. Alzheimers Dement. 2022;18(1):159–177. doi: 10.1002/alz.12372. [DOI] [PMC free article] [PubMed] [Google Scholar]
- 88.Russo RJ, Costa HS, Silva PD, Anderson JL, Arshad A, Biederman RW, et al. Assessing the risks associated with MRI in patients with a pacemaker or defibrillator. N Engl J Med. 2017;376(8):755–764. doi: 10.1056/NEJMoa1603265. [DOI] [PubMed] [Google Scholar]
- 89.Padmanabhan D, Kella DK, Mehta R, Kapa S, Deshmukh A, Mulpuru S, et al. Safety of magnetic resonance imaging in patients with legacy pacemakers and defibrillators and abandoned leads. Heart Rhythm. 2018;15(2):228–233. doi: 10.1016/j.hrthm.2017.10.022. [DOI] [PubMed] [Google Scholar]
- 90.Fluschnik N, Tahir E, Erley J, Mullerleile K, Metzner A, Wenzel JP, et al. 3 Tesla magnetic resonance imaging in patients with cardiac implantable electronic devices: a single centre experience. Europace. 2022. [DOI] [PMC free article] [PubMed]
- 91.Aissani S, Laistler E, Felblinger J. MR safety assessment of active implantable medical devices. Radiologe. 2019;59(Suppl 1):40–45. doi: 10.1007/s00117-019-0541-6. [DOI] [PubMed] [Google Scholar]
- 92.Diehn FE, Wood CP, Watson RE, Jr, Mauck WD, Burke MM, Hunt CH. Clinical safety of magnetic resonance imaging in patients with implanted SynchroMed EL infusion pumps. Neuroradiology. 2011;53(2):117–122. doi: 10.1007/s00234-010-0737-y. [DOI] [PubMed] [Google Scholar]
- 93.De Andres J, Villanueva V, Palmisani S, Cerda-Olmedo G, Lopez-Alarcon MD, Monsalve V, et al. The safety of magnetic resonance imaging in patients with programmable implanted intrathecal drug delivery systems: a 3-year prospective study. Anesth Analg. 2011;112(5):1124–1129. doi: 10.1213/ANE.0b013e318210d017. [DOI] [PubMed] [Google Scholar]
- 94.Reiss AL, Jo B, Arbelaez AM, Tsalikian E, Buckingham B, Weinzimer SA, et al. A Pilot randomized trial to examine effects of a hybrid closed-loop insulin delivery system on neurodevelopmental and cognitive outcomes in adolescents with type 1 diabetes. Nat Commun. 2022;13(1):4940. doi: 10.1038/s41467-022-32289-x. [DOI] [PMC free article] [PubMed] [Google Scholar]
- 95.Wheelock KM, Ross JS, Murugiah K, Lin Z, Krumholz HM, Khera R. Clinician trends in prescribing direct oral anticoagulants for US Medicare beneficiaries. JAMA Netw Open. 2021;4(12):e2137288. doi: 10.1001/jamanetworkopen.2021.37288. [DOI] [PMC free article] [PubMed] [Google Scholar]
- 96.Shiyovich A, Shalev V, Chodick G, Tirosh M, Katz A, Klar MM, et al. Shifting from vitamin K antagonists to non-vitamin K antagonist oral anticoagulants in patients with atrial fibrillation: predictors, patterns and temporal trends. BMC Cardiovasc Disord. 2021;21(1):493. doi: 10.1186/s12872-021-02295-w. [DOI] [PMC free article] [PubMed] [Google Scholar]
- 97.Span P. A brain scan may predict Alzheimer’s. Should you get one? New York Times; 2019. [Google Scholar]
- 98.Guo S, Getsios D, Hernandez L, Cho K, Lawler E, Altincatal A, et al. Florbetaben PET in the early diagnosis of Alzheimer’s disease: a discrete event simulation to explore its potential value and key data gaps. Int J Alzheimers Dis. 2012;2012:548157. doi: 10.1155/2012/548157. [DOI] [PMC free article] [PubMed] [Google Scholar]
- 99.Hornberger J, Bae J, Watson I, Johnston J, Happich M. Clinical and cost implications of amyloid beta detection with amyloid beta positron emission tomography imaging in early Alzheimer’s disease - the case of florbetapir. Curr Med Res Opin. 2017;33(4):675–685. doi: 10.1080/03007995.2016.1277197. [DOI] [PubMed] [Google Scholar]
- 100.Hornberger J, Michalopoulos S, Dai M, Andrade P, Dilla T, Happich M. Cost-effectiveness of florbetapir-PET in Alzheimer’s disease: a Spanish societal perspective. J Ment Health Policy Econ. 2015;18(2):63–73. [PubMed] [Google Scholar]
- 101.Lee YS, Youn H, Jeong HG, Lee TJ, Han JW, Park JH, et al. Cost-effectiveness of using amyloid positron emission tomography in individuals with mild cognitive impairment. Cost Eff Resour Alloc. 2021;19(1):50. doi: 10.1186/s12962-021-00300-9. [DOI] [PMC free article] [PubMed] [Google Scholar]
- 102.Albert MS, DeKosky ST, Dickson D, Dubois B, Feldman HH, Fox NC, et al. The diagnosis of mild cognitive impairment due to Alzheimer’s disease: recommendations from the National Institute on Aging-Alzheimer’s Association workgroups on diagnostic guidelines for Alzheimer’s disease. Alzheimers Dement. 2011;7(3):270–279. doi: 10.1016/j.jalz.2011.03.008. [DOI] [PMC free article] [PubMed] [Google Scholar]
- 103.McKhann GM, Knopman DS, Chertkow H, Hyman BT, Jack CR, Jr, Kawas CH, et al. The diagnosis of dementia due to Alzheimer’s disease: recommendations from the National Institute on Aging-Alzheimer’s Association workgroups on diagnostic guidelines for Alzheimer’s disease. Alzheimers Dement. 2011;7(3):263–269. doi: 10.1016/j.jalz.2011.03.005. [DOI] [PMC free article] [PubMed] [Google Scholar]
- 104.Howell JC, Watts KD, Parker MW, Wu J, Kollhoff A, Wingo TS, et al. Race modifies the relationship between cognition and Alzheimer’s disease cerebrospinal fluid biomarkers. Alzheimers Res Ther. 2017;9(1):88. doi: 10.1186/s13195-017-0315-1. [DOI] [PMC free article] [PubMed] [Google Scholar]
- 105.Morris JC, Schindler SE, McCue LM, Moulder KL, Benzinger TLS, Cruchaga C, et al. Assessment of racial disparities in biomarkers for Alzheimer disease. JAMA Neurol. 2019;76(3):264–273. doi: 10.1001/jamaneurol.2018.4249. [DOI] [PMC free article] [PubMed] [Google Scholar]
- 106.Wharton W, Kollhoff AL, Gangishetti U, Verble DD, Upadhya S, Zetterberg H, et al. Interleukin 9 alterations linked to alzheimer disease in african americans. Ann Neurol. 2019;86(3):407–418. doi: 10.1002/ana.25543. [DOI] [PMC free article] [PubMed] [Google Scholar]
- 107.Misiura MB, Howell JC, Wu J, Qiu D, Parker MW, Turner JA, et al. Race modifies default mode connectivity in Alzheimer’s disease. Transl Neurodegener. 2020;9:8. doi: 10.1186/s40035-020-0186-4. [DOI] [PMC free article] [PubMed] [Google Scholar]
- 108.McGregor J. Racial, ethnic, and tribal classifications in biomedical research with biological and group harm. Am J Bioeth. 2010;10(9):23–24. doi: 10.1080/15265161.2010.492888. [DOI] [PubMed] [Google Scholar]
- 109.Fullerton SM, Lee SS. Secondary uses and the governance of de-identified data: lessons from the human genome diversity panel. BMC Med Ethics. 2011;12:16. doi: 10.1186/1472-6939-12-16. [DOI] [PMC free article] [PubMed] [Google Scholar]
- 110.ASHG denounces attempts to link genetics and racial supremacy. Am J Hum Genet. 2018;103(5):636. [DOI] [PMC free article] [PubMed]
- 111.Hu H, Meng L, Bi YL, Zhang W, Xu W, Shen XN, et al. Tau pathologies mediate the association of blood pressure with cognitive impairment in adults without dementia: the CABLE study. Alzheimers Dement. 2022;18(1):53–64. doi: 10.1002/alz.12377. [DOI] [PubMed] [Google Scholar]
- 112.Hou XH, Xu W, Bi YL, Shen XN, Ma YH, Dong Q, et al. Associations of healthy lifestyles with cerebrospinal fluid biomarkers of Alzheimer’s disease pathology in cognitively intact older adults: the CABLE study. Alzheimers Res Ther. 2021;13(1):81. doi: 10.1186/s13195-021-00822-7. [DOI] [PMC free article] [PubMed] [Google Scholar]
- 113.Babapour Mofrad R, Tijms BM, Scheltens P, Barkhof F, van der Flier WM, Sikkes SAM, et al. Sex differences in CSF biomarkers vary by Alzheimer disease stage and APOE epsilon4 genotype. Neurology. 2020;95(17):e2378–e2388. doi: 10.1212/WNL.0000000000010629. [DOI] [PubMed] [Google Scholar]
- 114.Saunders TS, Jenkins N, Blennow K, Ritchie C, Muniz-Terrera G. Interactions between apolipoprotein E, sex, and amyloid-beta on cerebrospinal fluid p-tau levels in the European prevention of Alzheimer’s dementia longitudinal cohort study (EPAD LCS) EBioMedicine. 2022;83:104241. doi: 10.1016/j.ebiom.2022.104241. [DOI] [PMC free article] [PubMed] [Google Scholar]
- 115.Hu WT. Reporting and social construction of race in Alzheimer’s disease clinical trials. Alzheimers Dement. 2022;18(4):865–866. doi: 10.1002/alz.12609. [DOI] [PMC free article] [PubMed] [Google Scholar]
- 116.Sankar PL, Parker LS. The Precision Medicine Initiative’s All of Us Research Program: an agenda for research on its ethical, legal, and social issues. Genet Med. 2017;19(7):743–750. doi: 10.1038/gim.2016.183. [DOI] [PubMed] [Google Scholar]
- 117.Corporation R. Health Care Access 2004. Available from: https://www.rand.org/topics/healthcare-access.html. Accessed 11 Nov 2022.
- 118.Gulliford M, Figueroa-Munoz J, Morgan M, Hughes D, Gibson B, Beech R, et al. What does ‘access to health care’ mean? J Health Serv Res Policy. 2002;7(3):186–188. doi: 10.1258/135581902760082517. [DOI] [PubMed] [Google Scholar]
- 119.Quality AfHRa. Access to care. Available from: https://www.ahrq.gov/topics/access-care.html. Accessed 3 Dec 2022.
- 120.Mattke S, Hanson M. Expected wait times for access to a disease-modifying Alzheimer’s treatment in the United States. Alzheimers Dement. 2022;18(5):1071–1074. doi: 10.1002/alz.12470. [DOI] [PubMed] [Google Scholar]
- 121.Knopman DS, DeKosky ST, Cummings JL, Chui H, Corey-Bloom J, Relkin N, et al. Practice parameter: diagnosis of dementia (an evidence-based review). Report of the Quality Standards Subcommittee of the American Academy of Neurology. Neurology. 2001;56(9):1143–1153. doi: 10.1212/WNL.56.9.1143. [DOI] [PubMed] [Google Scholar]
- 122.Liu CC, Liu CH, Sun Y, Lee HJ, Tang LY, Chiu MJ. Rural-urban disparities in the prevalence of mild cognitive impairment and dementia in Taiwan: a door-to-door nationwide study. J Epidemiol. 2022;32(11):502–509. doi: 10.2188/jea.JE20200602. [DOI] [PMC free article] [PubMed] [Google Scholar]
- 123.Lopez Ricardo Y, Reyes Zamora MC, Perodin Hernandez J, Rodriguez MC. Prevalence of Alzheimer’s disease in rural and urban areas in Cuba and factors influencing on its occurrence: epidemiological cross-sectional protocol. BMJ Open. 2022;12(11):e052704. doi: 10.1136/bmjopen-2021-052704. [DOI] [PMC free article] [PubMed] [Google Scholar]
- 124.Rahman M, White EM, Mills C, Thomas KS, Jutkowitz E. Rural-urban differences in diagnostic incidence and prevalence of Alzheimer’s disease and related dementias. Alzheimers Dement. 2021;17(7):1213–1230. doi: 10.1002/alz.12285. [DOI] [PMC free article] [PubMed] [Google Scholar]
- 125.Abner EL, Jicha GA, Christian WJ, Schreurs BG. Rural-urban differences in Alzheimer’s disease and related disorders diagnostic prevalence in Kentucky and West Virginia. J Rural Health. 2016;32(3):314–320. doi: 10.1111/jrh.12155. [DOI] [PMC free article] [PubMed] [Google Scholar]
- 126.Xu WY, Jung J, Retchin SM, Li Y, Roy S. Rural-urban disparities in diagnosis of early-onset dementia. JAMA Netw Open. 2022;5(8):e2225805. doi: 10.1001/jamanetworkopen.2022.25805. [DOI] [PMC free article] [PubMed] [Google Scholar]
- 127.Rhew SH, Jacklin K, Bright P, McCarty C, Henning-Smith C, Warry W. Rural health disparities in health care utilization for dementia in Minnesota. J Rural Health. 2022. [DOI] [PubMed]
- 128.O'Hanlon CE, Kranz AM, DeYoreo M, Mahmud A, Damberg CL, Timbie J. Access, quality, and financial performance of rural hospitals following health system affiliation. Health Aff (Millwood) 2019;38(12):2095–2104. doi: 10.1377/hlthaff.2019.00918. [DOI] [PMC free article] [PubMed] [Google Scholar]
- 129.Khaliq AA, Nsiah E, Bilal NH, Hughes DR, Duszak R., Jr The scope and distribution of imaging services at critical access hospitals. J Am Coll Radiol. 2014;11(9):857–862. doi: 10.1016/j.jacr.2014.02.013. [DOI] [PubMed] [Google Scholar]
- 130.Mukendi D, Kalo JL, Kayembe T, Lutumba P, Barbe B, Gillet P, et al. Where there is no brain imaging: safety and diagnostic value of lumbar puncture in patients with neurological disorders in a rural hospital of Central Africa. J Neurol Sci. 2018;393:72–79. doi: 10.1016/j.jns.2018.08.004. [DOI] [PubMed] [Google Scholar]
- 131.Vecchio AC, Williams DW, Xu Y, Yu D, Saylor D, Lofgren S, et al. Sex-specific associations between cerebrospinal fluid inflammatory marker levels and cognitive function in antiretroviral treated people living with HIV in rural Uganda. Brain Behav Immun. 2021;93:111–118. doi: 10.1016/j.bbi.2020.12.021. [DOI] [PMC free article] [PubMed] [Google Scholar]
- 132.Joshi R, Mishra PK, Joshi D, Santhosh SR, Parida MM, Desikan P, et al. Clinical presentation, etiology, and survival in adult acute encephalitis syndrome in rural Central India. Clin Neurol Neurosurg. 2013;115(9):1753–1761. doi: 10.1016/j.clineuro.2013.04.008. [DOI] [PMC free article] [PubMed] [Google Scholar]
- 133.Sall O, Thulin Hedberg S, Neander M, Tiwari S, Dornon L, Bom R, et al. Etiology of central nervous system infections in a rural area of Nepal using molecular approaches. Am J Trop Med Hyg. 2019;101(1):253–259. doi: 10.4269/ajtmh.18-0434. [DOI] [PMC free article] [PubMed] [Google Scholar]
- 134.Waymack JR, Markwell S, Milbrandt JC, Clark TR. Comparison of rates of emergency department procedures and critical diagnoses in metropolitan and rural hospitals. Rural Remote Health. 2015;15(4):3298. [PubMed] [Google Scholar]
- 135.Wu X, Kalra VB, Forman HP, Malhotra A. Cost-effectiveness analysis of CTA and LP for evaluation of suspected SAH after negative non-contrast CT. Clin Neurol Neurosurg. 2016;142:104–111. doi: 10.1016/j.clineuro.2015.12.021. [DOI] [PubMed] [Google Scholar]
- 136.Kozikowski BA, Burt TM, Tirey DA, Williams LE, Kuzmak BR, Stanton DT, et al. The effect of freeze/thaw cycles on the stability of compounds in DMSO. J Biomol Screen. 2003;8(2):210–215. doi: 10.1177/1087057103252618. [DOI] [PubMed] [Google Scholar]
- 137.Francis CA, Hector MP, Proctor GB. Precipitation of specific proteins by freeze-thawing of human saliva. Arch Oral Biol. 2000;45(7):601–606. doi: 10.1016/S0003-9969(00)00026-1. [DOI] [PubMed] [Google Scholar]
- 138.Chen F, Ye J, Chio C, Liu W, Shi J, Qin W. A simplified quick microbial genomic DNA extraction via freeze-thawing cycles. Mol Biol Rep. 2020;47(1):703–709. doi: 10.1007/s11033-019-05176-w. [DOI] [PubMed] [Google Scholar]
- 139.Falk RT, Rossi SC, Fears TR, Sepkovic DW, Migella A, Adlercreutz H, et al. A new ELISA kit for measuring urinary 2-hydroxyestrone, 16alpha-hydroxyestrone, and their ratio: reproducibility, validity, and assay performance after freeze-thaw cycling and preservation by boric acid. Cancer Epidemiol Biomarkers Prev. 2000;9(1):81–87. [PubMed] [Google Scholar]
- 140.Ellington AA, Kullo IJ, Bailey KR, Klee GG. Measurement and quality control issues in multiplex protein assays: a case study. Clin Chem. 2009;55(6):1092–1099. doi: 10.1373/clinchem.2008.120717. [DOI] [PMC free article] [PubMed] [Google Scholar]
- 141.Schoonenboom NS, Mulder C, Vanderstichele H, Van Elk EJ, Kok A, Van Kamp GJ, et al. Effects of processing and storage conditions on amyloid beta (1–42) and tau concentrations in cerebrospinal fluid: implications for use in clinical practice. Clin Chem. 2005;51(1):189–195. doi: 10.1373/clinchem.2004.039735. [DOI] [PubMed] [Google Scholar]
- 142.Piguet O, Petersen A, Yin Ka Lam B, Gabery S, Murphy K, Hodges JR, et al. Eating and hypothalamus changes in behavioral-variant frontotemporal dementia. Ann Neurol. 2011;69(2):312–319. doi: 10.1002/ana.22244. [DOI] [PMC free article] [PubMed] [Google Scholar]
- 143.Hu WT, Howell JC, Ozturk T, Gangishetti U, Kollhoff AL, Hatcher-Martin JM, et al. CSF cytokines in aging, multiple sclerosis, and dementia. Front Immunol. 2019;10:480. doi: 10.3389/fimmu.2019.00480. [DOI] [PMC free article] [PubMed] [Google Scholar]
- 144.Hu WT, Ozturk T, Kollhoff A, Wharton W, Christina Howell J. Alzheimer’s disease neuroimaging I. Higher CSF sTNFR1-related proteins associate with better prognosis in very early Alzheimer’s disease. Nat Commun. 2021;12(1):4001. doi: 10.1038/s41467-021-24220-7. [DOI] [PMC free article] [PubMed] [Google Scholar]
- 145.Niedzwiecki MM, Walker DI, Howell JC, Watts KD, Jones DP, Miller GW, et al. High-resolution metabolomic profiling of Alzheimer’s disease in plasma. Ann Clin Transl Neurol. 2020;7(1):36–45. doi: 10.1002/acn3.50956. [DOI] [PMC free article] [PubMed] [Google Scholar]
- 146.Klener J, Hofbauerova K, Bartos A, Ricny J, Ripova D, Kopecky V. Instability of cerebrospinal fluid after delayed storage and repeated freezing: a holistic study by drop coating deposition Raman spectroscopy. Clin Chem Lab Med. 2014;52(5):657–664. doi: 10.1515/cclm-2013-0800. [DOI] [PubMed] [Google Scholar]
- 147.Fraser S, Fleener C, Ogborne K, Soderstrom C. When close is not close enough: a comparison of endogenous and recombinant biomarker stability samples. Bioanalysis. 2015;7(11). [DOI] [PubMed]
- 148.Verberk IMW, Misdorp EO, Koelewijn J, Ball AJ, Blennow K, Dage JL, et al. Characterization of pre-analytical sample handling effects on a panel of Alzheimer’s disease-related blood-based biomarkers: results from the Standardization of Alzheimer’s Blood Biomarkers (SABB) working group. Alzheimers Dement. 2022;18(8):1484–1497. doi: 10.1002/alz.12510. [DOI] [PMC free article] [PubMed] [Google Scholar]
- 149.Gervaise-Henry C, Watfa G, Albuisson E, Kolodziej A, Dousset B, Olivier JL, et al. Cerebrospinal fluid Abeta42/Abeta40 as a means to limiting tube- and storage-dependent pre-analytical variability in clinical setting. J Alzheimers Dis. 2017;57(2):437–445. doi: 10.3233/JAD-160865. [DOI] [PubMed] [Google Scholar]
- 150.Liu HC, Chiu MJ, Lin CH, Yang SY. Stability of plasma amyloid-beta 1–40, amyloid-beta 1–42, and total tau protein over repeated freeze/thaw cycles. Dement Geriatr Cogn Dis Extra. 2020;10(1):46–55. doi: 10.1159/000506278. [DOI] [PMC free article] [PubMed] [Google Scholar]
- 151.Ashton NJ, Suarez-Calvet M, Karikari TK, Lantero-Rodriguez J, Snellman A, Sauer M, et al. Effects of pre-analytical procedures on blood biomarkers for Alzheimer’s pathophysiology, glial activation, and neurodegeneration. Alzheimers Dement (Amst) 2021;13(1):e12168. doi: 10.1002/dad2.12168. [DOI] [PMC free article] [PubMed] [Google Scholar]
- 152.Keshavan A, Heslegrave A, Zetterberg H, Schott JM. Stability of blood-based biomarkers of Alzheimer’s disease over multiple freeze-thaw cycles. Alzheimers Dement (Amst) 2018;10:448–451. doi: 10.1016/j.dadm.2018.06.001. [DOI] [PMC free article] [PubMed] [Google Scholar]
- 153.Diaz-Ortiz ME, Seo Y, Posavi M, Carceles Cordon M, Clark E, Jain N, et al. GPNMB confers risk for Parkinson’s disease through interaction with alpha-synuclein. Science. 2022;377(6608):eabk0637. doi: 10.1126/science.abk0637. [DOI] [PMC free article] [PubMed] [Google Scholar]
- 154.Abdi IY, Majbour NK, Willemse EAJ, van de Berg WDJ, Mollenhauer B, Teunissen CE, et al. Preanalytical stability of CSF total and oligomeric alpha-synuclein. Front Aging Neurosci. 2021;13:638718. doi: 10.3389/fnagi.2021.638718. [DOI] [PMC free article] [PubMed] [Google Scholar]
- 155.Numis AL, Fox CH, Lowenstein DJ, Norris PJ, Di Germanio C. Comparison of multiplex cytokine assays in a pediatric cohort with epilepsy. Heliyon. 2021;7(3):e06445. doi: 10.1016/j.heliyon.2021.e06445. [DOI] [PMC free article] [PubMed] [Google Scholar]
- 156.Ishigami J, Karger AB, Lutsey PL, Coresh J, Matsushita K. Stability of serum bone-mineral, kidney, and cardiac biomarkers after a freeze-thaw cycle: the ARIC study. Am J Epidemiol. 2022;191(3):534–537. doi: 10.1093/aje/kwab251. [DOI] [PMC free article] [PubMed] [Google Scholar]
- 157.Haijes HA, Willemse EAJ, Gerrits J, van der Flier WM, Teunissen CE, Verhoeven-Duif NM, et al. Assessing the pre-analytical stability of small-molecule metabolites in cerebrospinal fluid using direct-infusion metabolomics. Metabolites. 2019;9(10). [DOI] [PMC free article] [PubMed]
- 158.Schwieler L, Trepci A, Krzyzanowski S, Hermansson S, Granqvist M, Piehl F, et al. A novel, robust method for quantification of multiple kynurenine pathway metabolites in the cerebrospinal fluid. Bioanalysis. 2020;12(6):379–392. doi: 10.4155/bio-2019-0303. [DOI] [PMC free article] [PubMed] [Google Scholar]
- 159.Hu WT, Watts KD, Shaw LM, Howell JC, Trojanowski JQ, Basra S, et al. CSF beta-amyloid 1–42 - what are we measuring in Alzheimer’s disease? Ann Clin Transl Neurol. 2015;2(2):131–139. doi: 10.1002/acn3.160. [DOI] [PMC free article] [PubMed] [Google Scholar]
- 160.Gejl AK, Enevold C, Bugge A, Andersen MS, Nielsen CH, Andersen LB. Associations between serum and plasma brain-derived neurotrophic factor and influence of storage time and centrifugation strategy. Sci Rep. 2019;9(1):9655. doi: 10.1038/s41598-019-45976-5. [DOI] [PMC free article] [PubMed] [Google Scholar]
- 161.Wessels JM, Agarwal RK, Somani A, Verschoor CP, Agarwal SK, Foster WG. Factors affecting stability of plasma brain-derived neurotrophic factor. Sci Rep. 2020;10(1):20232. doi: 10.1038/s41598-020-77046-6. [DOI] [PMC free article] [PubMed] [Google Scholar]
- 162.Mohamed M, Skolasky RL, Zhou Y, Ye W, Brasic JR, Brown A, et al. Beta-amyloid (Abeta) uptake by PET imaging in older HIV+ and HIV- individuals. J Neurovirol. 2020;26(3):382–390. doi: 10.1007/s13365-020-00836-1. [DOI] [PubMed] [Google Scholar]
- 163.Stroffolini G, Guastamacchia G, Audagnotto S, Atzori C, Trunfio M, Nigra M, et al. Low cerebrospinal fluid amyloid-betaeta 1–42 in patients with tuberculous meningitis. BMC Neurol. 2021;21(1):449. doi: 10.1186/s12883-021-02468-2. [DOI] [PMC free article] [PubMed] [Google Scholar]
- 164.Verma S, Perry K, Razdan R, Howell JC, Dawson AL, Hu WT. CSF IL-8 associated with response to gene therapy in a case series of spinal muscular atrophy. Neurotherapeutics. 2022;1–9. [DOI] [PMC free article] [PubMed]
- 165.Campbell MC, Jackson JJ, Koller JM, Snyder AZ, Kotzbauer PT, Perlmutter JS. Proteinopathy and longitudinal changes in functional connectivity networks in Parkinson disease. Neurology. 2020;94(7):e718–e728. doi: 10.1212/WNL.0000000000008677. [DOI] [PMC free article] [PubMed] [Google Scholar]
- 166.Campbell MC, Koller JM, Snyder AZ, Buddhala C, Kotzbauer PT, Perlmutter JS. CSF proteins and resting-state functional connectivity in Parkinson disease. Neurology. 2015;84(24):2413–2421. doi: 10.1212/WNL.0000000000001681. [DOI] [PMC free article] [PubMed] [Google Scholar]
- 167.Zhou J, Greicius MD, Gennatas ED, Growdon ME, Jang JY, Rabinovici GD, et al. Divergent network connectivity changes in behavioural variant frontotemporal dementia and Alzheimer’s disease. Brain. 2010;133(Pt 5):1352–1367. doi: 10.1093/brain/awq075. [DOI] [PMC free article] [PubMed] [Google Scholar]
- 168.Greenberg BD, Pettigrew C, Soldan A, Wang J, Wang MC, Darrow JA, et al. CSF Alzheimer disease biomarkers: time-varying relationships with MCI symptom onset and associations with age, sex, and ApoE4. Neurology. 2022;99(15):e1640–e1650. doi: 10.1212/WNL.0000000000200953. [DOI] [PMC free article] [PubMed] [Google Scholar]
- 169.Blomberg M, Jensen M, Basun H, Lannfelt L, Wahlund LO. Cerebrospinal fluid tau levels increase with age in healthy individuals. Dement Geriatr Cogn Disord. 2001;12(2):127–132. doi: 10.1159/000051246. [DOI] [PubMed] [Google Scholar]
- 170.Lleo A, Alcolea D, Martinez-Lage P, Scheltens P, Parnetti L, Poirier J, et al. Longitudinal cerebrospinal fluid biomarker trajectories along the Alzheimer’s disease continuum in the BIOMARKAPD study. Alzheimers Dement. 2019;15(6):742–753. doi: 10.1016/j.jalz.2019.01.015. [DOI] [PubMed] [Google Scholar]
- 171.de Leon MJ, Pirraglia E, Osorio RS, Glodzik L, Saint-Louis L, Kim HJ, et al. The nonlinear relationship between cerebrospinal fluid Abeta42 and tau in preclinical Alzheimer’s disease. PLoS ONE. 2018;13(2):e0191240. doi: 10.1371/journal.pone.0191240. [DOI] [PMC free article] [PubMed] [Google Scholar]
- 172.Kunkle BW, Grenier-Boley B, Sims R, Bis JC, Damotte V, Naj AC, et al. Genetic meta-analysis of diagnosed Alzheimer’s disease identifies new risk loci and implicates Abeta, tau, immunity and lipid processing. Nat Genet. 2019;51(3):414–430. doi: 10.1038/s41588-019-0358-2. [DOI] [PMC free article] [PubMed] [Google Scholar]
- 173.de Rojas I, Moreno-Grau S, Tesi N, Grenier-Boley B, Andrade V, Jansen IE, et al. Common variants in Alzheimer’s disease and risk stratification by polygenic risk scores. Nat Commun. 2021;12(1):3417. doi: 10.1038/s41467-021-22491-8. [DOI] [PMC free article] [PubMed] [Google Scholar]
- 174.Sariya S, Felsky D, Reyes-Dumeyer D, Lali R, Lantigua RA, Vardarajan B, et al. Polygenic risk score for Alzheimer’s disease in Caribbean Hispanics. Ann Neurol. 2021;90(3):366–376. doi: 10.1002/ana.26131. [DOI] [PMC free article] [PubMed] [Google Scholar]
- 175.Zhou X, Chen Y, Ip FCF, Lai NCH, Li YYT, Jiang Y, et al. Genetic and polygenic risk score analysis for Alzheimer’s disease in the Chinese population. Alzheimers Dement (Amst) 2020;12(1):e12074. doi: 10.1002/dad2.12074. [DOI] [PMC free article] [PubMed] [Google Scholar]
- 176.Lachno DR, Evert BA, Vanderstichele H, Robertson M, Demattos RB, Konrad RJ, et al. Validation of assays for measurement of amyloid-beta peptides in cerebrospinal fluid and plasma specimens from patients with Alzheimer’s disease treated with solanezumab. J Alzheimers Dis. 2013;34(4):897–910. doi: 10.3233/JAD-122317. [DOI] [PubMed] [Google Scholar]
- 177.Blennow K, Zetterberg H, Rinne JO, Salloway S, Wei J, Black R, et al. Effect of immunotherapy with bapineuzumab on cerebrospinal fluid biomarker levels in patients with mild to moderate Alzheimer disease. Arch Neurol. 2012;69(8):1002–1010. doi: 10.1001/archneurol.2012.90. [DOI] [PubMed] [Google Scholar]
- 178.Farlow M, Arnold SE, van Dyck CH, Aisen PS, Snider BJ, Porsteinsson AP, et al. Safety and biomarker effects of solanezumab in patients with Alzheimer’s disease. Alzheimers Dement. 2012;8(4):261–271. doi: 10.1016/j.jalz.2011.09.224. [DOI] [PubMed] [Google Scholar]
- 179.Kennedy ME, Stamford AW, Chen X, Cox K, Cumming JN, Dockendorf MF, et al. The BACE1 inhibitor verubecestat (MK-8931) reduces CNS beta-amyloid in animal models and in Alzheimer’s disease patients. Sci Transl Med. 2016;8(363):363ra150. doi: 10.1126/scitranslmed.aad9704. [DOI] [PubMed] [Google Scholar]
- 180.Egan MF, Kost J, Tariot PN, Aisen PS, Cummings JL, Vellas B, et al. Randomized trial of verubecestat for mild-to-moderate Alzheimer’s disease. N Engl J Med. 2018;378(18):1691–1703. doi: 10.1056/NEJMoa1706441. [DOI] [PMC free article] [PubMed] [Google Scholar]
- 181.Budd Haeberlein S, Aisen PS, Barkhof F, Chalkias S, Chen T, Cohen S, et al. Two randomized phase 3 studies of aducanumab in early Alzheimer’s disease. J Prev Alzheimers Dis. 2022;9(2):197–210. doi: 10.14283/jpad.2022.30. [DOI] [PubMed] [Google Scholar]
- 182.Swanson CJ, Zhang Y, Dhadda S, Wang J, Kaplow J, Lai RYK, et al. A randomized, double-blind, phase 2b proof-of-concept clinical trial in early Alzheimer’s disease with lecanemab, an anti-Abeta protofibril antibody. Alzheimers Res Ther. 2021;13(1):80. doi: 10.1186/s13195-021-00813-8. [DOI] [PMC free article] [PubMed] [Google Scholar]
- 183.van Dyck CH, Swanson CJ, Aisen P, Bateman RJ, Chen C, Gee M, et al. Lecanemab in early Alzheimer’s disease. N Engl J Med. 2022. [DOI] [PubMed]
- 184.Hu WT, Watts KD, Tailor P, Nguyen TP, Howell JC, Lee RC, et al. CSF complement 3 and factor H are staging biomarkers in Alzheimer’s disease. Acta Neuropathol Commun. 2016;4:14. doi: 10.1186/s40478-016-0277-8. [DOI] [PMC free article] [PubMed] [Google Scholar]
- 185.Pillai JA, Khrestian M, Bena J, Leverenz JB, Bekris LM. Temporal ordering of inflammatory analytes sTNFR2 and sTREM2 in relation to Alzheimer’s disease biomarkers and clinical outcomes. Front Aging Neurosci. 2021;13:676744. doi: 10.3389/fnagi.2021.676744. [DOI] [PMC free article] [PubMed] [Google Scholar]
- 186.Morenas-Rodriguez E, Li Y, Nuscher B, Franzmeier N, Xiong C, Suarez-Calvet M, et al. Soluble TREM2 in CSF and its association with other biomarkers and cognition in autosomal-dominant Alzheimer’s disease: a longitudinal observational study. Lancet Neurol. 2022;21(4):329–341. doi: 10.1016/S1474-4422(22)00027-8. [DOI] [PMC free article] [PubMed] [Google Scholar]
- 187.Ewers M, Franzmeier N, Suarez-Calvet M, Morenas-Rodriguez E, Caballero MAA, Kleinberger G, et al. Increased soluble TREM2 in cerebrospinal fluid is associated with reduced cognitive and clinical decline in Alzheimer’s disease. Sci Transl Med. 2019;11(507). [DOI] [PMC free article] [PubMed]
- 188.Suarez-Calvet M, Capell A, Araque Caballero MA, Morenas-Rodriguez E, Fellerer K, Franzmeier N, et al. CSF progranulin increases in the course of Alzheimer’s disease and is associated with sTREM2, neurodegeneration and cognitive decline. EMBO Mol Med. 2018;10(12). [DOI] [PMC free article] [PubMed]
- 189.Hu WT, Holtzman DM, Fagan AM, Shaw LM, Perrin R, Arnold SE, et al. Plasma multianalyte profiling in mild cognitive impairment and Alzheimer disease. Neurology. 2012;79(9):897–905. doi: 10.1212/WNL.0b013e318266fa70. [DOI] [PMC free article] [PubMed] [Google Scholar]
- 190.Leung YY, Toledo JB, Nefedov A, Polikar R, Raghavan N, Xie SX, et al. Identifying amyloid pathology-related cerebrospinal fluid biomarkers for Alzheimer’s disease in a multicohort study. Alzheimers Dement (Amst) 2015;1(3):339–348. doi: 10.1016/j.dadm.2015.06.008. [DOI] [PMC free article] [PubMed] [Google Scholar]
- 191.Harari O, Cruchaga C, Kauwe JS, Ainscough BJ, Bales K, Pickering EH, et al. Phosphorylated tau-Abeta42 ratio as a continuous trait for biomarker discovery for early-stage Alzheimer’s disease in multiplex immunoassay panels of cerebrospinal fluid. Biol Psychiatry. 2014;75(9):723–731. doi: 10.1016/j.biopsych.2013.11.032. [DOI] [PMC free article] [PubMed] [Google Scholar]
- 192.Visser PJ, Reus LM, Gobom J, Jansen I, Dicks E, van der Lee SJ, et al. Cerebrospinal fluid tau levels are associated with abnormal neuronal plasticity markers in Alzheimer’s disease. Mol Neurodegener. 2022;17(1):27. doi: 10.1186/s13024-022-00521-3. [DOI] [PMC free article] [PubMed] [Google Scholar]
- 193.Fardo DW, Katsumata Y, Kauwe JSK, Deming Y, Harari O, Cruchaga C, et al. CSF protein changes associated with hippocampal sclerosis risk gene variants highlight impact of GRN/PGRN. Exp Gerontol. 2017;90:83–89. doi: 10.1016/j.exger.2017.01.025. [DOI] [PMC free article] [PubMed] [Google Scholar]
- 194.Pillai JA, Maxwell S, Bena J, Bekris LM, Rao SM, Chance M, et al. Key inflammatory pathway activations in the MCI stage of Alzheimer’s disease. Ann Clin Transl Neurol. 2019;6(7):1248–1262. doi: 10.1002/acn3.50827. [DOI] [PMC free article] [PubMed] [Google Scholar]
- 195.Guo LH, Alexopoulos P, Perneczky R. Heart-type fatty acid binding protein and vascular endothelial growth factor: cerebrospinal fluid biomarker candidates for Alzheimer’s disease. Eur Arch Psychiatry Clin Neurosci. 2013;263(7):553–560. doi: 10.1007/s00406-013-0405-4. [DOI] [PubMed] [Google Scholar]
- 196.Khan W, Aguilar C, Kiddle SJ, Doyle O, Thambisetty M, Muehlboeck S, et al. A subset of cerebrospinal fluid proteins from a multi-analyte panel associated with brain atrophy, disease classification and prediction in Alzheimer’s disease. PLoS ONE. 2015;10(8):e0134368. doi: 10.1371/journal.pone.0134368. [DOI] [PMC free article] [PubMed] [Google Scholar]
- 197.Paterson RW, Bartlett JW, Blennow K, Fox NC, Alzheimer’s Disease Neuroimaging Initiative. Shaw LM, et al. Cerebrospinal fluid markers including trefoil factor 3 are associated with neurodegeneration in amyloid-positive individuals. Transl Psychiatry. 2014;4(7):e419. doi: 10.1038/tp.2014.58. [DOI] [PMC free article] [PubMed] [Google Scholar]
- 198.Tijms BM, Gobom J, Reus L, Jansen I, Hong S, Dobricic V, et al. Pathophysiological subtypes of Alzheimer’s disease based on cerebrospinal fluid proteomics. Brain. 2020;143(12):3776–3792. doi: 10.1093/brain/awaa325. [DOI] [PMC free article] [PubMed] [Google Scholar]
- 199.Meyer PF, Savard M, Poirier J, Labonte A, Rosa-Neto P, Weitz TM, et al. Bi-directional association of cerebrospinal fluid immune markers with stage of Alzheimer’s disease pathogenesis. J Alzheimers Dis. 2018;63(2):577–590. doi: 10.3233/JAD-170887. [DOI] [PMC free article] [PubMed] [Google Scholar]
- 200.Kauwe JS, Bailey MH, Ridge PG, Perry R, Wadsworth ME, Hoyt KL, et al. Genome-wide association study of CSF levels of 59 Alzheimer’s disease candidate proteins: significant associations with proteins involved in amyloid processing and inflammation. PLoS Genet. 2014;10(10):e1004758. doi: 10.1371/journal.pgen.1004758. [DOI] [PMC free article] [PubMed] [Google Scholar]
- 201.Cruchaga C, Kauwe JS, Nowotny P, Bales K, Pickering EH, Mayo K, et al. Cerebrospinal fluid APOE levels: an endophenotype for genetic studies for Alzheimer’s disease. Hum Mol Genet. 2012;21(20):4558–4571. doi: 10.1093/hmg/dds296. [DOI] [PMC free article] [PubMed] [Google Scholar]
- 202.Liu X, Khodeiry MM, Lin D, Sun Y, Zhang Q, Wang J, et al. The association of cerebrospinal fluid pressure with optic nerve head and macular vessel density. Sci China Life Sci. 2022;65(6):1171–1180. doi: 10.1007/s11427-021-1984-5. [DOI] [PubMed] [Google Scholar]
- 203.Deming Y, Xia J, Cai Y, Lord J, Holmans P, Bertelsen S, et al. A potential endophenotype for Alzheimer’s disease: cerebrospinal fluid clusterin. Neurobiol Aging. 2016;37(208):e1–e9. doi: 10.1016/j.neurobiolaging.2015.09.009. [DOI] [PMC free article] [PubMed] [Google Scholar]
- 204.Ayton S, Faux NG, Bush AI, Alzheimer’s Disease Neuroimaging Initiative Ferritin levels in the cerebrospinal fluid predict Alzheimer’s disease outcomes and are regulated by APOE. Nat Commun. 2015;6:6760. doi: 10.1038/ncomms7760. [DOI] [PMC free article] [PubMed] [Google Scholar]
- 205.Diouf I, Fazlollahi A, Bush AI, Ayton S, Alzheimer’s Disease Neuroimaging Initiative Cerebrospinal fluid ferritin levels predict brain hypometabolism in people with underlying beta-amyloid pathology. Neurobiol Dis. 2019;124:335–339. doi: 10.1016/j.nbd.2018.12.010. [DOI] [PubMed] [Google Scholar]
- 206.Pan R, Luo S, Huang Q, Li W, Cai T, Lai K, et al. The associations of cerebrospinal fluid ferritin with neurodegeneration and neuroinflammation along the Alzheimer’s disease continuum. J Alzheimers Dis. 2022;88(3):1115–1125. doi: 10.3233/JAD-220002. [DOI] [PubMed] [Google Scholar]
- 207.Varma VR, Varma S, An Y, Hohman TJ, Seddighi S, Casanova R, et al. Alpha-2 macroglobulin in Alzheimer’s disease: a marker of neuronal injury through the RCAN1 pathway. Mol Psychiatry. 2017;22(1):13–23. doi: 10.1038/mp.2016.206. [DOI] [PMC free article] [PubMed] [Google Scholar]
- 208.Pillai JA, Bebek G, Khrestian M, Bena J, Bergmann CC, Bush WS, et al. TNFRSF1B gene variants and related soluble TNFR2 levels impact resilience in Alzheimer’s disease. Front Aging Neurosci. 2021;13:638922. doi: 10.3389/fnagi.2021.638922. [DOI] [PMC free article] [PubMed] [Google Scholar]
- 209.Zou S, Zhang J, for Alzheimer's Disease Neuroimaging Initiative. Chen W. Subtypes based on six apolipoproteins in non-demented elderly are associated with cognitive decline and subsequent tau accumulation in cerebrospinal fluid. J Alzheimers Dis. 2019;72(2):413–423. doi: 10.3233/JAD-190314. [DOI] [PubMed] [Google Scholar]
- 210.Dabiri S, Ramirez Ruiz MI, Jean-Louis G, Ntekim OE, Obisesan TO, Campbell AL, et al. The mediating role of inflammation in the relationship between alpha-synuclein and cognitive functioning. J Gerontol A Biol Sci Med Sci. 2022. [DOI] [PMC free article] [PubMed]
- 211.Tubi MA, Kothapalli D, Hapenney M, Feingold FW, Mack WJ, King KS, et al. Regional relationships between CSF VEGF levels and Alzheimer’s disease brain biomarkers and cognition. Neurobiol Aging. 2021;105:241–251. doi: 10.1016/j.neurobiolaging.2021.04.025. [DOI] [PMC free article] [PubMed] [Google Scholar]
- 212.Cadamuro J, Lippi G, von Meyer A, Ibarz M, van Dongen E, Lases, et al. European survey on preanalytical sample handling - part 2: practices of European laboratories on monitoring and processing haemolytic, icteric and lipemic samples. On behalf of the European Federation of Clinical Chemistry and Laboratory Medicine (EFLM) Working Group for the Preanalytical Phase (WG-PRE). Biochem Med (Zagreb). 2019;29(2):20705. [DOI] [PMC free article] [PubMed]
- 213.Piva E, Tosato F, Plebani M. Pre-analytical phase: the automated ProTube device supports quality assurance in the phlebotomy process. Clin Chim Acta. 2015;451(Pt B):287–291. doi: 10.1016/j.cca.2015.10.010. [DOI] [PubMed] [Google Scholar]
- 214.Kollhoff AL, Howell JC, Hu WT. Automation vs. experience: measuring Alzheimer’s beta-amyloid 1–42 peptide in the CSF. Front Aging Neurosci. 2018;10:253. doi: 10.3389/fnagi.2018.00253. [DOI] [PMC free article] [PubMed] [Google Scholar]
- 215.Hu WT, Shaw LM, Trojanowski JQ. Alzheimer’s disease biomarkers: walk with deliberate haste, don’t run blithely on? Acta Neuropathol. 2013;126(5):625–629. doi: 10.1007/s00401-013-1197-3. [DOI] [PMC free article] [PubMed] [Google Scholar]
- 216.Pillai JA, Bena J, Bebek G, Bekris LM, Bonner-Jackson A, Kou L, et al. Inflammatory pathway analytes predicting rapid cognitive decline in MCI stage of Alzheimer's disease. Ann Clin Transl Neurol. 2020;7(7):1225–1239. doi: 10.1002/acn3.51109. [DOI] [PMC free article] [PubMed] [Google Scholar]
- 217.Tijms BM, Gobom J, Teunissen C, Dobricic V, Tsolaki M, Verhey F, et al. CSF proteomic Alzheimer's disease-predictive subtypes in cognitively intact amyloid negative individuals. Proteomes. 2021;9(3):36. doi: 10.3390/proteomes9030036. [DOI] [PMC free article] [PubMed] [Google Scholar]
Associated Data
This section collects any data citations, data availability statements, or supplementary materials included in this article.
Supplementary Materials
Data Availability Statement
Data available through ADNI or through reasonable requests.