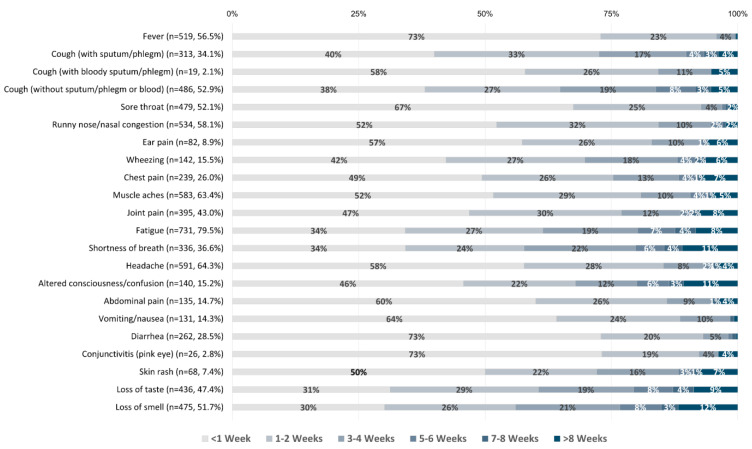
Figure 1.
COVID-19 symptom durations reported by all respondents (in weeks). n values and percentages indicated next to each symptom reflect the number and proportion of participants who experienced a given symptom out of the entire cohort. Percentages indicated on bars represent the proportion of symptomatic participants who reported a given symptom duration.

