

Abstract
While there is a significant reduction in atherosclerotic cardiovascular disease (CVD) risk with statins, a higher risk of diabetes mellitus has been demonstrated in randomized clinical trials. The risk of incident diabetes with statins may be heterogeneous by presence of coronary artery calcium (CAC). We evaluated participants without prevalent diabetes at baseline from the Multi-Ethnic Study of Atherosclerosis (MESA), a prospective cohort study of individuals free of clinical CVD at baseline. We used multivariable-adjusted Cox proportional hazards models to study the association between statin use and incident diabetes adjusting for sociodemographic and cardiovascular risk factors, including time-varying statin use, and stratifying by baseline CAC (0, 1–100, ≥100). The study population included 5,943 participants with mean (SD) age 62 (10) years, 54% females, 41% White, 26% Black, 12% Chinese-American, 21% Hispanic. In unadjusted analyses, statin use was associated with a higher risk of incident diabetes (Hazard Ratio [HR] 1.62; 95% Confidence Interval [CI] 1.27, 2.06). After adjustment, this risk was no longer significant (HR 1.13, 95% CI 0.83, 1.54). Although imprecise, the HR expressing the association of statins with diabetes was lower for those with CAC=0 (HR 0.80; 95% CI 0.45, 1.40) than for those with a higher CAC burden (HR 1.30, 95% CI 0.71, 2.39 for CAC 1–100, and HR 1.39, 95% CI 0.85, 2.28 for CAC ≥100), but this heterogeneity was not statistically significant. In conclusion, statin therapy was not significantly associated with incident diabetes mellitus in this observational study. The risk of incident diabetes did not significantly differ by baseline CAC.
INTRODUCTION
Prior causal evidence from randomized trials has demonstrated an increased risk of diabetes mellitus with statin use.1,2 However, the effect size reported in trials was small (hazard ratio 1.091) and it is well-known that trial participants may not represent patients commonly seen in clinical practice. In addition, evidence from trials has drawn from largely homogeneous samples of White participants, so the association of statin and new-onset diabetes in more racially diverse populations is unknown. In this analysis from the Multi-Ethnic Study of Atherosclerosis (MESA), we studied the association of statins and incident diabetes taking into account cardiovascular risk factors. Furthermore, patients with prediabetes and those with metabolic syndrome often harbor subclinical atherosclerosis.3 Since these individuals appear to be more prone to the diabetes-inducing effect of statins,4 we also studied the association between statin use and incident diabetes in our MESA sample after first stratifying by baseline coronary artery calcium (CAC). We hypothesize that 1) there is a higher risk of incident diabetes with statin use but that this is attenuated after accounting for confounding variables; 2) statin use is associated with a higher risk of diabetes among individuals with elevated CAC (CAC >100) but not among those with absent CAC (CAC=0); and 3) CAC >100 is associated with a higher risk of incident diabetes compared to CAC=0.
METHODS
Study Population
Details of the MESA design have been reported previously.5 Briefly, MESA is a prospective cohort study of 6,814 adults 45 to 84 years old of White, Black, Hispanic, or Chinese American race/ethnicity. Participants were enrolled from 6 U.S. field centers (Baltimore, Maryland; Chicago, Illinois; Forsyth County, North Carolina; Los Angeles, California; New York, New York; and St. Paul, Minnesota) between 2000 and 2002. Five subsequent visits occurred in 2002–2004 (visit 2), 2004–2005 (visit 3), 2005–2007 (visit 4), 2010–2011 (visit 5), and 2016–2018 (visit 6). All participants were required to be free of clinical cardiovascular disease at the time of enrollment. Institutional review boards at each site approved the study, and all participants provided written informed consent.
Inclusion/Exclusion Criteria
Participants with prevalent diabetes mellitus or missing information on baseline statin use were excluded from this analysis (n=871).
Statin Use
Statin use, including frequency and dosage, was evaluated by self‐report and pharmacy containers for all medications used during the 2 weeks preceding the MESA visit. Statin intensity was derived based on medication type and dosage and classified as low-, moderate-, or high-intensity (Supplementary Table).6 The main exposure was statin use at baseline (visit 1). Statin use over the subsequent MESA visits (2 to 6) was accounted for in adjusted analyses as described below.
Incident Diabetes Mellitus
Incident diabetes was assessed at each of the follow-up MESA visits and defined according to the 2003 American Diabetes Association criteria as a fasting glucose ≥126 mg/dL, use of oral hypoglycemic medication and/or insulin,7 or a self-reported physician diagnosis of diabetes. Prevalent diabetes at visit 1 was similarly defined.
Coronary Artery Calcium
CAC was assessed at baseline using either an electron-beam CT scanner (Chicago, Los Angeles, and New York centers) or a multidetector CT system (Baltimore, Forsyth County, and St. Paul centers). Details on image acquisition and interpretation were reported previously.8,9 A CAC score was calculated for each scan, and the mean score of the two scans was used in all analyses. CAC was categorized as (0, 1–99, ≥100). CAC measurements had excellent reproducibility with intraobserver and interobserver kappa statistics of 0.93 and 0.90, respectively).9
Covariates
Information pertaining to demographics, healthcare insurance (includes private and federal health plans), medical history, medication use, and cigarette smoking was self-reported. Physical activity was assessed using the MESA Typical Week Physical Activity Survey that was adapted from the Cross‐Cultural Activity Participation Study.10 The total metabolic equivalents-minutes (MET-min) of moderate and vigorous exercise were estimated from the questionnaire. Dietary habits were assessed using a 120‐item food frequency questionnaire and adherence to healthy diet was based on criteria defined by the American Heart Association11 and modified from the Insulin Resistance Atherosclerosis Study instrument.12 Dietary patterns in MESA were categorized as poor, intermediate, and ideal. Anthropometric measurements were performed according to predefined protocols. Systolic and diastolic blood pressure (SBP and DBP, respectively) were measured three times and the average of the last two measurements was used in these analyses. Hypertension was defined according to the 2017 ACC/AHA Guideline for High Blood Pressure in Adults as SBP ≥130 or DBP ≥80 mm/Hg, a history of physician-diagnosed hypertension, or taking medications for hypertension.13 A central laboratory (University of Vermont, Burlington, VT, USA) measured concentrations of fasting lipids (total and high-density lipoprotein cholesterol (HDL-C), triglycerides), and glucose from visit 1 samples. Low-density lipoprotein cholesterol (LDL-C) was calculated using the Friedewald equation. C-reactive protein was measured using the BNII nephelometer.14 Central obesity was defined as waist circumference ≥80 cm for women and ≥90 cm for men. Impaired fasting glucose was defined as fasting glucose ≥110 - <126 mg/dL. Elevated triglycerides were defined as triglyceride concentration ≥150 mg/dL. Low HDL-C was defined as <50 mg/dL in women or <40 mg/dL in men. Metabolic syndrome was defined according to 2004 National Cholesterol Education Program ATP III criteria.
Statistical Analysis
Baseline characteristics were stratified by statin use (users versus non-users) at baseline. Continuous variables were reported using mean (standard deviation) or median (interquartile range) and differences were tested for significance using Student’s t-test or non-parametric testing respectively depending on the normality of the data. Categorical variables were summarized as count (percentage) and compared using the chi-square test.
Unadjusted incidence rates of diabetes mellitus were reported as number of events per 1000 person-years by baseline statin use. The cumulative incidence of diabetes was graphically displayed using Kaplan-Meier failure curves stratified by statin use.
After confirming the proportionality assumption using Schoenfeld residuals (p=0.18), multivariable-adjusted Cox proportional hazards models were used to examine the association of statin use and incident diabetes mellitus. Models were adjusted for age, sex, race/ethnicity, MESA site, education, income, health insurance, waist circumference, diet, physical activity, LDL-C, hypertension, systolic blood pressure, cigarette smoking status, pack-years smoking, C-reactive protein, baseline aspirin use, and time-varying statin use (longitudinal data from MESA visit 2 to 6). Results were stratified by CAC score (0, 1–99, ≥100) at visit 1. Interaction testing was performed between baseline statin use and CAC categories on the additive and multiplicative scale and significance was tested in multivariable-adjusted models as above.
To assess for confounding by indication, the association of factors correlated with indication for statin use and incident diabetes was evaluated using Cox proportional hazards models. Variables in this analysis included age, current cigarette smoking, antihypertensive medication use, SBP, HDL-C, LDL-C, total cholesterol, and fasting glucose. Continuous variables were normally distributed and modeled per 1 unit increase.
The association between CAC (1–99, ≥100 vs 0) and incident diabetes was assessed using multivariable-adjusted Cox proportional hazards models as above.
The following sensitivity analyses were performed. 1) The association between statin intensity and incident diabetes was evaluated using multivariable-adjusted Cox proportional hazards models as above. Two sets of analyses were performed: statin intensity (low, moderate, high) versus no statin; and high-intensity versus moderate- intensity statin. 2) A propensity-score matched analysis was used to study the association between statin use and incident diabetes adjusting for covariates as above. The propensity score was derived using logistic regression modeling the probability of being on a statin at baseline as a function of age, sex, race/ethnicity, education, income, insurance status, LDL-C, hypertension, aspirin use, and cigarette smoking. The propensity score was applied to match statin users and non-users using a 1:4 ratio using the nearest neighbor and a caliper width of 0.02. 3) Results for statin use and incident diabetes were also stratified by age (<60 vs ≥60 years), sex, central obesity, elevated triglycerides, low HDL-C, metabolic syndrome, and impaired fasting glucose. Interaction testing was performed between baseline statin use and each of these variables as aforementioned. To account for multiple comparisons, Bonferroni correction was applied. 3) Participants who reported using statins at visit 1 were further categorized as those who continued statin therapy throughout the duration of follow-up versus discontinuing statin over any of the subsequent visits. 4) Lastly, a subgroup analysis was performed to evaluate the association between statin use and incident diabetes depending on the number of visits each MESA participant attended.
Analyses were conducted using Stata version 16.1 (StataCorp, College Station, TX).
RESULTS
The study population consisted of 5,943 participants with mean (SD) age 62 (10) years, 54% females, 41% White, 26% Black, 12% Chinese-American, 21% Hispanic. The prevalence of statin therapy at visit 1 was 13%. Among participants with available information on statin type and dosage (n=5,832), the prevalence of statin intensity was as follows: 2.7% low-intensity, 8.4% moderate-intensity, and 0.5% high-intensity.
Compared to statin non-users, those taking a statin at visit 1 were older, more likely to be White, have healthcare insurance, have higher body mass index and waist circumference, have hypertension, more likely to take aspirin, and more likely to have CAC >0. Statin users had lower LDL-C, C-reactive protein, and engaged in more moderate-to-vigorous physical activity; all p<0.05 (Table 1).
Table 1.
Characteristics of the study population stratified by visit 1 self-reported statin use
| Statin non-users (N=5,156; 87%) |
Statin users (N=787; 13%) |
p-value | |
|---|---|---|---|
| Age (years) | 61 (10) | 66 (9) | <0.001 |
| Sex (%) | 0.60 | ||
| Female | 2,770 (54%) | 415 (53%) | |
| Male | 2,386 (46%) | 372 (47%) | |
| Race/Ethnicity (%) | <0.001 | ||
| White | 2,070 (40%) | 389 (49%) | |
| Chinese-American | 628 (12%) | 71 (9%) | |
| Black | 1,354 (26%) | 200 (25%) | |
| Hispanic American | 1,104 (21%) | 127 (16%) | |
| Education | 0.01 | ||
| Less than high school | 847 (16%) | 121 (15%) | |
| Completed high school | 901 (18%) | 164 (21%) | |
| Less than college | 1,493 (29%) | 204 (26%) | |
| College | 940 (18%) | 122 (16%) | |
| Graduate degree | 956 (19%) | 175 (22%) | |
| Annual Income ($) | 0.79 | ||
| <12,000 | 540 (11%) | 83 (11%) | |
| 12,000-<25,000 | 933 (19%) | 144 (19%) | |
| 25,000-<40,000 | 931 (19%) | 138 (18%) | |
| 40,000-<75,000 | 1,373 (28%) | 197 (26%) | |
| ≥75,000 | 1,187 (24%) | 195 (26%) | |
| Healthcare Coverage, % | 4,634 (90%) | 770 (98%) | <0.001 |
| Body mass index, kg/m2 | 27.9 | 28.5 | 0.01 |
| Waist circumference, cm | 96.8 | 99.6 | <0.001 |
| Current cigarette smoking, % | 699 (14%) | 74 (9%) | 0.049 |
| Pack-years smoking* | 21 (8–36) | 30 (14–47) | 0.005 |
| Hypertension, % | 2,789 (54%) | 580 (74%) | <0.001 |
| SBP, mm Hg | 125 (21) | 129 (21) | <0.001 |
| LDL-C, mg/dL | 120 (31) | 104 (28) | 0.001 |
| HDL-C, mg/dL | 51.7 (15.2) | 51.8 (13.6) | 0.79 |
| Glucose, mg/dL | 89 (11) | 92 (11) | <0.001 |
| Diet | 0.54 | ||
| Ideal | 16 (0.3%) | 2 (0.3%) | |
| Intermediate | 1,908 (39%) | 308 (41%) | |
| Poor | 3,024 (61%) | 448 (59%) | |
| Moderate-vigorous physical activity, MET-min/wk* | 4178 (2085–7665) |
3780 (1860–6840) |
0.004 |
| C-reactive protein, mg/L* | 1.87 (0.82–4.22) |
1.60 (0.74–3.57) |
0.01 |
| Aspirin use, % | 800 (16%) | 262 (35%) | <0.001 |
| CAC, Agatston Units | <0.001 | ||
| 0 | 2,822 (55%) | 267 (34%) | |
| 1–99 | 1,295 (25%) | 257 (33%) | |
| ≥100 | 1,039 (20%) | 263 (33%) |
Abbreviations: LDL-C (low-density lipoprotein cholesterol); HDL-C (high-density lipoprotein cholesterol); SBP (systolic blood pressure); CHD (coronary heart disease); CAC (coronary artery calcium)
Continuous variables were summarized as mean (standard deviation) or median (interquartile range)
Categorical variables were summarized as count (percentage)
Over a median (IQR) follow-up time of 15.7 (11.3–16.5) years, there were 515 incident diabetes cases. The unadjusted incidence of diabetes (per 1000 person-years) was 6.1 among statin non-users compared to 9.3 for statin-users (p=0.0004). The unadjusted incidence of diabetes was similar among statin users and non-users in the first 6 to 8 years after which the rates diverged and remained higher in statin users (Figure).
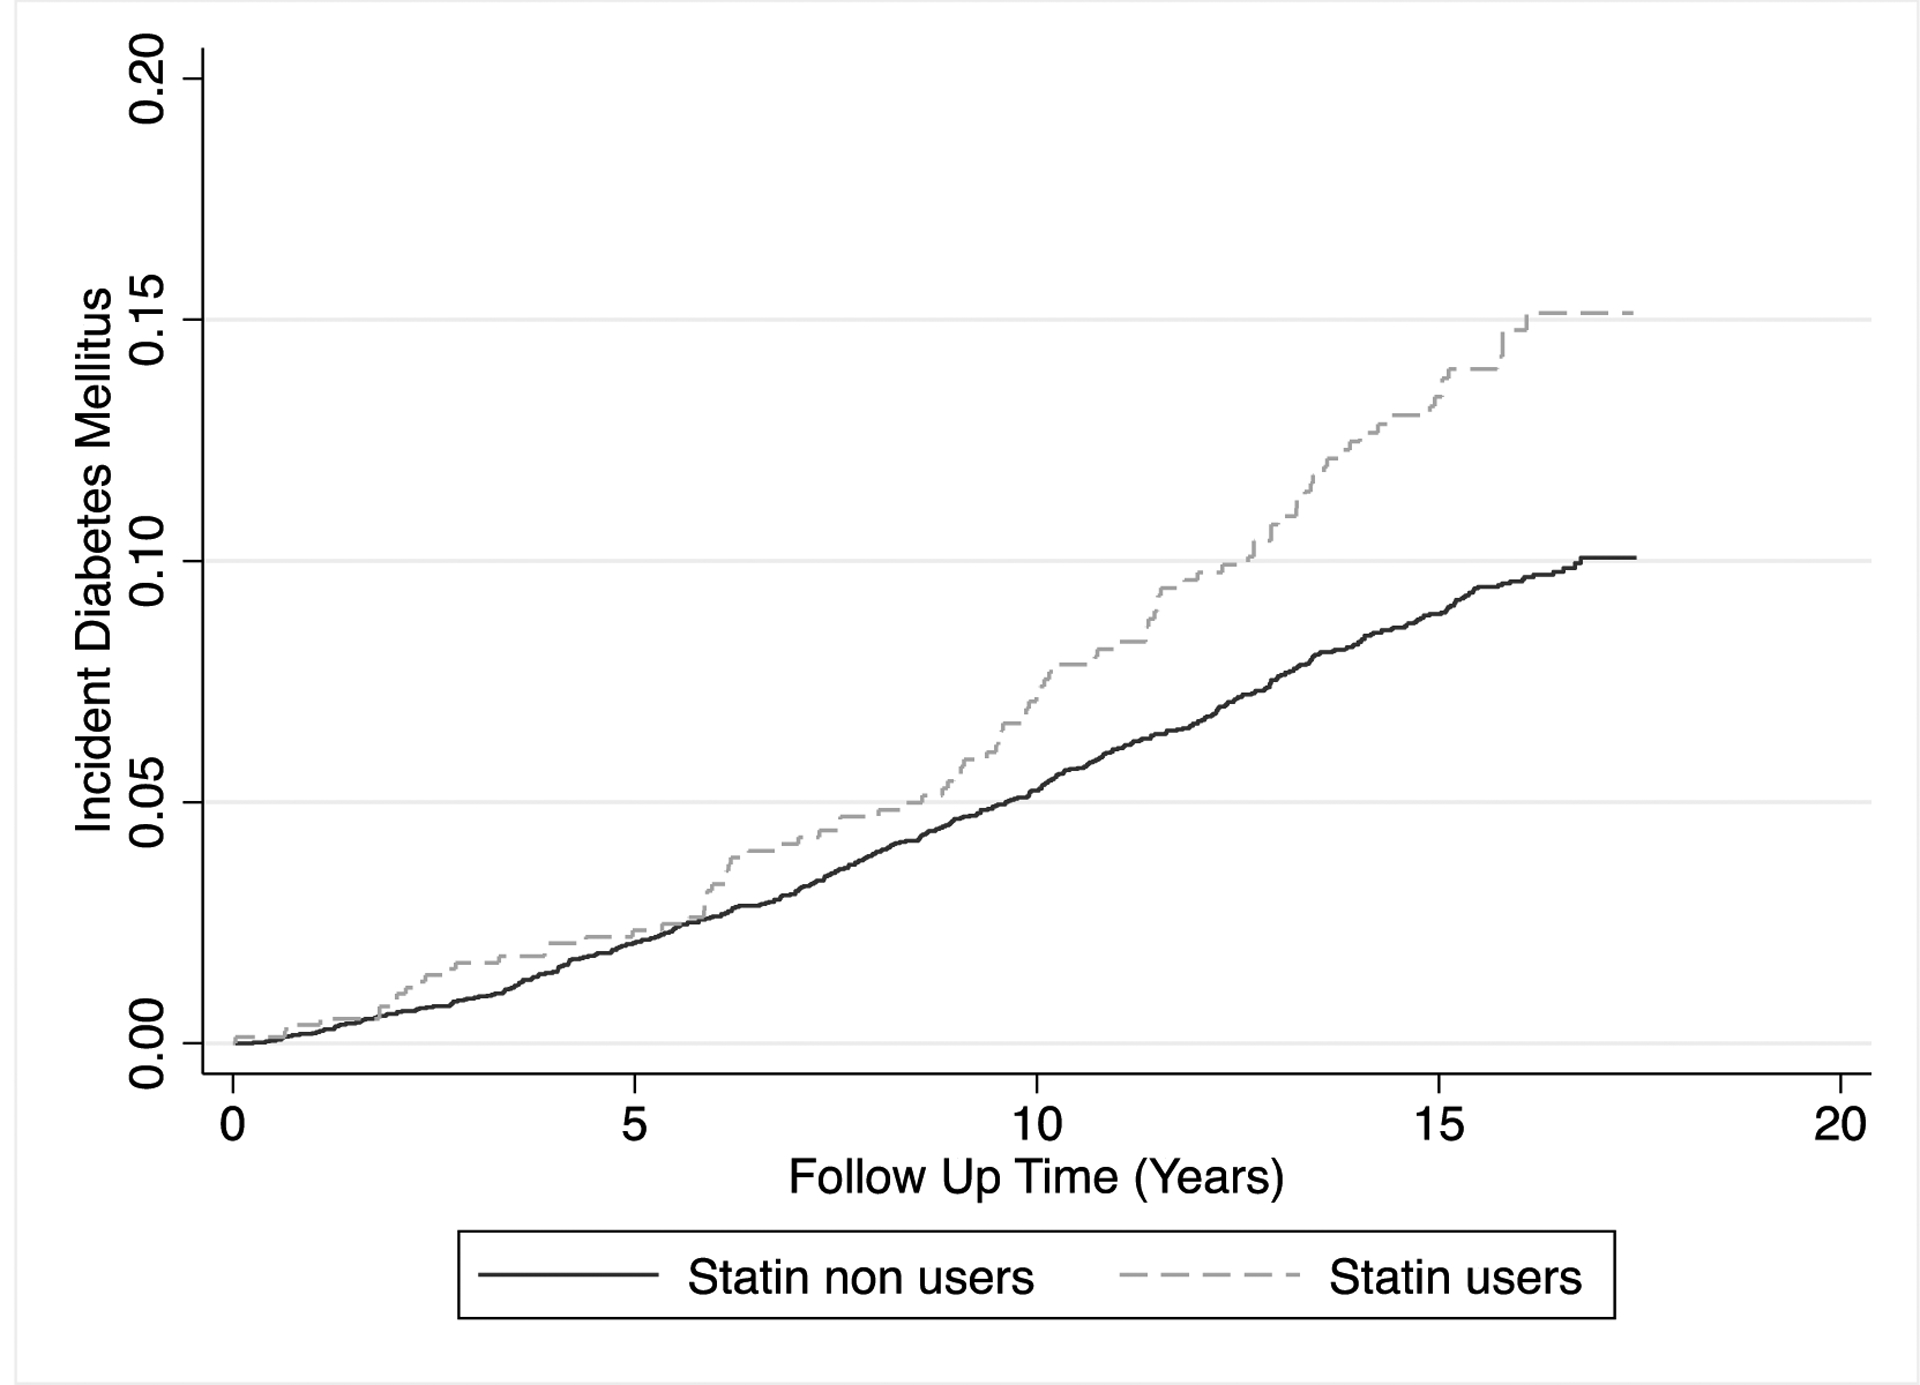
Kaplan Meier failure curves for the cumulative incidence of diabetes stratified by baseline statin use
In unadjusted analyses, statin use was associated with a higher risk of incident diabetes mellitus (Hazard Ratio [HR] 1.62; 95% Confidence Interval [CI] 1.27,2.06). After adjustment for baseline risk factors and longitudinal statin use, this association became attenuated and no longer significant (HR 1.13, 95% CI 0.83,1.54). The association between statin therapy and incident diabetes was not statistically significant in analyses stratifying by baseline CAC. However, although not statistically significant, the HR point estimate for the association of statins with diabetes was lower in those with CAC=0 (HR 0.80; 95% CI 0.45, 1.40) than in those with higher CAC burden: (HR 1.30, 95% CI 0.71, 2.39) for CAC 1–100, and (HR 1.39, 95% CI 0.85, 2.28) for CAC ≥100. There was no significant interaction between statin use and CAC in the association with incident diabetes (Table 2).
Table 2.
Multivariable-adjusted* hazard ratios (95% confidence interval) for the association of statin use and incident diabetes mellitus
| Unadjusted | Adjusted* | P-value for additive moderation | p-value for multiplicative moderation | |
|---|---|---|---|---|
| Overall | 1.62 (1.27,2.06) | 1.13 (0.83,1.54) | − | − |
| CAC, Agatston units | ||||
| CAC 0 (51%) | 1.61 (1.04,2.48) | 0.80 (0.45,1.40) | ||
| CAC 1–99 (26%) | 1.26 (0.80,2.00) | 1.30 (0.71,2.39) | 0.57 | 0.58 |
| CAC ≥100 (22%) | 1.36 (0.92,2.00) | 1.39 (0.85,2.28) | 0.32 | 0.37 |
| Age, years | 0.28 | 0.24 | ||
| <60 (44%) | 1.96 (1.26,3.07) | 1.66 (0.93,2.95) | ||
| ≥60 (56%) | 1.27 (0.95,1.70) | 1.01 (0.70,1.47) | ||
| Sex | 0.48 | 0.45 | ||
| Female (53%) | 2.11 (1.54,2.89) | 1.33 (0.88,2.02) | ||
| Male (46%) | 1.18 (0.80,1.72) | 0.95 (0.59,1.53) | ||
| Central Obesity | 0.48 | 0.32 | ||
| No (19%) | 2.69 (0.93,7.81) | 1.17 (0.26,5.36) | ||
| Yes (81%) | 1.45 (1.13,1.86) | 1.12 (0.82,1.55) | ||
| Impaired fasting glucose | 0.02 | 0.01 | ||
| No (84%) | 1.91 (1.39,2.63) | 1.60 (1.05,2.43) | ||
| Yes (16%) | 0.95 (0.65,1.37) | 0.57 (0.35,0.92) | ||
| Elevated Triglycerides | 0.09 | 0.11 | ||
| No (72%) | 1.51 (1.09,2.09) | 0.99 (0.64,1.53) | ||
| Yes (28%) | 1.69 (1.18,2.43) | 1.66 (1.04,2.65) | ||
| Low HDL-C | 0.63 | 0.51 | ||
| No (66%) | 1.88 (1.37,2.56) | 1.28 (0.85,1.93) | ||
| Yes (34%) | 1.33 (0.90,1.96) | 1.04 (0.63,1.70) | ||
| Metabolic Syndrome | 0.47 | 0.67 | ||
| No (70%) | 1.46 (0.98,2.18) | 1.09 (0.64,1.86) | ||
| Yes (30%) | 1.41 (1.04,1.91) | 1.19 (0.81,1.77) |
Abbreviation: CAC (coronary artery calcium), HDL-C (high-density lipoprotein cholesterol)
Central obesity is defined as waist circumference ≥80 cm for women and ≥90 cm for men. Impaired fasting glucose is defined as glucose 100–126 mg/dL. Elevated triglycerides is defined as triglyceride ≥150 mg/dL. Metabolic syndrome is defined according to 2004 NCEP ATP III definition if 3 or more of the following 5 criteria are met: waist circumference over 40 inches (men) or 35 inches (women), blood pressure over 130/85 mmHg, fasting triglyceride over 150 mg/dl, fasting HDL-C <40 mg/dl (men) or 50 mg/dl (women), and fasting blood sugar over 100 mg/dl.
Hazard ratios are calculated using Cox proportional hazards models
Model is adjusted for age, sex, race/ethnicity, MESA site, education, income, insurance status, waist circumference, diet, physical activity, low-density lipoprotein cholesterol, hypertension status, systolic blood pressure, cigarette smoking status, pack-years cigarette smoking, C-reactive protein, baseline aspirin use, and time-varying statin use
Bolded items are statistically significant
In subgroup analyses, there was no significant adjusted association between statin use and incident diabetes except a higher risk in participants with normal fasting glucose (HR 1.60; 95% CI 1.05, 2.43) and a lower risk in those with impaired fasting glucose (HR 0.57; 95% CI 0.35, 0.92); p-value for interaction = 0.02 (Table 2). These hazard ratios, however, were not statistically significant after Bonferroni correction for multiplicity.
Compared to participants with CAC=0 there was a higher risk of incident diabetes among those with CAC ≥100, which was statistically significant (HR 1.66; 95% CI 1.24, 2.22).
In adjusted analyses, there was a direct association between SBP, antihypertensive medication use, total cholesterol, and plasma glucose with incident diabetes, but an inverse association between HDL-C, LDL-C and incident diabetes (Table 3).
Table 3.
Multivariable-adjusted hazard ratios for the association of risk factors and incident diabetes
| Unadjusted | Adjusted* | |
|---|---|---|
| Age | 1.03 (1.02,1.04) | 1.10 (0.99,1.02) |
| Current cigarette smoking | 1.10 (0.84,1.44) | 1.28 (0.97,1.70) |
| Anti-hypertensive medication use | 2.38 (2.01,2.83) | 1.53 (1.27,1.85) |
| SBP | 1.018 (1.014,1.022) | 1.009 (1.005,1.014) |
| HDL-C | 0.98 (0.97,0.99) | 0.981 (0.974,0.989) |
| LDL-C | 0.997 (0.994,1.000) | 0.981 (0.975,0.988) |
| Total cholesterol | 0.998 (0.996,1.000) | 1.016 (1.009,1.023) |
| Glucose | 1.08 (1.07,1.09) | 1.07 (1.06,1.08) |
Abbreviations: SBP (systolic blood pressure); HDL-C (high-density lipoprotein cholesterol); LDL-C (low-density lipoprotein cholesterol)
The adjusted model includes all of the variables listed above using Cox proportional hazards models
The risk of incident diabetes by statin intensity was as follows: HR 1.70; 95% CI 1.07, 2.71 for low-intensity, HR 0.95; 95% CI 0.66, 1.36 for moderate-intensity, and HR 1.33; 95% CI 0.33, 5.46 for high-intensity statin use, each compared to no statin use. There was a higher risk of incident diabetes with high-intensity versus moderate-intensity statin but this was not statistically significant: (HR 1.41; 95% CI 0.34, 5.91). There was no significant association between propensity-score matched statin use and incident diabetes (HR 1.10; 95% CI 0.79, 1.52). Among MESA participants who reported using statins at visit 1, those who continued statin therapy throughout the duration of follow-up (n=160) had a higher risk of developing diabetes compared to those who subsequently discontinued statin therapy (n=347) though this was not statistically significant (HR 1.28, 95% CI 0.57, 2.90). Among participants who attended 1 to 4 visits (n=1,864), the HR (95% CI) for the association of baseline statin use and incident diabetes was 0.74 (0.38, 1.44), while it was 1.16 (0.66, 2.05) for those who attended 5 visits (n=1,600), and 1.42 (0.89, 2.28) for those who attended all 6 MESA visits (n=2,479).
DISCUSSION
In this prospective observational study, there was a significantly higher risk of diabetes with statin use in unadjusted models that was attenuated and no longer statistically significant after multivariable-adjustment. The risk of incident diabetes did not significantly differ by baseline CAC.
Mendelian randomization studies have shown an association between single-nucleotide polymorphisms (SNPs) within or near the gene that encodes 3-hydroxy-3-methylglutaryl-CoA (HMG-CoA) reductase with excess incidence and prevalence of type 2 diabetes.15,16. In a meta-analysis of 13 statin trials, treatment with statins was associated with a 9% higher risk of diabetes mellitus.1 We observed a 4% higher risk of diabetes with statin use that was not significant in multivariable-adjusted models. In a meta-analysis by Collins et al, it was estimated that treatment with statin in 10,000 people over 5 years with statins would result in 50 to 100 new cases of diabetes.17 In the present analysis, the excess risk of diabetes with statin use over 15 years was just 3 cases per 1000 person-years and less than the expected 15–30 per 1000 person-years based on the Collins study. This may be due to MESA being a healthier cohort compared to randomized trial populations. Another meta-analysis found a 12% higher risk of new-onset diabetes (odd ratio 1.12; 95% CI 1.04–1.22) with high-intensity therapy compared with moderate-intensity statin therapy.2 In the present study, there was a 4% higher of incident diabetes with high-intensity compared to moderate-intensity statin use though this was not statistically significant. Indeed, we cannot exclude that the effect size from randomized trial data is inconsistent with this observational study given a relatively small sample size.
A meta-regression of statin trials showed that risk of incident diabetes was highest in trials with older participants.1 Older individuals may have had a longer duration of exposure to cardiometabolic risk factors that predispose to diabetes. In a meta-analysis of randomized clinical trials of atorvastatin, pre-existing features of metabolic syndrome or pre-diabetes were independent predictors of new-onset diabetes.4 In this analysis, there was no significant interaction by age in the association of statin use with incident diabetes. We found a differential association of cardiovascular risk factors with incident diabetes such that SBP, antihypertensive medication use, total cholesterol, and plasma glucose directly were directly associated with risk of diabetes, while HDL-C and LDL-C were inversely associated with this risk.
In a prior retrospective observational study of 25,970 Tricare beneficiaries, Mansi et al performed propensity-score matching to evaluate the association of statin use with new-onset diabetes.18 Statin users had a higher odds of incident diabetes (odds ratio 1.87; 95% CI 1.67–2.01) and diabetes with complications (odds ratio 2.50; 95% CI 1.88–3.32) compared to non-users. In another study of 153,840 postmenopausal women in the Women’s Health Initiative, Culver et al evaluated the association between statin use and incident diabetes.19 Statin use at baseline was associated with a higher risk of new-onset diabetes in adjusted models (HR 1.48; 95% CI 1.38–1.59). The present findings did not show a higher risk of diabetes after adjustment. Smaller sample size may explain this discrepancy. Unique to the present analysis, we analyzed the association between statin use and incident diabetes according to CAC burden. There was a higher risk of diabetes with statin use among MESA participants higher CAC burden. Additionally, there was a trend towards lower risk of diabetes with statin use in the subgroup of CAC=0. This may suggest that the higher risk of diabetes with statin is at least partly due to shared risk with CAC. Furthermore, there was a higher risk of incident diabetes among those with elevated CAC compared to those with absent CAC.
Analyses of statin association in observational studies are subject to confounding by indication bias. We attempted to account for this in several ways: First, we adjusted for multiple confounders and performed propensity-score matching in a sensitivity analysis. Second, we performed multiple stratified analyses to identify potential high-risk subgroups. Third, we evaluated the association between risk factors correlated with statin use and incident diabetes mellitus. These analyses confirmed that the relationship between statin use and new-onset diabetes is strongly confounded and no longer significant after multivariable adjustment. Unexpectedly, there was a higher risk of diabetes among individuals with normal fasting glucose compared to a lower risk in those with impaired fasting glucose with a significant p-value for interaction between statin use and impaired fasting glucose. It is possible that participants with impaired fasting glucose were treated more aggressively over follow-up which might explain the lower risk of diabetes in this group.
These results should be interpreted in the context of limitations. Small sample size may have underpowered results especially in subgroup analyses. Statin prescription patterns may have changed over follow-up after CAC scans, though our analysis accounted for time-varying statin use. Incident diabetes occurring between MESA follow-up visits may have been missed resulting in under ascertainment of diabetes. As this was an observational study, no conclusions can be drawn on mechanisms linking statin use and new-onset diabetes. The possibility of residual confounding and potential for overadjustment in observational studies cannot be excluded.
In conclusion, statin therapy was not significantly associated with incident diabetes mellitus in this observational study after accounting for multiple risk factors that both predispose to diabetes and are related to the indication for statin use. The risk of incident diabetes did not significantly differ by baseline CAC.
Supplementary Material
ACKNOWLEDGEMENTS
The MESA projects are conducted and supported by the National Heart, Lung, and Blood Institute (NHLBI) in collaboration with MESA investigators. Support for MESA is provided by contracts 75N92020D00001, HHSN268201500003I, N01-HC-95159, 75N92020D00005, N01-HC-95160, 75N92020D00002, N01-HC-95161, 75N92020D00003, N01-HC-95162, 75N92020D00006, N01-HC-95163, 75N92020D00004, N01-HC-95164, 75N92020D00007, N01-HC-95165, N01-HC-95166, N01-HC-95167, N01-HC-95168, N01-HC-95169, UL1-TR-000040, UL1-TR-001079, and UL1-TR-001420. Also supported in part by the National Center for Advancing Translational Sciences, CTSI grant UL1TR001881, and the National Institute of Diabetes and Digestive and Kidney Disease Diabetes Research Center (DRC) grant DK063491 to the Southern California Diabetes Endocrinology Research Center.
The authors thank the other investigators, the staff, and the participants of the MESA study for their valuable contributions. A full list of participating MESA investigators and institutions can be found at http://www.mesa-nhlbi.org.
Conflicts of Interest
Dr. Virani
Research support: Department of Veterans Affairs, World Heart Federation, and Tahir and Jooma Family.
Honorarium: American College of Cardiology (Associate Editor for Innovations, acc.org).
Dr. Greenland
Grants from National Institute of Health and American Heart Association
Dr. Bittner
Through contracts between UAB and the sponsor, VB was National Coordinator for the STRENGTH Trial (Astra Zeneca) and the Dalgene trial (DalCor); is National Coordinator for the CLEAR Outcomes trial and Steering Committee member for the ODYSSEY OUTCOMES trial (Sanofi/Regeneron); serves as site PI for the ORION IV trial (Novartis). She completed a consultantship with Pfizer in 2021 and currently serves on a Data Safety and Monitoring Board for Verve Therapeutics.
Dr. Shapiro
Institutional Research Support: NIH, Amgen, Novartis, Ionis, Regeneron
Scientific Advisory Boards: Amgen, Novartis, Novo Nordisk
Consultant: Regeneron
Dr. Ballantyne
Grant/Research Support- All significant. (All paid to institution, not individual): Abbott Diagnostic, Akcea, Amgen, Arrowhead, Esperion, Ionis, Merck, Novartis, Novo Nordisk, Regeneron, Roche Diagnostic, NIH, AHA, ADA.
Consultant- 89Bio, Abbott Diagnostics, Alnylam Pharmaceuticals, Althera, Amarin, Amgen, Arrowhead, Astra Zeneca, Denka Seiken*, Esperion, Genentech, Gilead, Illumina, Matinas BioPharma Inc, Merck, New Amsterdam*, Novartis, Novo Nordisk, Pfizer, Regeneron, Roche Diagnostic, Sanofi-Synthelabo
The remaining authors have nothing to disclose.
REFERENCES
- 1.Sattar N, Preiss D, Murray HM, Welsh P, Buckley BM, Craen AJM de, Seshasai SRK, McMurray JJ, Freeman DJ, Jukema JW, Macfarlane PW, Packard CJ, Stott DJ, Westendorp RG, Shepherd J, Davis BR, Pressel SL, Marchioli R, Marfisi RM, Maggioni AP, Tavazzi L, Tognoni G, Kjekshus J, Pedersen TR, Cook TJ, Gotto AM, Clearfield MB, Downs JR, Nakamura H, Ohashi Y, Mizuno K, Ray KK, Ford I. Statins and risk of incident diabetes: a collaborative meta-analysis of randomised statin trials. Lancet (London, England) 2010;375:735–742. [DOI] [PubMed] [Google Scholar]
- 2.Preiss D, Seshasai SRK, Welsh P, Murphy SA, Ho JE, Waters DD, DeMicco DA, Barter P, Cannon CP, Sabatine MS, Braunwald E, Kastelein JJP, Lemos JA de, Blazing MA, Pedersen TR, Tikkanen MJ, Sattar N, Ray KK. Risk of incident diabetes with intensive-dose compared with moderate-dose statin therapy: a meta-analysis. JAMA 2011;305:2556–2564. [DOI] [PubMed] [Google Scholar]
- 3.Tehrani DM, Malik S, Wong ND. Coronary artery calcium screening in persons with metabolic syndrome and diabetes: implications for prevention. Metab Syndr Relat Disord 2013;11:143–148. Available at: https://pubmed.ncbi.nlm.nih.gov/23438153. [DOI] [PMC free article] [PubMed] [Google Scholar]
- 4.Waters DD, Ho JE, DeMicco DA, Breazna A, Arsenault BJ, Wun C-C, Kastelein JJ, Colhoun H, Barter P. Predictors of new-onset diabetes in patients treated with atorvastatin: results from 3 large randomized clinical trials. J Am Coll Cardiol 2011;57:1535–1545. [DOI] [PubMed] [Google Scholar]
- 5.Bild DE, Bluemke DA, Burke GL, Detrano R, Diez Roux AV, Folsom AR, Greenland P, Jacob DR, Kronmal R, Liu K, Nelson JC, O’Leary D, Saad MF, Shea S, Szklo M, Tracy RP. Multi-ethnic study of atherosclerosis: objectives and design. Am J Epidemiol 2002;156:871–81. Available at: http://www.ncbi.nlm.nih.gov/pubmed/12397006. Accessed August 19, 2014. [DOI] [PubMed] [Google Scholar]
- 6.Grundy SM, Stone NJ, Bailey A et al. 2018 AHA/ACC/AACVPR/AAPA/ABC/ACPM/ADA/AGS/APhA/ASPC/NLA/PCNA Guideline on the Management of Blood Cholesterol. Circulation 2018;0:CIR.0000000000000625. Available at: 10.1161/CIR.0000000000000625. [DOI] [Google Scholar]
- 7.Anon. Standards of medical care for patients with diabetes mellitus. Diabetes Care 2003;26 Suppl 1:S33–50. [DOI] [PubMed] [Google Scholar]
- 8.Carr JJ, Nelson JC, Wong ND, McNitt-Gray M, Arad Y, Jacobs DR, Sidney S, Bild DE, Williams OD, Detrano RC. Calcified coronary artery plaque measurement with cardiac CT in population-based studies: standardized protocol of Multi-Ethnic Study of Atherosclerosis (MESA) and Coronary Artery Risk Development in Young Adults (CARDIA) study. Radiology 2005;234:35–43. Available at: http://www.ncbi.nlm.nih.gov/pubmed/15618373. Accessed June 26, 2016. [DOI] [PubMed] [Google Scholar]
- 9.Detrano R, Guerci AD, Carr JJ, Bild DE, Burke G, Folsom AR, Liu K, Shea S, Szklo M, Bluemke DA, O’Leary DH, Tracy R, Watson K, Wong ND, Kronmal RA. Coronary calcium as a predictor of coronary events in four racial or ethnic groups. N Engl J Med 2008;358:1336–45. Available at: http://www.ncbi.nlm.nih.gov/pubmed/18367736. Accessed May 28, 2014. [DOI] [PubMed] [Google Scholar]
- 10.Ainsworth BE, Irwin ML, Addy CL, Whitt MC, Stolarczyk LM. Moderate physical activity patterns of minority women: the Cross-Cultural Activity Participation Study. J Womens Health Gend Based Med 8:805–13. Available at: http://www.ncbi.nlm.nih.gov/pubmed/10495261. Accessed June 26, 2016. [DOI] [PubMed] [Google Scholar]
- 11.Lloyd-Jones DM, Hong Y, Labarthe D, Mozaffarian D, Appel LJ, Horn L Van, Greenlund K, Daniels S, Nichol G, Tomaselli GF, Arnett DK, Fonarow GC, Ho PM, Lauer MS, Masoudi FA, Robertson RM, Roger V, Schwamm LH, Sorlie P, Yancy CW, Rosamond WD. Defining and setting national goals for cardiovascular health promotion and disease reduction: the American Heart Association’s strategic Impact Goal through 2020 and beyond. Circulation 2010;121:586–613. Available at: http://circ.ahajournals.org/content/121/4/586.abstract?ijkey=205cc615bd4f4208b00f07a84f7015d5e8764d29&keytype2=tf_ipsecsha. Accessed April 22, 2016. [DOI] [PubMed] [Google Scholar]
- 12.Block G, Woods M, Potosky A, Clifford C. Validation of a self-administered diet history questionnaire using multiple diet records. J Clin Epidemiol 1990;43:1327–1335. [DOI] [PubMed] [Google Scholar]
- 13.WP K, CR M, AW S, CD E, CK J, Cheryl DH MDS, Samuel G, JK A, JD W, ME J, Paul M, Bruce O, SS C, SC C, SR S, TS J, TR J, WK A, WJ D, WJ T. 2017 ACC/AHA/AAPA/ABC/ACPM/AGS/APhA/ASH/ASPC/NMA/PCNA Guideline for the Prevention, Detection, Evaluation, and Management of High Blood Pressure in Adults: A Report of the American College of Cardiology/American Heart Association Task Force on Clinical Pr. Hypertension 2018;71:e13–e115. Available at: 10.1161/HYP.0000000000000065. [DOI] [PubMed] [Google Scholar]
- 14.Kianoush S, Yakoob MY, Al-Rifai M, DeFilippis AP, Bittencourt MS, Duncan BB, Bensenor IM, Bhatnagar A, Lotufo PA, Blaha MJ. Associations of Cigarette Smoking With Subclinical Inflammation and Atherosclerosis: ELSA-Brasil (The Brazilian Longitudinal Study of Adult Health). J Am Heart Assoc 2017;6. [DOI] [PMC free article] [PubMed] [Google Scholar]
- 15.Swerdlow DI, Preiss D, Kuchenbaecker KB, Holmes MV, Engmann JEL, Shah T, Sofat R, Stender S, Johnson PCD, Scott RA, Leusink M, Verweij N, Sharp SJ, Guo Y, Giambartolomei C, Chung C, Peasey A, Amuzu A, Li K, Palmen J, Howard P, Cooper JA, Drenos F, Li YR, Lowe G, Gallacher J, Stewart MCW, Tzoulaki I, Buxbaum SG, A DL van der, Forouhi NG, Onland-Moret NC, Schouw YT van der, Schnabel RB, Hubacek JA, Kubinova R, Baceviciene M, Tamosiunas A, Pajak A, Topor-Madry R, Stepaniak U, Malyutina S, Baldassarre D, Sennblad B, Tremoli E, Faire U de, Veglia F, Ford I, Jukema JW, Westendorp RGJ, et al. HMG-coenzyme A reductase inhibition, type 2 diabetes, and bodyweight: evidence from genetic analysis and randomised trials. Lancet (London, England) 2015;385:351–361. [DOI] [PMC free article] [PubMed] [Google Scholar]
- 16.Lotta LA, Sharp SJ, Burgess S, Perry JRB, Stewart ID, Willems SM, Luan J, Ardanaz E, Arriola L, Balkau B, Boeing H, Deloukas P, Forouhi NG, Franks PW, Grioni S, Kaaks R, Key TJ, Navarro C, Nilsson PM, Overvad K, Palli D, Panico S, Quirós J-R, Riboli E, Rolandsson O, Sacerdote C, Salamanca-Fernandez E, Slimani N, Spijkerman AMW, Tjonneland A, Tumino R, A DL van der, Schouw YT van der, McCarthy MI, Barroso I, O’Rahilly S, Savage DB, Sattar N, Langenberg C, Scott RA, Wareham NJ. Association Between Low-Density Lipoprotein Cholesterol–Lowering Genetic Variants and Risk of Type 2 Diabetes: A Meta-analysis. JAMA 2016;316:1383–1391. Available at: 10.1001/jama.2016.14568. [DOI] [PMC free article] [PubMed] [Google Scholar]
- 17.Collins R, Reith C, Emberson J, Armitage J, Baigent C, Blackwell L, Blumenthal R, Danesh J, Smith GD, DeMets D, Evans S, Law M, MacMahon S, Martin S, Neal B, Poulter N, Preiss D, Ridker P, Roberts I, Rodgers A, Sandercock P, Schulz K, Sever P, Simes J, Smeeth L, Wald N, Yusuf S, Peto R. Interpretation of the evidence for the efficacy and safety of statin therapy. Lancet 2016;388:2532–2561. Available at: 10.1016/S0140-6736(16)31357-5. [DOI] [PubMed] [Google Scholar]
- 18.Mansi I, Frei CR, Wang C-P, Mortensen EM. Statins and New-Onset Diabetes Mellitus and Diabetic Complications: A Retrospective Cohort Study of US Healthy Adults. J Gen Intern Med 2015;30:1599–1610. [DOI] [PMC free article] [PubMed] [Google Scholar]
- 19.Culver AL, Ockene IS, Balasubramanian R, Olendzki BC, Sepavich DM, Wactawski-Wende J, Manson JE, Qiao Y, Liu S, Merriam PA, Rahilly-Tierny C, Thomas F, Berger JS, Ockene JK, Curb JD, Ma Y. Statin use and risk of diabetes mellitus in postmenopausal women in the Women’s Health Initiative. Arch Intern Med 2012;172:144–152. [DOI] [PubMed] [Google Scholar]
Associated Data
This section collects any data citations, data availability statements, or supplementary materials included in this article.