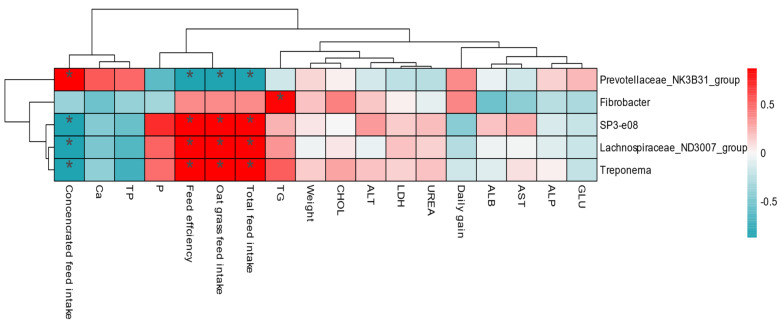
Figure 6.
Correlation between rumen bacteria and growth performance. Each row in the graph represents a genus, each column represents a growth performance indicator, and each grid represents the Pearson correlation coefficient between a component and an indicator. Red represents positive correlations, while blue represents negative correlations. * indicates a 0.05 level of significance.

