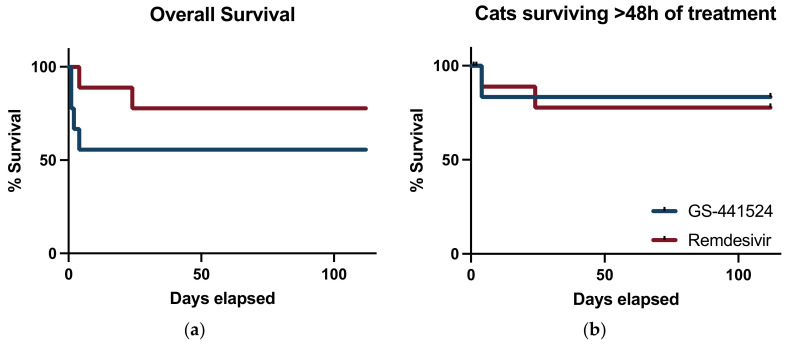
Figure 4.
Survival curves: (a) survival curve that displays all-cause mortality; and (b) survival curve with cats that succumbed to disease within the first 48 h of therapy censored from analysis. Cats treated with GS-441524 are represented by the blue line and cats treated with remdesivir are represented by the red line.

