Abstract
Background
Functional connectome fingerprinting can identify individuals based on their functional connectome. Previous studies relied mostly on short intervals between fMRI acquisitions.
Objective
This cohort study aimed to determine the stability of connectome-based identification and their underlying signatures in patients with multiple sclerosis and healthy individuals with long follow-up intervals.
Methods
We acquired resting-state fMRI in 70 patients with multiple sclerosis and 273 healthy individuals with long follow-up times (up to 4 and 9 years, respectively). Using functional connectome fingerprinting, we examined the stability of the connectome and additionally investigated which regions, connections and networks supported individual identification. Finally, we predicted cognitive and behavioural outcome based on functional connectivity.
Results
Multiple sclerosis patients showed connectome stability and identification accuracies similar to healthy individuals, with longer time delays between imaging sessions being associated with accuracies dropping from 89% to 76%. Lesion load, brain atrophy or cognitive impairment did not affect identification accuracies within the range of disease severity studied. Connections from the fronto-parietal and default mode network were consistently most distinctive, i.e., informative of identity. The functional connectivity also allowed the prediction of individual cognitive performances.
Conclusion
Our results demonstrate that discriminatory signatures in the functional connectome are stable over extended periods of time in multiple sclerosis, resulting in similar identification accuracies and distinctive long-lasting functional connectome fingerprinting signatures in patients and healthy individuals.
Keywords: Connectome Fingerprinting, multiple sclerosis, functional connectome, normative variation, resting state fMRII
Introduction
Magnetic resonance imaging (MRI) is a key element in the diagnosis of multiple sclerosis (MS). 1 However, standard clinical MRI markers such as lesion load or global brain atrophy show limited association with clinical disability. 2 Advanced imaging methods including resting-state fMRI (rs-fMRI) have provided stronger links to clinical symptoms, e.g., associations between altered network function and cognitive impairment3,4 or fatigue.5,6 Nonetheless, rs-fMRI is typically restricted to group-level analyses in research settings and rarely harnessed in clinical decision-making. 7 While group-level analyses have provided important insights into functional connectivity (FC) correlates of MS, they might obscure heterogeneity and biomarkers highly variable between patients. 8 Consequently, for fMRI to become more clinically useful, neuroimaging analyses might need to focus on individual variation in FC patterns and brain networks. 9 Functional connectome fingerprinting (FCF) contributes to this endeavour by moving from the univariate analysis of functional connections to the treatment of the functional connectome as one multivariate object, 10 thereby increasing the reliability and validity of FC and connectome-based analyses. An understanding of the normative variation in functional connectomes 11 and distinctive connectivity patterns underlying individual subject identification 12 as well as contrasting normative variation with pathological variation, can be a first step towards a more meaningful insight into connectome variation in different pathologies.
In FCF, the functional connectome (a map of an individual's FC between all brain regions) serves as a signature for the identification of an individual from a large dataset. While a relevant share of the functional connectome is similar between subjects, some critical features (especially in higher-order regions) vary consistently.12,13 These variations seem to be robust with respect to day-to-day variability, can be detected during different cognitive tasks, and appear to reflect stable individual differences such as personality traits. 14 FCF and the importance of stable and optimal fingerprints for cognitive performance have been studied extensively in healthy populations.12,15,16 However, its applicability in patients with neurological disorders is still being investigated. 17 In MS, the accumulation of white matter (WM) lesions, progressive brain atrophy, the wide range of MS-related FC alterations and the high inter-individual variability in lesional and non-lesional brain damage1,18 might have a profound impact on individual neurological signatures and thus on identifiability. As others have pointed out, 19 investigating pathological FC changes using FCF might result in characterization of pathological signatures of, e.g., MS accommodating both the high interindividual heterogeneity of FC patterns as well as the highly diverse FC changes in MS.
Here, we investigate the stability of functional connectome-based identification in a cohort of patients with MS and healthy individuals. Specifically, we examined whether MS affects identification accuracies resulting from functional connectome-based identification and whether MS impacts which parts of the functional connectome are most distinctive, i.e., which parts of the connectome are unique and stable over time in an analogue manner to a fingerprint. The following questions are addressed: (a) How stable are distinctive signatures of the connectome used during the identification of patients with MS and in healthy individuals across several years and are they affected by disease severity?; (b) Does the topology of individual signatures change over time in MS, e.g., due to lesion accumulation?; (c) Are functional connectome properties correlated with clinical and neuropsychological variables?
Methods
Patients and healthy individuals
We recruited 70 patients with relapsing-remitting MS (NCT01371071), diagnosed according to the 2017 McDonald criteria 20 and acquired imaging data, expanded disability status scale (EDSS) and neuropsychological data at multiple timepoints (Table 1). Clinically relevant disability progression was defined based on the EDSS (change of ≥1.5 points with EDSS = 0.0; ≥ 1.0 with EDSS > 1.0 21 ). The study received prior approval from the ethics committee of Charité-Universitätsmedizin Berlin (EA1/182/10). MRI data was prospectively acquired (Figure 1(1)) on a 3 T Siemens TIM Trio scanner (2010–2018) at the Berlin Center for Advanced Neuroimaging. In each patient, multiple sessions (median: 4, interquartile range (IQR): 2, range: 2–7) were collected across a median follow-up time of 18 months (IQR: 13, range: 1–48). We acquired (a) rs-fMRI (260 volumes,TR = 2250 ms,TE = 30 ms, resolution = 3.4 mm3,matrix = 64*64, flip angle = 90°) (b) MPRAGE: (resolution = 1 mm3,TE = 3.03 ms,TR = 1900 ms, matrix = 256 × 256, FOV = 256 mm, flip angle = 9°) and (c) FLAIR (resolution = 1 mm3,TE = 388 ms,TR = 6000 ms, matrix = 256 × 256, FOV = 256 mm).
Table 1.
Description of sample
| Group | MS patients | OASIS-3 dataset | Test statistics |
|---|---|---|---|
| Number of Participants | 70 | 273 | - |
| Number of Sessions | 234 | 700 | - |
| Age in years (mean ± SD) | 35.2 ± 8.1 | 65.9 ± 8.8 | t(69) = 72.68, p < 0.001 |
| Sex (m/f) | 49 f/21 m | 159 f/114 m | χ2(1) = 3.22, p = 0.07 |
| Time since first symptoms in months at first presentation (mean ± SD, n) | 3.5 ± 0.9, 70 | - | - |
| Patients with immunotherapy | 35 | - | - |
| Patients with relapse during examination period | 34 | - | - |
| EDSS (median, range, number of complete sessions, number of incomplete sessions) | 1.5, [0–3.5], 227, 7 | - | - |
| BRB-N PASAT3 (mean ± SD, number of complete sessions, number of incomplete sessions) | 51.9 ± 6.7, 210, 24 | - | - |
| BRB-N SDMT (mean ± SD, number of complete sessions, number of incomplete sessions) | 64.2 ± 12.8, 210, 24 | - | - |
| BDI-II (mean ± SD, number of complete sessions, number of incomplete sessions) | 6 ± 7.7, 145, 89 | - | - |
| MMSE (mean ± SD, number of complete subjects, number of incomplete subjects) | - | 28.89 ± 1.64, 267, 6 | - |
Medication in MS patients: interferon beta-1a (n = 10), interferon-beta-1b (5), dimethyl fumarate (9), glatiramer acetate (9), teriflunomide (2)#. MS: multiple sclerosis; mean: arithmetic mean; SD: standard deviation; n: number of sessions
Figure 1.
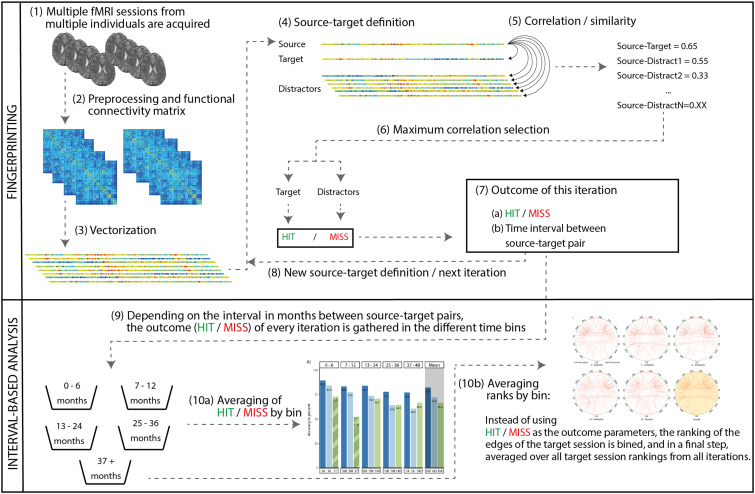
Overview of the identification pipeline. For more details on the individual steps, please refer to the methods section.
To validate our findings from the MS dataset with respect to the effect of time on FCF, we additionally analyzed 700 rs-fMRI sessions (median: 2; IQR: 1, range: 2–6) from 273 healthy individuals from the publicly available OASIS-3 dataset 22 with a median interval between sessions of 49 months (IQR: 41.75, range: 1–116). OASIS-3 is a longitudinal MRI dataset for normal aging and Alzheimer's disease. We included only healthy individuals without diagnosis and MMSE ≥ 28. OASIS-3-participants were also scanned using a 3 T Siemens TIM Trio. Data included rs-fMRI (164 volumes, resolution = 4 mm3, TR = 2200 ms, TE = 27 ms, matrix = 64*64, flip angle = 90°) and MPRAGE (resolution = 1 mm3, TR = 2400 ms, TE = 3.16 ms, flip angle = 8°).
Preprocessing
Preprocessing (SPM12/DPARSFA4.4) included realignment, bias field correction using FSLs epi_reg when fieldmaps were available (204/234 sessions), co-registration, 24-parameter nuisance regression, 23 low-pass filtering (0.01–0.1 Hz) and normalization for OASIS-3 data with 160 volumes and for MS data (260 volumes and – after removing 100 volumes – with matched 160 volumes, see supplementary methods). We matched the number of volumes between datasets to account for the effect of the number of volumes on identification accuracies. 15 Next (Figure 1(2)), we cross-correlated the region-wise time series (fconn-150 atlas, 24 278 ROIs), resulting in a z-scored FC matrix by fMRI-session. Each FC matrix (dimension 278*278) was flattened into a vector of 38.503 connections by removing the diagonal and upper triangle (Figure 1(3)). Next, we regressed out the effect of age from the FC matrices across both datasets using linear regression models in R (https://www.r-project.org/).
Additionally, we calculated the percentage brain volume change (PBVC) between source-target pairs of MPRAGE images from SIENA 25 and created WM lesion masks from co-registered FLAIR images (manually corrected: ITK-SNAP 26 ). To improve the accuracy of the brain segmentation, the SIENA pipeline included lesion filling of the MPRAGE images using FSL lesion_filling. 27
FCF and interval definition
We then performed FCF independently in the three preprocessed datasets (OASIS with 160 volumes, MS with 160 volumes and MS with 260 volumes). Briefly, we correlated a subject's vectorized connectome (source) with the connectome of the same subject at a different time point (target) and with the connectomes of all other subjects (distractors, Figure 1(4) and (5)). Then, the highest correlation coefficient between the source session and all other sessions (both target and distractors) was selected (Figure 1(6)). If it belonged to the target session, it was classified as a hit, otherwise as a miss (Figure 1(7)). After iterating through the dataset, an average identification rate was calculated (Figure 1(8)).
In this study, we averaged not across the entire dataset, but stratified fingerprinting iterations based on the time intervals (Figure 1(9)) between the source-target pairs, thereby extracting separate identification rates for different time bins (Figure 1(10a)). As an example, in a subject with four resting-state sessions, we would iteratively analyze all possible pair-wise source-target combinations from this subject (i.e., 6 iterations with 6 different source-target pairs and time intervals). Only two sessions of an individual were ever used in an FCF iteration (source and target session).
Finally, for patients, we investigated the effect of disease progression defined through WM lesion volume (normalized using a logarithmic scaling factor), EDSS scores, or PBVC on identification accuracies using two approaches. First, we modelled the binary identification outcome (identification/misidentification) based on the change in WM lesion volume, EDSS score, or PBVC between source-target pairs and investigated whether the explanatory variables had a significant effect on the binary outcome measure. Secondly, we tested whether there were significant differences in identification accuracies between the most and least affected patients (χ2). We defined the most versus least affected cases by splitting the patient group into quartiles based on the same variables (WM lesions load, EDSS, PBVC) and selecting the highest and the lowest quartiles for comparison.
Importance of connections
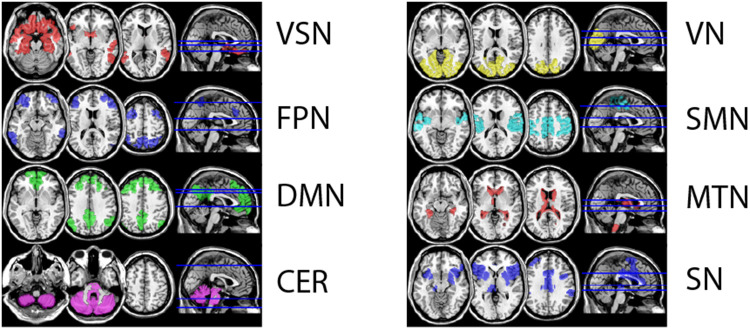
To evaluate the distinctiveness of connections (Figure 1(10b)), we (a) calculated the connection-wise absolute difference between the source, target, and all distractors in each iteration, resulting in a matrix with ∼230 sessions* 38.503 connections. We then (b) ranked the absolute differences along the first dimension and saved the rank of the target session, reflecting a connection's similarity between the source and target relative to the connection's similarity with distractors. After (c) iterating through the source-target pairings and (d) averaging all extracted ranks across subjects, we obtained the cross-subject mean rank per connection and (e) visualized the 99.5th percentile using the same cut-off as in Finn et al. 2015. 12 Finally, we categorized connections into clustered resting-state networks based on independent fMRI data from 33 healthy individuals from another study with the same MRI protocol (Figure 2), comparing the number of distinctive connections (normalized by network size) between different resting-state and calculated effect sizes (Cohen's d) to allow for robust interpretation.
Figure 2.
Visualization of the eight defined resting-state networks Network definitions resulted from repeated (n = 5000) kmeans clustering of 33 fMRI resting-state sessions from an independent sample. fMRI was acquired with the same protocol as the patient group.
Clinical and cognitive measures
Finally, we predicted the performance in EDSS, SDMT (Symbol Digit Modalities Test), PASAT3 (Paced Auditory Serial Addition Test) and BDI-II (Beck Depression Inventory Revision) based on the concurrent individual functional connectomes using Leave-One-Out-Cross-Validation (LOOCV), i.e., we used the functional connectome at a specific timepoint to predict the behavioural or cognitive measure at the same timepoint. In each LOOCV-fold, one individual was defined as the test set, and all MRI sessions of this subject were put aside. For this LOOCV-fold, we then build a training data set, using the MRI data of all other individuals, including all time points. Subsequently, we used the training set to identify the edges most strongly correlated with the outcome parameter and – using the 99.9th percentile of most correlated edges – built a linear model. We limited the number of edges to the 99.9th percentile to prevent the number of predictive parameters from exceeding the number of available samples. Using this model, we then predicted the outcome parameters based on the FC of the individual in the test set (i.e., in all sessions of the left-out patient). After leaving-out each patient once and predicting each patient's outcomes, we calculated the Pearson correlation of observed and predicted scores to evaluate the predictive power. 28
We then visualized the connections used in the linear models. Based on previous work, 29 we focused on connections selected in >80% of the LOOCV folds. Finally, we calculated the overlap (Jaccard-index) between the 99.5th percentile of distinctive connections (FCF) and the connections used in >80% of LOOCV-folds (prediction).
Results
Clinical description of ms patients
At baseline, patients had a median disease duration of 4 months (range = 0–11) and showed a median EDSS of 1.5 (range = 0.0–3.5). In total, 16 patients showed a clinically relevant increase in disability, 46 remained stable, 8 improved. MRI analysis showed typical lesion patterns (median lesion number: 11, IQR: 18.75, range: 1–103; median volume in ml: 0.78, IQR: 1.71, range: 0.04–16.84), and increasing lesion volume in 59 patients.
Stability of identification in MS and in healthy individuals over time
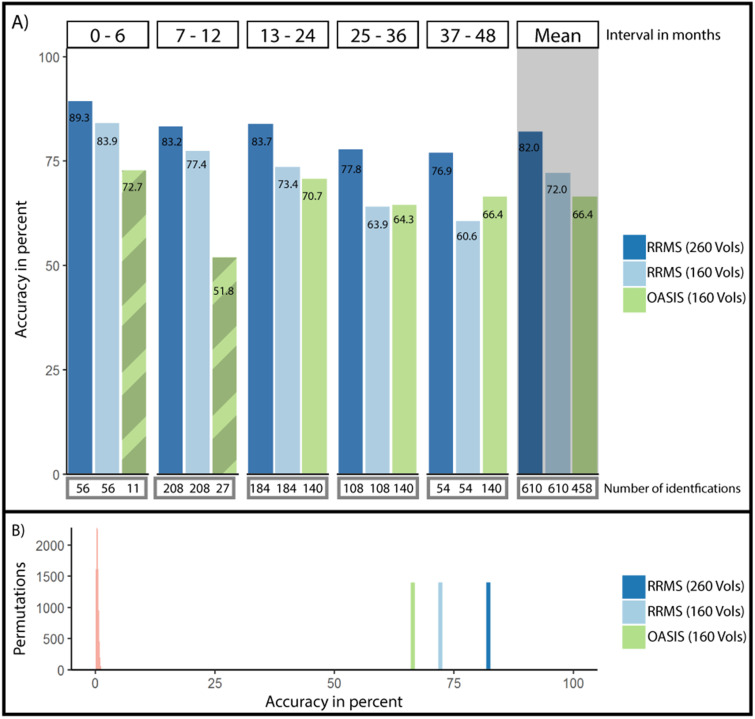
First, we analyzed the accuracy of FCF in MS patients, which was 82% using the complete 260-volume fMRI sessions (Figure 3(A)). The shortest follow-up (0–6 months), i.e., identifications of source-target pairs with ≤ 6 months between imaging sessions, yielded the highest accuracy (89.3%). The longest follow-up (37–48 months) resulted in the lowest accuracy (76.9%). A logistic regression with follow-up time as predictor and identification/misidentification as outcome resulted in a trend towards a negative effect of follow-up time on accuracy (df(609), z = −1.771, p = 0.077, Table 2, Supplemental Figure 3 for the relation of other measures of connectome stability and follow-up time).
Figure 3.
Accuracy of single-subject identification in between-session intervals of up to 48 months. (A) Average accuracy of single-subject identification split by the amount of time passed between the acquisition of the source session and the target session. Connectome fingerprinting accuracy remained high over extended periods of time. Below each bin, the number of source-target pairs underlying the calculated average identification rate is listed. Mean identification rates across all intervals are depicted to the right with grey background. Note the limited data available in the first two time bins for the healthy individuals in the OASIS-3 dataset (hatched bars). (B) Average accuracy in the patient group with 160 and 260 volumes as well as in the healthy group compared to identification rates achieved through permutation testing with randomized labels (5000 permutations, light red to the left).
Table 2.
Summary of logistic regression models examining the effect of time in months on identification accuracies both in the group of patients with multiple sclerosis (with 160 and 260 resting-state volumes) as well as in the group of healthy individuals (OASIS-3 group).
| MS (260 volumes) | MS (160 volumes) | OASIS-3 (160 volumes) | ||||
|---|---|---|---|---|---|---|
| Odds ratio | z-val/p-val | Odds ratio | z-val/p-val | Odds ratio | z-val/p-val | |
| Intercept | 1.78 | 8.44 / < 0.001 | 1.41 | 7.56 / < 0.001 | 1.17 | 7.63/ < 0.001 |
| Time in months | −0.014 | −1.68/0.093 | −0.019 | −2.43/ < 0.05 | −0.016 | −6.11/ < 0.001 |
We observed a significant negative effect of time in both groups with 160 resting-state volumes and a trend towards a negative effect in MS data with 260 volumes.
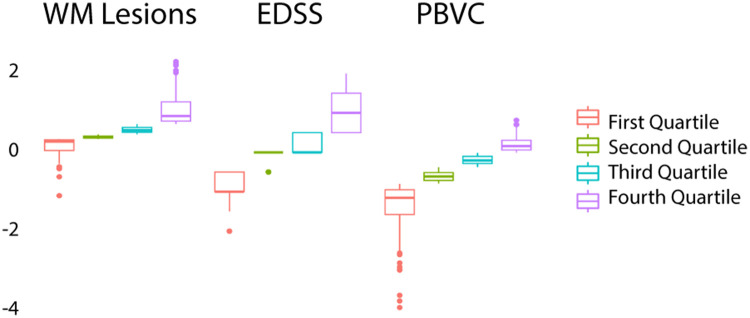
Second, we investigated longitudinally whether disease severity or structural MRI characteristics affected fingerprinting accuracies. In a logistic regression model, we found no significant effect of increasing WM lesion volumes (df(327), p = 0.81), increasing EDSS scores (df(304), p = 0.83) or PBVC (df(286), p = 0.88) on identification rates. Additionally, we investigated whether these variables affected identification rates, comparing only those source-target pairs with the largest change (choosing only cases from the lowest and highest quartile, Figure 4/Table 3). Accuracies did not differ significantly between the highest and lowest quartile based on the WM lesion volume (82.5% vs. 86.7%, χ2(1163) = 0.29, p = 0.59), EDSS increase (82.7% vs. 81.2%, χ2(1152) < 0.001, p = 1) or PBVC (87.3% vs. 77.7%, χ2(1143) = 1.64, p = 0.19).
Figure 4.
Distribution in quartiles for change of WM lesions load in ml, EDSS scores and PBVC between target-source pairs. WM: white matter; PBVC: percentage brain volume change.
Table 3.
Description of the lowest and highest quartile data for changes in WM lesion volume, EDSS and PBVC between sessions.
| Lowest quartile (n, median, IQR, [range]) | Highest quartile (n, median, IQR, [range]) | |
|---|---|---|
| WM lesion vol change (in ml) | 83, −0.03, 0.12, [−0.47, 0] | 80, 0.37, 0.46, [0.22, 2.90] |
| EDSS change | 77, −1, 0.5, [−2, −0.5] | 75, 1, 1, [0.5, 2] |
| PBVC | 72, −1.16, 0.63, [−3.94, −0.80] | 71, 0.16, 0.25, [−0.01, 0.814] |
WM: white matter; PBVC: percentage brain volume change; IQR: interquartile range.
Third, we contrasted accuracies between patients with 260 and 160 volumes and healthy individuals with 160 volumes. Accuracies with a follow-up time of up to 48 months in healthy individuals and patients (260 volumes) differed significantly (66.4% vs. 81.9%, χ2(1766) = 21.16, p < 0.001; Figure 3(A)). However, after controlling for fMRI quality by matching the number of fMRI volumes to 160 volumes, these differences were no longer significant (66.4% vs. 72%, χ2(1766) = 2.052, p = 0.15).
Fourth, we examined whether accuracies differed from chance level using permutation testing. In all groups and intervals, no permutation iteration exceeded accuracies with non-permuted labels (e.g., MS-260 volumes: meanperm = 0.55%, sdperm = 0.54, nperm = 10,000, p < 0.001, Figure 3(B); other groups showed similar or worse permuted identification rates).
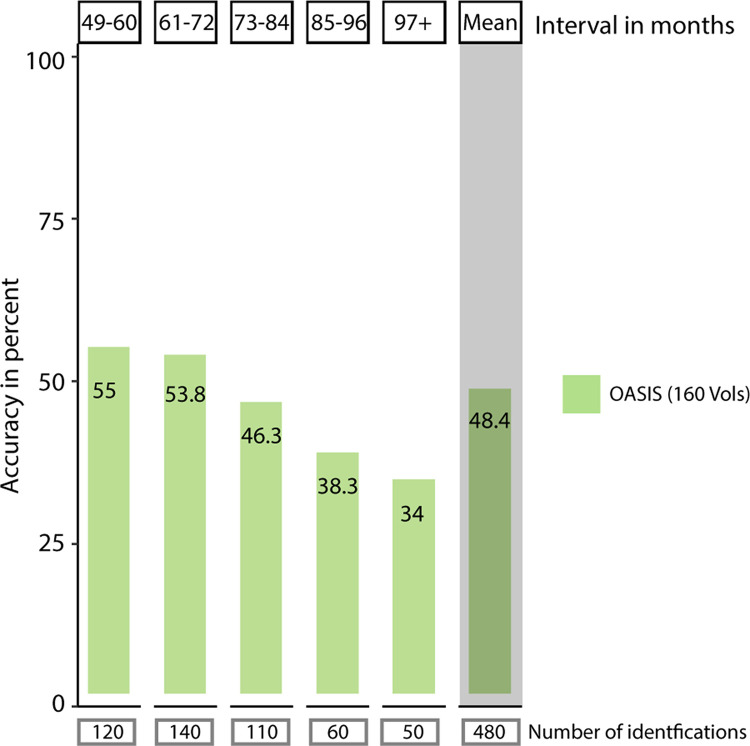
Finally, we explored the longer follow-up intervals available in the OASIS-3 dataset. Identification rates dropped from 70.7% (13-24 months) to 55% (49-60 months, Figure 5), reaching a minimum of 34% (> 97 months). Logistic regression showed a negative effect of interval length on accuracy (df(937), z = −5.84, p < 0.001, Table 2).
Figure 5.
Accuracy of single-subject identification in the OASIS dataset in intervals with more than 48 months between sessions. Average accuracy of single-subject identification split by the amount of time passed between the acquisition of the source session and the target session. Identification rates dropped after 48 months to 55%, with a further drop after 85 months to 38.3%. In intervals of 5 to 7 years, one in two subjects is still identified correctly. Below each bin, the number of source-target pairs underlying the calculated average identification rate is listed. The mean identification rate across all intervals longer than 48 months is depicted to the right with grey background.
Topology of signatures over time in MS
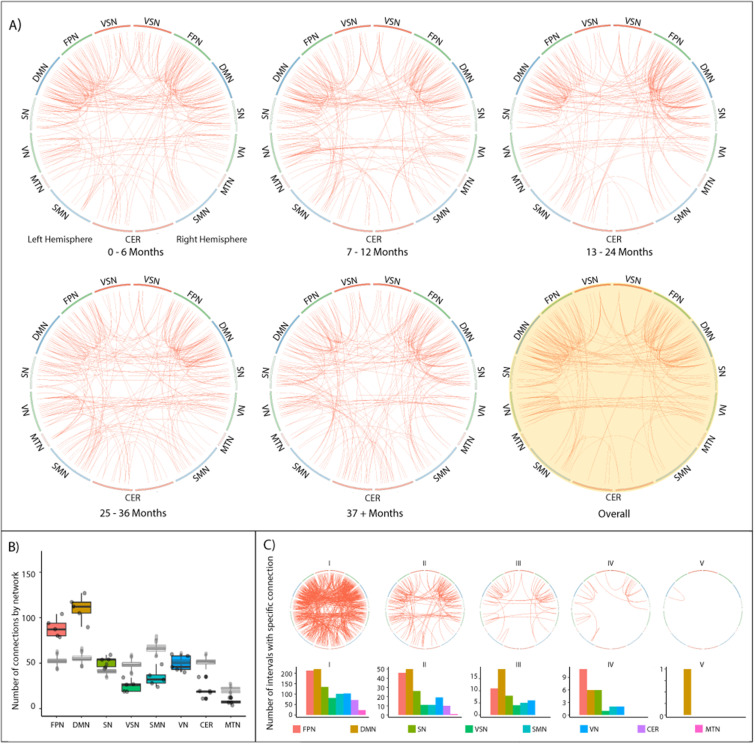
Next, we investigated the stability of distinctive connections in patients. Initially, we assessed whether the ratio of distinctive connections by resting-state network remained stable. We, therefore, quantified the contribution of resting-state networks to individual identification. We found that the number of highly distinctive connections (99.5th percentile of intra-similarity ranking) was significantly different between networks (F(7,32) = 67.3, p < 0.001; Figure 6(B)), with the FPN and DMN showing higher numbers of distinctive connections than any other network (d > 2.33; all following post-hoc comparisons: Tukey, p < 0.001). At the same time, the MTN presented fewer distinctive connections than all other networks (d > 1.71). Also, the SN, as well as the VN were less distinctive than the FPN and DMN (d > 2.33), but more distinct than the CER, MTN and VSN (d > 2.98). Averaging across fingerprinting iterations without differentiating by interval, 64% of the most distinctive connections were related to at least one region from the FPN, DMN or SN (Figure 6(A), yellow circle).
Figure 6.
Stable connectivity signatures and most distinctive edges during identification in MS patients. (A) Circle plots are arranged symmetrically, with the left half representing regions from the left hemisphere. Red lines indicate the 99.5th percentile of distinctive edges, i.e., connections that ranked highest in similarity and which consistently – averaged over all subjects – yielded the smallest difference between source and target session. The yellow-shaded circle plot shows the connection signatures averaged over all intervals. Generally, intra-hemispheric connections between and within the FPN and DMN a highly represented. Unimodal resting-state networks such as VN or SMN are consistently less distinctive. (B) The number of distinctive edges split by different resting-state networks. DMN, FPN and SN consistently connect with more distinctive edges than all other networks. In grey, results from permutation are overlaid, showing significantly higher numbers of distinctive edges in DMN, FPN and SN, as well as significantly lower numbers in all other networks . No shift in network importance occurred during the 4 years of observation. (C) Visualization of the stability of single edges. Edges are visualized according to their frequency of appearance in different intervals. The leftmost circle plot visualizes edges that are amongst the 99.5th percentile of most distinctive edges in one interval, the rightmost plot visualizes those edges that are amongst the 99.5th percentile of most distinctive edges in all five intervals. The bar plot below visualizes the distribution split by resting-state network.
Subsequently, we investigated which connections would be in the 99.5th percentile of distinctive connections in all (or multiple) follow-up intervals, indicating whether any connections were consistently distinctive over time (Figure 6(C)). All networks except for the MTN and cerebellar network had connections that were selected in at least 3 of 5 intervals. Only the DMN showed connections from the 99.5th percentile in every interval. Analyzing the OASIS-3 dataset and MS patients using 160 volumes lead to similar results (Supplemental Figures 1 and 2), albeit smaller and less consistent.
Prediction of clinical and cognitive measures
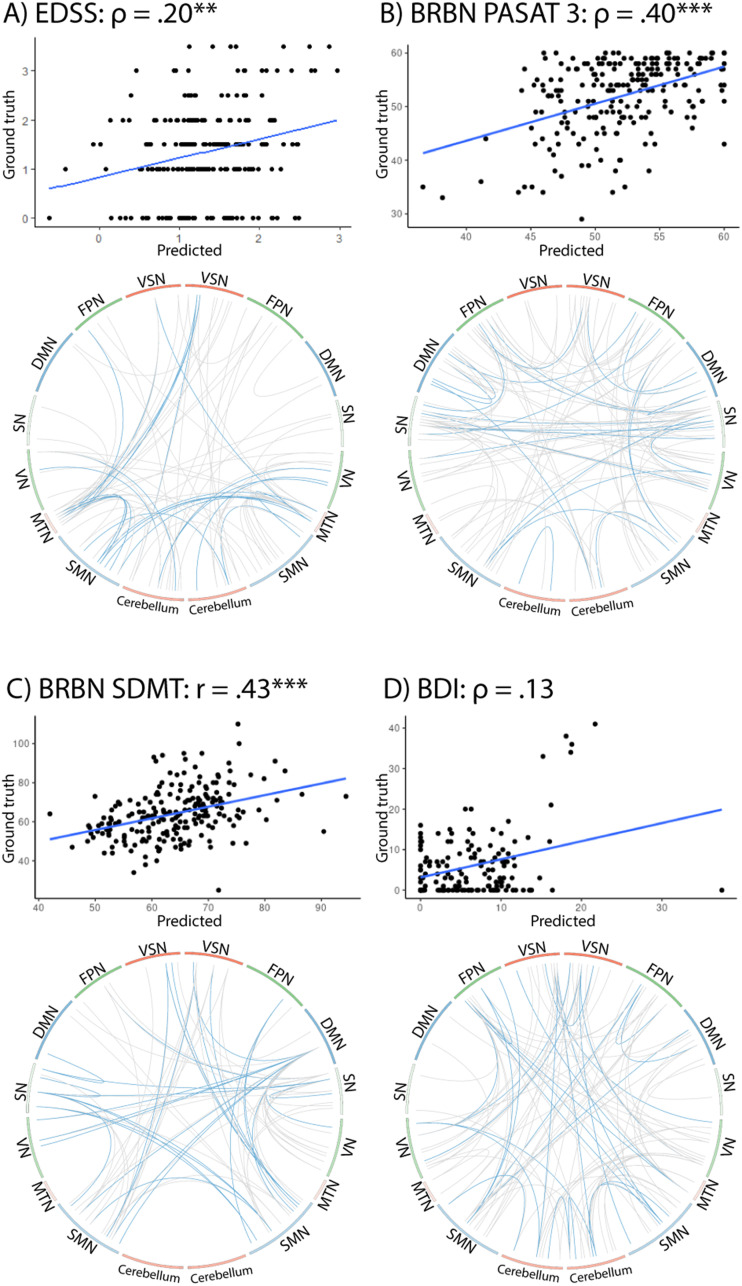
Finally, we predicted individual performance in behavioural and cognitive tasks based on the functional connectome. Using complete fMRI scans with 260 volumes from MS patients, a cross-validated linear model (LOOCV) resulted in significant correlations between the true scores of patients and the predicted values for the EDSS (rs(225) = 0.20, p < 0.01), PASAT3 (rs(209) = 0.40, p < 0.001) and SDMT (r(209) = 0.43, p < 0.001) (Figure 7), but not for the BDI (rs(143) = 0.13, p = 12.).
Figure 7.
Connectivity patterns associated with the prediction of disability status and behavioural variables. For each variable, we visualize (top) the relation between a subject's predicted value and the ground truth in the corresponding task, computed with a Leave-One-Out-Cross-Validation (LOOCV) linear model (Correlation values are marked according to their significance: ** p < 0.01; *** p < 0.001) and (bottom) the edges that were used during the computation of the linear model, based on their high correlation with the outcome variable in the test data. Blue lines show edges selected in at least 80% of cross-validation flds, grey lines show edges selected at least once. For EDSS, PASAT3 and SDMT, we observed clear patterns and significant predictions, whilst BDI prediction was non-significant and edges more distributed.
EDSS prediction was supported by the VN, MTN and cerebellar networks. The prediction of PASAT3 scores relied more heavily on connections in the DMN and SN, while the SN together with the SMN was underlying the prediction of SDMT scores. Interestingly, the overlap of predictive network patterns supporting the prediction of clinical and cognitive variables and distinctive network patterns supporting single-subject identification was non-significant for EDSS, PASAT3 or SDMT (Jaccard < 0.01, permutation derived p > 0.295, nperm = 10,000).
Discussion
Using FCF, we investigated the long-term stability of distinctive connectome signatures in a sample of patients with early, relatively mild MS and in healthy individuals. Overall, our results show stable individual signatures across time and despite accumulating neurological damage. We found high identification accuracies (up to 89%) and similar identification rates between healthy individuals and patients once MRI parameters were appropriately controlled. With increasing follow-up time between source and target MRI acquisitions, accuracies declined in patients and healthy individuals. In patients and healthy individuals, connections from multimodal resting-state networks such as the FPN and the DMN were most distinctive and contributed most to identification, remaining stable even with longer follow-up times. WM lesion load, patient disability and the amount of brain atrophy did not significantly affect identification rates. Finally, we were able to significantly predict disease severity and cognitive performance in the left-out cases and identified the most predictive networks. As investigated previously, 13 these predictive patterns did not significantly overlap with distinctive patterns contributing to fingerprinting.
Stability of the functional connectome despite brain damage
While most fingerprinting studies relied on sessions in close temporal proximity (see 35 for an exception with intervals of up to 3 years), we expanded fingerprinting intervals to 4 years in patients and 9 years in healthy individuals. We observed remarkable connectome stability in patients, with similar accuracies between patients and healthy individuals. Splitting the patient sample into least and most affected quartiles based on lesion volume, EDSS or PBVC revealed no difference in identifiability or in distinctive resting-state networks between severely affected patients, less severely affected patients or healthy individuals. We suggest that single-subject identification was robust because the FC changes induced by disease progression are minor compared to a large amount of variance of an individual's functional connectome explained by both an individual's unique signature and common organizational principles of the functional connectome. 14
Distinctive networks supporting identification
We observed distinctive connections in the higher-order multimodal resting-state networks12,13 – which exhibit high inter-subject variability 30 – including the DMN and FPN. Unimodal networks such as the SMN contained fewer distinctive connections. Unimodal networks, primarily located in phylogenetically older regions, show lower cortical folding and lower inter-subject variability, 30 possibly leading to less differentiated neurological fingerprints during brain maturation. 26 These patterns of distinctive networks underlying the identification remained consistent over time, pointing to the long-term durability of individual signatures.
Connectome patterns associated with clinical and neuropsychological measures
Finally, we investigated the functional connectome's potential in predicting levels of cognitive performance and disability. The prediction of SDMT was supported by connections between the SMN and the SN and the VSN. This is in line with previously observed and possibly maladaptive increases of FC in the SMN in early MS. 31 PASAT performance was associated with intra-DMN connections (where grey matter atrophy correlates with PASAT performance 32 ) and connections between the DMN, SN and intra-SN. Similar to previously described correlations of disability in MS with cerebellar atrophy and changes of cerebellar FC, 33 the prediction of disability (EDSS) was supported by connections between the cerebellar network, the SMN and MTN. While our analysis revealed some overlap between networks with the most distinctive connections and networks with the most predictive connections (e.g., DMN for PASAT), previous research 13 has shown that this overlap is restricted to a network-level analysis. Meanwhile, connection-level analysis revealed an anti-correlation of connections supporting identification (usually connections with high variability across individuals) and connections supporting the prediction of clinical and neuropsychological measures (usually connections with medium variability across individuals).
Limitations
The relatively early disease stage of our sample and the mostly low disease burden might have affected our analysis. On the other hand, patients with MS have been shown to exhibit a multitude of FC changes during early disease stages 34 and our findings persisted even when comparing the most and least affected patients.
Additionally, there were differences between the healthy individuals and our patient cohort with respect to age, the number of volumes in the fMRI-sessions, and in MRI acquisition parameters. 15 While we matched the number of volumes and controlled for the effect of age during the construction of the FC matrices, the differences in MRI acquisition parameters remained and limit the interpretability of direct comparisons between the groups.
Still, modifications of the current paradigm 7 such as clinical connectome fingerprinting 17 could in the future replace the binarized approach taken here and instead, investigate connectome-wide deviations of patients from healthy norms. These approaches could detect aberrant stability in distinctive signatures of the functional connectome in early disease stages of MS 34 and better handle other issues brought about by e.g., large numbers of features by participant, a highly variable localization of neurological damage, and differences in fMRI protocol. 15
Conclusion
Our study found that the human functional connectome remains stable over extended periods, with individual signatures lasting up to 9 years. Even in patients with MS and likely brain damage, stability and identifiability were maintained, indicating the connectome's resilience. The interpretation of FC changes in MS should consider the overall stability of large parts of the global functional connectome.
Supplemental Material
Supplemental material, sj-docx-1-mso-10.1177_20552173231195879 for Functional connectome fingerprinting and stability in multiple sclerosis by Maron Mantwill, Susanna Asseyer, Claudia Chien, Joseph Kuchling, Tanja Schmitz-Hübsch, Alexander U Brandt, John-Dylan Haynes, Friedemann Paul and Carsten Finke in Multiple Sclerosis Journal – Experimental, Translational and Clinical
Supplemental material, sj-doc-2-mso-10.1177_20552173231195879 for Functional connectome fingerprinting and stability in multiple sclerosis by Maron Mantwill, Susanna Asseyer, Claudia Chien, Joseph Kuchling, Tanja Schmitz-Hübsch, Alexander U Brandt, John-Dylan Haynes, Friedemann Paul and Carsten Finke in Multiple Sclerosis Journal – Experimental, Translational and Clinical
Footnotes
Data availability: The data that support the findings of this study are available from the corresponding author, MM, upon reasonable request.
The authors declared no potential conflicts of interest with respect to the research, authorship, and/or publication of this article
Funding: The authors disclosed receipt of the following financial support for the research, authorship, and/or publication of this article: This study was funded by the German Research Foundation, grant numbers 327654276 (SFB 1315), FI 2309/1-1, and FI 2309/2-1, by the Berlin Institute of Health, a Rahel Hirsch scholarship and by a federal stipend of Berlin (Elsa-Neumann Stipendium). C.C. has received research funding from Novartis and Alexion, unrelated to this study, and is a member of the Standing Committee on Science for the Canadian Institutes of Health Research. S.A. received payment of honoraria from Alexion, Bayer AG and Roche. F.P. received travel funding and/or speaker honoraria from Bayer, Novartis, Biogen, Teva, Sanofi-Aventis/Genzyme, Merck Serono, Alexion, Chugai, MedImmune, and Shire and received research support from Bayer, Novartis, Biogen, Teva, Sanofi-Aventis/Geynzme, Alexion, Merck Serono, from the German Research Council, Werth Stiftung of the City of Cologne, German Ministry of Education and Research, Arthur Arnstein Stiftung Berlin, EU FP7 Framework Program, Arthur Arnstein Foundation Berlin, Guthy-Jackson Charitable Foundation, and NMSS; OASIS-3 data was funded through the following grants: P50 AG05681, P01 AG03991, R01 AG021910, P50 MH071616, U24 RR021382, R01 MH56584.
ORCID iDs: Maron Mantwill https://orcid.org/0000-0001-6380-5672
Susanna Asseyer https://orcid.org/0000-0001-6289-1791
Claudia Chien https://orcid.org/0000-0001-8280-9513
Alexander U Brandt https://orcid.org/0000-0002-9768-014X
Supplemental material: Supplemental material for this article is available online.
Contributor Information
Maron Mantwill, Department of Neurology, Charité-Universitätsmedizin Berlin, Berlin, Germany; Faculty of Philosophy, Berlin School of Mind and Brain, Humboldt-Universität zu Berlin, Berlin, Germany.
Susanna Asseyer, A cooperation between the Max Delbrück Center for Molecular Medicine in the Helmholtz Association and Charité-Universitätsmedizin, Experimental and Clinical Research Center, Berlin, Germany; Neuroscience Clinical Research Center, Charité-Universitätsmedizin Berlin, Berlin, Germany; Experimental and Clinical Research Center, Charité-Universitätsmedizin Berlin, Berlin, Germany; Max Delbrück Center for Molecular Medicine in the Helmholtz Association (MDC), Berlin, Germany.
Claudia Chien, A cooperation between the Max Delbrück Center for Molecular Medicine in the Helmholtz Association and Charité-Universitätsmedizin, Experimental and Clinical Research Center, Berlin, Germany; Neuroscience Clinical Research Center, Charité-Universitätsmedizin Berlin, Berlin, Germany; Max Delbrück Center for Molecular Medicine in the Helmholtz Association (MDC), Berlin, Germany; Department of Psychiatry and Neurosciences, Charité-Universitätsmedizin Berlin, Charitéplatz, Berlin, Germany.
Joseph Kuchling, Department of Neurology, Charité-Universitätsmedizin Berlin, Berlin, Germany; A cooperation between the Max Delbrück Center for Molecular Medicine in the Helmholtz Association and Charité-Universitätsmedizin, Experimental and Clinical Research Center, Berlin, Germany; Neuroscience Clinical Research Center, Charité-Universitätsmedizin Berlin, Berlin, Germany; Berlin Institute of Health, Berlin, Germany.
Tanja Schmitz-Hübsch, A cooperation between the Max Delbrück Center for Molecular Medicine in the Helmholtz Association and Charité-Universitätsmedizin, Experimental and Clinical Research Center, Berlin, Germany; Neuroscience Clinical Research Center, Charité-Universitätsmedizin Berlin, Berlin, Germany; Experimental and Clinical Research Center, Charité-Universitätsmedizin Berlin, Berlin, Germany; Max Delbrück Center for Molecular Medicine in the Helmholtz Association (MDC), Berlin, Germany.
Alexander U Brandt, A cooperation between the Max Delbrück Center for Molecular Medicine in the Helmholtz Association and Charité-Universitätsmedizin, Experimental and Clinical Research Center, Berlin, Germany; Experimental and Clinical Research Center, Charité-Universitätsmedizin Berlin, Berlin, Germany; Max Delbrück Center for Molecular Medicine in the Helmholtz Association (MDC), Berlin, Germany; Department of Neurology, University of California, Irvine, CA, USA.
John-Dylan Haynes, Faculty of Philosophy, Berlin School of Mind and Brain, Humboldt-Universität zu Berlin, Berlin, Germany; Berlin Center for Advanced Neuroimaging, Charité-Universitätsmedizin Berlin, Berlin, Germany; Bernstein Center for Computational Neuroscience, Charité-Universitätsmedizin Berlin, Berlin, Germany.
Friedemann Paul, Department of Neurology, Charité-Universitätsmedizin Berlin, Berlin, Germany; A cooperation between the Max Delbrück Center for Molecular Medicine in the Helmholtz Association and Charité-Universitätsmedizin, Experimental and Clinical Research Center, Berlin, Germany; Neuroscience Clinical Research Center, Charité-Universitätsmedizin Berlin, Berlin, Germany; Experimental and Clinical Research Center, Charité-Universitätsmedizin Berlin, Berlin, Germany; Max Delbrück Center for Molecular Medicine in the Helmholtz Association (MDC), Berlin, Germany; Berlin Institute of Health, Berlin, Germany.
References
- 1.Kuchling J, Paul F. Visualizing the central nervous system: Imaging tools for multiple sclerosis and neuromyelitis optica spectrum disorders. Front Neurol 2020; 11: 450. [DOI] [PMC free article] [PubMed] [Google Scholar]
- 2.Wattjes MP, Ciccarelli O, Reich DS, et al. 2021 MAGNIMS–CMSC–NAIMS consensus recommendations on the use of MRI in patients with multiple sclerosis. Lancet Neurol 2021; 20: 653–670. [DOI] [PubMed] [Google Scholar]
- 3.Huiskamp M, Eijlers AJC, Broeders TAA, et al. Longitudinal network changes and conversion to cognitive impairment in multiple sclerosis. Neurology 2021; 97: 10.1212/WNL.0000000000012341. [DOI] [PMC free article] [PubMed] [Google Scholar]
- 4.Rocca MA, Valsasina P, Leavitt VM, et al. Functional network connectivity abnormalities in multiple sclerosis: correlations with disability and cognitive impairment. Mult Scler J 2018; 24: 459–471. [DOI] [PubMed] [Google Scholar]
- 5.Finke C, Schlichting J, Papazoglou S, et al. Altered basal ganglia functional connectivity in multiple sclerosis patients with fatigue. Mult Scler J 2015; 21: 925–934. [DOI] [PubMed] [Google Scholar]
- 6.Jaeger S, Paul F, Scheel M, et al. Multiple sclerosis-related fatigue: altered resting-state functional connectivity of the ventral striatum and dorsolateral prefrontal cortex. Mult Scler J 2019; 25: 554–564. [DOI] [PubMed] [Google Scholar]
- 7.Finn ES, Rosenberg MD. Beyond fingerprinting: Choosing predictive connectomes over reliable connectomes. NeuroImage 2021; 239: 118254. doi: 10.1016/j.neuroimage.2021.118254 [DOI] [PubMed] [Google Scholar]
- 8.Tahedl M, Levine SM, Greenlee MW, et al. Functional connectivity in multiple sclerosis: Recent findings and future directions [Internet]. Front Neurol 2018; 9, https://www.frontiersin.org/articles/10.3389/fneur.2018.00828/full (accessed 10 January 2019). [DOI] [PMC free article] [PubMed] [Google Scholar]
- 9.Satterthwaite TD, Xia CH, Bassett DS. Personalized neuroscience: Common and individual-specific features in functional brain networks. Neuron 2018; 98: 243–245. [DOI] [PubMed] [Google Scholar]
- 10.Yoo K, Rosenberg MD, Noble S, et al. Multivariate approaches improve the reliability and validity of functional connectivity and prediction of individual behaviors. NeuroImage 2019; 197: 212–223. [DOI] [PMC free article] [PubMed] [Google Scholar]
- 11.Jalbrzikowski M, Liu F, Foran W, et al. Functional connectome fingerprinting accuracy in youths and adults is similar when examined on the same day and 1.5-years apart. Hum Brain Mapp 2020; 41: 4187–4199. [DOI] [PMC free article] [PubMed] [Google Scholar]
- 12.Finn ES, Shen X, Scheinost D, et al. Functional connectome fingerprinting: identifying individuals using patterns of brain connectivity. Nat Neurosci 2015; 18: 1664–1671. [DOI] [PMC free article] [PubMed] [Google Scholar]
- 13.Mantwill M, Gell M, Krohn Set al. et al. Brain connectivity fingerprinting and behavioural prediction rest on distinct functional systems of the human connectome. Commun Biol 2022; 5: 261. [DOI] [PMC free article] [PubMed] [Google Scholar]
- 14.Gratton C, Laumann TO, Nielsen AN, et al. Functional brain networks are dominated by stable group and individual factors, not cognitive or daily variation. Neuron 2018; 98: 439–452.e5. [DOI] [PMC free article] [PubMed] [Google Scholar]
- 15.Waller L, Walter H, Kruschwitz JD, et al. Evaluating the replicability, specificity, and generalizability of connectome fingerprints. NeuroImage 2017; 158: 371–377. [DOI] [PubMed] [Google Scholar]
- 16.Corriveau A, Yoo K, Kwon YH, et al. Functional connectome stability and optimality are markers of cognitive performance. Cereb CORtex 2022; 33: bhac396. [DOI] [PMC free article] [PubMed] [Google Scholar]
- 17.Sorrentino P, Rucco R, Lardone A, et al. Clinical connectome fingerprints of cognitive decline. NeuroImage 2021; 238: 118253. [DOI] [PubMed] [Google Scholar]
- 18.Azevedo CJ, Cen SY, Jaberzadeh A, et al. Contribution of normal aging to brain atrophy in MS. Neurol - Neuroimmunol Neuroinflammation 2019; 6: e616. [DOI] [PMC free article] [PubMed] [Google Scholar]
- 19.Stampacchia S, Asadi S, Tomczyk S, et al. Fingerprinting of brain disease: Connectome identifiability in cognitive decline and neurodegeneration [Internet]. Neuroscience 2022, http://biorxiv.org/lookup/doi/10.1101/2022.02.04.479112 (accessed 4 January 2023). [Google Scholar]
- 20.Thompson AJ, Banwell BL, Barkhof F, et al. Diagnosis of multiple sclerosis: 2017 revisions of the McDonald criteria. Lancet Neurol 2018; 17: 162–173. [DOI] [PubMed] [Google Scholar]
- 21.Kappos L, Butzkueven H, Wiendl H, et al. Greater sensitivity to multiple sclerosis disability worsening and progression events using a roving versus a fixed reference value in a prospective cohort study. Mult Scler J 2018; 24: 963–973. [DOI] [PMC free article] [PubMed] [Google Scholar]
- 22.LaMontagne PJ, Keefe S, Lauren W, et al. OASIS-3: longitudinal neuroimaging, clinical, and cognitive dataset for normal aging and Alzheimer’s disease. Alzheimers Dement 2018; 14: P1097. [Google Scholar]
- 23.Friston KJ, Williams S, Howard R, et al. Movement-Related effects in fMRI time-series. Magn Reson Med 1996; 35: 346–355. [DOI] [PubMed] [Google Scholar]
- 24.Shen X, Tokoglu F, Papademetris Xet al. et al. Groupwise whole-brain parcellation from resting-state fMRI data for network node identification. NeuroImage 2013; 82: 403–415. [DOI] [PMC free article] [PubMed] [Google Scholar]
- 25.Smith SM, De Stefano N, Jenkinson Met al. et al. Normalized accurate measurement of longitudinal brain change. J Comput Assist Tomogr 2001; 25: 466–475. [DOI] [PubMed] [Google Scholar]
- 26.Kaufmann T, Alnæs D, Doan NT, et al. Delayed stabilization and individualization in connectome development are related to psychiatric disorders. Nat Neurosci 2017; 20: 513–515. [DOI] [PubMed] [Google Scholar]
- 27.Battaglini M, Jenkinson M, De Stefano N. Evaluating and reducing the impact of white matter lesions on brain volume measurements. Hum Brain Mapp 2012; 33: 2062–2071. [DOI] [PMC free article] [PubMed] [Google Scholar]
- 28.Yang FN, Hassanzadeh-Behbahani S, Bronshteyn M, et al. Connectome-based prediction of global cognitive performance in people with HIV. NeuroImage Clin 2021; 30: 102677. [DOI] [PMC free article] [PubMed] [Google Scholar]
- 29.Nostro AD, Müller VI, Varikuti DP, et al. Predicting personality from network-based resting-state functional connectivity. Brain Struct Funct 2018; 223: 2699–2719. [DOI] [PMC free article] [PubMed] [Google Scholar]
- 30.Mueller S, Wang D, Fox MD, et al. Individual variability in functional connectivity architecture of the human brain. Neuron 2013; 77: 586–595. [DOI] [PMC free article] [PubMed] [Google Scholar]
- 31.Has Silemek AC, Fischer L, Pöttgen J, et al. Functional and structural connectivity substrates of cognitive performance in relapsing remitting multiple sclerosis with mild disability. NeuroImage Clin 2020; 25: 102177. [DOI] [PMC free article] [PubMed] [Google Scholar]
- 32.Matias-Guiu JA, Cortés-Martínez A, Montero P, et al. Structural MRI correlates of PASAT performance in multiple sclerosis. BMC Neurol 2018; 18: 214. [DOI] [PMC free article] [PubMed] [Google Scholar]
- 33.Rocca MA, Comi G, Filippi M. The role of T1-weighted derived measures of neurodegeneration for assessing disability progression in multiple sclerosis. Front Neurol 2017; 8: 433. [DOI] [PMC free article] [PubMed] [Google Scholar]
- 34.Rocca MA, Hidalgo de L, Cruz M, , et al. Two-year dynamic functional network connectivity in clinically isolated syndrome. Mult Scler J 2020; 26: 645–658. [DOI] [PubMed] [Google Scholar]
- 35.Horien C, Shen X, Scheinost Det al. et al. The individual functional connectome is unique and stable over months to years. NeuroImage 2019; 189: 676–687. [DOI] [PMC free article] [PubMed] [Google Scholar]
Associated Data
This section collects any data citations, data availability statements, or supplementary materials included in this article.
Supplementary Materials
Supplemental material, sj-docx-1-mso-10.1177_20552173231195879 for Functional connectome fingerprinting and stability in multiple sclerosis by Maron Mantwill, Susanna Asseyer, Claudia Chien, Joseph Kuchling, Tanja Schmitz-Hübsch, Alexander U Brandt, John-Dylan Haynes, Friedemann Paul and Carsten Finke in Multiple Sclerosis Journal – Experimental, Translational and Clinical
Supplemental material, sj-doc-2-mso-10.1177_20552173231195879 for Functional connectome fingerprinting and stability in multiple sclerosis by Maron Mantwill, Susanna Asseyer, Claudia Chien, Joseph Kuchling, Tanja Schmitz-Hübsch, Alexander U Brandt, John-Dylan Haynes, Friedemann Paul and Carsten Finke in Multiple Sclerosis Journal – Experimental, Translational and Clinical


