

Abstract

The rate coefficient of the reaction of CH3 with HBr was measured and calculated in the temperature range 225–960 K. The results of the measurements performed in a flow apparatus with mass spectrometric detection agree very well with the quasiclassical trajectory calculations performed on a previously developed potential energy surface. The experimental rate coefficients are described well with a double-exponential fit, k1(exp) = [1.44 × 10⁻¹² exp(219/T) + 6.18 × 10⁻¹¹ exp(−3730/T)] cm3 molecule–1 s–1. The individual rate coefficients below 500 K accord with the available experimental data as does the slightly negative activation energy in this temperature range, −1.82 kJ/mol. At higher temperatures, the activation energy was found to switch sign and it rises up to about an order of magnitude larger positive value than that below 500 K, and the rate coefficient is about 50% larger at 960 K than that around room temperature. The rate coefficients calculated with the quasiclassical trajectory method display the same tendencies and are within about 8% of the experimental data between 960 and 300 K and within 25% below that temperature. The significant variation of the magnitude of the activation energy can be reconciled with the tabulated heats of formation only if the activation energy of the reverse CH4 + Br reaction also significantly increases with the temperature.
Introduction
One of the most reliable sources of the enthalpies of formation of chemical compounds is calorimetry, most commonly, measurement of their heats of combustion.1 The method cannot be used for unstable species, such as free radicals that cannot be placed in pure form into a calorimeter. For such species, reaction kinetics provides a way to determine their enthalpies of formation, based on the fact that in thermal equilibrium, the rates of the forward and reverse reactions are equal so that at a given temperature, the reaction enthalpy equals the difference of the forward and reverse activation energies.2,3 The reaction enthalpy, in turn, is the difference of the enthalpies of formation of the products and the reactants, and if all but one of these quantities are known, the missing one can be calculated from the reaction enthalpy. According to the second-law method, the reaction enthalpy is determined directly from the activation energies.2,4 Another option is the third-law method,3,4 in which the equilibrium constant is determined from the rate coefficients for the forward and reverse rate coefficients at a given temperature, and the reaction enthalpy is derived from the Gibbs free energy change of the reaction obtained from the van’t Hoff relation and the entropy change calculated using statistical mechanical formulas.
The kinetic method has been extensively used for the determination of the enthalpies of formation of alkyl radicals. Among several classes of reactions,5,6 measurements of the rate coefficients of their reactions with HBr:
| R0 |
and the reverse reactions:
| R-0 |
were instrumental in deriving accurate thermochemical properties for alkyl radicals. At the end of the 1970s, the enthalpies of formation of alkyl radicals determined by the kinetic method using bromination and iodination reactions6,7 were systematically too low by 8–16 kJ/mol compared with those obtained from other sources, such as dissociation and the reverse radical recombination,5,8−10 as well as the body of heats of formation known in physical organic chemistry.11,12 The resolution of the discrepancy started with the experiments by Gutman and co-workers in 1988,13,14 in which the activation energy of R1-type reactions with C1–C4 alkyl radicals was found to be negative. The observation was soon confirmed by Nicovich et al.,15 Seakins et al.,16 and Seetula.17 The rates of the reverse reactions were derived from direct measurements of the hydrogen abstraction reaction from i-butane by Br atoms and earlier relative rate experiments. The negative activation energy was not consistent with what was known at the time about hydrogen abstraction reactions6 until ab initio calculations supported the mechanism proposed by Gutman and co-workers, viz., halogen hydrides form hydrogen-bonded van der Waals complexes with alkyl radicals that can decompose back to reactants or form products.18 The existence of such complexes has been proved in numerous ab initio calculations.19−24 Early theoretical studies25 utilizing RRKM theory applied to complex-forming bimolecular reactions26 confirmed the possibility that the activation energy can be negative at low temperatures. The attraction between the reactants is a key feature determining the kinetics and dynamics of reaction R1.
Detailed information is available on the potential energy surface of the prototype of alkyl + HBr type reactions, the reaction of methyl radicals with HBr,
| R1 |
and the reverse
| R-1 |
In this reaction, the depth of the van der Waals well is 10.38 kJ/mol, the top of the barrier to reaction is 7.61 kJ/mol below the reactant level, the reaction energy is −94.1 kJ/mol, and there is a product van der Waals well at 95.1 kJ/mol below the reactant level. (When the vibrational zero-point energies are included, the respective numbers are 3.39, 0.92, 71.42, and 72.51 kJ/mol, see Figure 1 in ref (27). The quoted numbers refer to the analytical potential energy surface that is based on the high-accuracy energy values derived by Czakó23 characterized by an estimated error of 0.6 kJ/mol.) The reaction dynamical studies27−29 performed using the quasiclassical trajectory (QCT) method (validated by reduced-dimensionality quantum scattering calculations27) indicate that the long-range attraction induces a capture-type behavior: At low collision energies, the excitation function (the reaction cross section as a function of collision energy) diverges as the collision energy is reduced. This kind of excitation function is associated with rate coefficients that, at low temperatures, increase as the temperature decreases, which is in agreement with the experimental observations. However, the character of the excitation function changes as the collision energy increases: the reaction cross sections pass a minimum and start rising again. The consequence is that the rate coefficients also increase when the temperature is increased. The existing experimental results agree with negative activation energy predicted by the QCT calculations for the low-temperature region. One can notice, however, that the rate coefficients at the highest temperatures in the experiments by Seetula17 do not decrease further when the temperature increases, and one can surmise that they can even increase at higher temperatures. Theoretical modeling based on transition state theory20,25,26 and QCT calculations28 predicted a switch of the activation energy to positive values, but no experiments were performed above 500 K.
The purpose of the present paper is a combined experimental and theoretical study of the temperature dependence of the rate coefficients for reaction R1. Both the experiments and the QCT calculations cover a wide temperature range between 225 and 960 K. The new experimental points are used to check the validity of the switch of the sign of the activation energy predicted by the QCT calculations.
In the rest of the paper, we first describe the experimental and theoretical methodology followed by the presentation of the new experimental and theoretical rate coefficients and their comparison with the existing experimental results. Then, we discuss how the remarkable change as a function of temperature of the activation energy of reaction R1 can be reconciled with the existing thermochemical information.
Methods
Experiments
Kinetic measurements have been performed at a total pressure of 2 Torr of helium in a flow tube reactor combined with an electron impact ionization quadrupole mass spectrometer (operated at 30 eV energy) for the detection of the gas phase species. The experimental setup has been extensively used in the past to study the kinetics and products of the reactions involving a variety of atoms and radicals, in particular the reaction of HBr with OH and its isotopic analogues.30,31
Two different flow reactors were used, one for low-temperature measurements and one for high-temperature measurements.
A low-temperature flow reactor (used at 225–320 K) consisted of a Pyrex tube (45 cm in length, 2.4 cm i.d.) surrounded by a jacket through which thermostatted ethanol was circulated. The inner surface of the reactor was coated with halocarbon wax to reduce the wall-loss of active species (F atoms and CH3 radicals). A high-temperature flow reactor (Figure S1) was employed over the temperature range 300–960 K and consisted of a quartz tube (45 cm in length, 2.5 cm i.d.), where the temperature was controlled with electrical heating elements.32
CH3 radicals were produced in the movable injector (Figure S1) in reaction of F atoms with excess CH4 ([CH4] = (3–5) × 1013 molecule cm–3):33
| R2 |
k2 = 1.28 × 10⁻¹⁰ exp(−219/T) cm3 molecule–1 s–1 (T = 220–960).
Fluorine atoms were produced in a microwave discharge of trace amounts of F2 in He. It was verified by mass spectrometry that more than 95% of F2 was dissociated in the microwave discharge. CH3 radicals were detected either as CH3Br (CH3Br+, m/z = 94) or as CH3I at m/z = 142 (CH3I+) after being scavenged in rapid reactions with excess Br2 ([Br2] = (5–6) × 1013 molecule cm–3) or I2 ([I2] = (4–5) × 1013 molecule cm–3), respectively, added at the end of the reactor 5 cm upstream of the sampling cone (Figure S1):
| R3 |
k3 = 1.83 × 10⁻¹¹ exp(252/T) cm3molecule–1 s–1 (T = 224–358 K).34
| R4 |
The rate constant of reaction R4 is not well known but can be expected to be at least as high as that for reaction R3. In all cases, we observed a total conversion of CH3 to CH3I under the experimental conditions used. Absolute calibration of the mass spectrometric signals of CH3Br was carried out as follows. First, the F atoms were titrated with an excess of Br2 in the main reactor, which led to the formation of FBr ([FBr]0):
| R5 |
k5 = (1.28 ± 0.2) × 10–10cm3molecule–1 s–1 (T = 299–940 K).35
Then, the same concentration of F atoms was titrated with a mixture of Br2 and CH4, resulting in the formation of FBr ([FBr]) and CH3 in reactions R5 and R1, respectively. In the presence of Br2, CH3 radicals are rapidly converted to CH3Br according to reaction R3. The absolute concentration of CH3Br was determined as [CH3Br] = [FBr]0 – [FBr]. This calibration procedure avoids possible complications due to the self-reaction and wall loss of CH3 radicals. Absolute concentrations of FBr were determined upon titration of F atoms in reaction R5 from the consumed fraction of Br2 ([FBr] = Δ[Br2]).
HBr vapor was delivered to the reactor from a flask with a known gaseous HBr/He mixture and was detected by mass spectrometry at its parent peak of m/z = 80 (HBr+). Mass spectrometric analysis showed that no noticeable decomposition of HBr occurred when storing HBr/He mixtures in a glass flask for weeks. The concentration of the potential decomposition product, Br2, was estimated to be less than 0.1% of that of HBr. The absolute calibration of the mass spectrometer for HBr was realized using two methods. The first one employed chemical conversion of a H-atom to HBr in reaction with excess Br2
| R6 |
In this way, the concentration of HBr formed in reaction R6 was related to the fraction of Br2 consumed. In the second method, the absolute concentration of HBr was calculated from the flow rate obtained from the measurements of the pressure drop of the manometrically prepared HBr/He mixture stored in a calibrated volume flask. The absolute concentrations of HBr determined with the two methods employed were consistent within a few percent. The absolute concentrations of the other stable species (CH4, Br2, and F2) in the reactor were derived from their flow rates. I2 was introduced into the reactor by flowing helium through a column containing iodine crystals. The absolute calibration of I2 was realized using a method linking concentrations of I2 and Br2. It consisted of a titration of the same concentration of F atoms with excess Br2 ([F]0 = Δ[Br2]) and I2 ([F]0 = Δ[I2]). This procedure allowed the absolute calibration of I2 signals using that of Br2.
The purities of the gases used were as follows: He >99.999% (Alphagaz); Br2 > 99.99% (Aldrich); I2, 99.999% (Aldrich); F2, 5% in helium (Alphagaz); HBr > 99.8% (Praxair); CH4 > 99.995% (Alphagaz).
Quasiclassical Trajectory Simulations
The calculations were performed using the potential energy surface function developed by Czakó23 corrected as described in ref (28). The standard QCT technology was used,36 described in more detail in refs (27−38). The calculations were performed using an extensively modified version of the trajectory code VENUS 88.39 The Monte Carlo method was used to sample the internal energies of the reactants and the relative translational energy from the Boltzmann distribution. The impact parameter was sampled without weighting up to a maximum value, bmax, which was determined in exploratory calculations, and varied from 4.5 Å at 200 K to 11.0 Å at 1000 K. 200,000 trajectories were run at every temperature. Energy conservation was better than 0.05 kJ/mol.
Results
Measurements of k1
The measurements of k1 were carried out under pseudo-first-order conditions, monitoring the kinetics of CH3 consumption ([CH3]0 = (0.6–1.2) × 1011 molecule cm–3) in an excess of HBr (see Table 1 for the concentrations of HBr) by changing the position of the movable injector (Figure S1). The distance between the injector head and the Br2 (I2) introduction point (5 cm upstream of the sampling cone) was converted into reaction time using the linear flow velocity (1550–1940 cm s–1) of the gas mixture in the reactor. Figure S2 shows typical examples of the observed concentration vs time profiles of CH3 radicals. The decays of CH3 radicals are first order, [CH3] = [CH3]0 × exp(−k1′ × t), where k1′ = k1 × [HBr] + kw is the pseudo-first-order rate constant with kw representing the heterogeneous loss of CH3 radicals. Examples of the typical second-order plots observed at different temperatures are shown in Figure 1.
Table 1. Summary of the Present Measurements of k1.
| T (K)a | [HBr] (1013 molecule cm–3) | k1 (±2σ)b (10–12 cm3 molecule–1 s–1) | reactor surface/CH3 detectionc |
|---|---|---|---|
| 225 | 0.38–7.04 | 3.85 ± 0.07 | HW/CH3Br |
| 235 | 0.55–9.45 | 3.66 ± 0.06 | HW/CH3Br |
| 250 | 0.83–10.7 | 3.47 ± 0.06 | HW/CH3Br |
| 270 | 0.64–9.93 | 3.20 ± 0.08 | HW/CH3Br |
| 295 | 0.88–13.2 | 3.02 ± 0.05 | HW/CH3Br |
| 300 | 0.48–5.27 | 3.05 ± 0.07 | Q/CH3Br |
| 320 | 0.74–11.3 | 2.85 ± 0.06 | HW/CH3Br |
| 360 | 0.74–6.35 | 2.67 ± 0.08 | Q/CH3Br |
| 380 | 0.96–13.1 | 2.56 ± 0.05 | Q/CH3I |
| 410 | 0.74–8.90 | 2.44 ± 0.08 | Q/CH3Br |
| 475 | 0.48–8.73 | 2.32 ± 0.07 | Q/CH3I |
| 575 | 0.30–8.46 | 2.23 ± 0.06 | Q/CH3I |
| 720 | 0.33–9.54 | 2.36 ± 0.06 | Q/CH3I |
| 790 | 0.26–12.6 | 2.44 ± 0.04 | Q/CH3I |
| 830 | 0.53–9.77 | 2.51 ± 0.04 | Q/CH3I |
| 880 | 0.31–9.65 | 2.75 ± 0.04 | Q/CH3I |
| 960 | 0.50–8.72 | 3.10 ± 0.05 | Q/CH3I |
7–11 kinetic runs at each temperature.
Total estimated uncertainty on k1 is about 10%.
HW: halocarbon wax; Q: uncoated quartz; see text for CH3 detection.
Figure 1.

Pseudo-first-order rate constant (k1′) as a function of the concentration of HBr at different temperatures.
The slopes of the straight lines in Figure 1 provide the bimolecular rate constants at the respective temperatures. A summary of the experimental measurements of k1 is given in Table 1. The combined uncertainty on k1 was estimated to be about 10% by adding in quadrature statistical error (<3%) and those on the measurements of the absolute concentration of HBr (∼7%), flows (3%), pressure (2%), and temperature (1%).
The present experimental data for k1 are plotted as a function of temperature in Figure 2 together with previous temperature-dependent measurements15−17 as well as with the QCT results.
Figure 2.

Measured (black squares) and calculated (red filled diamonds) rate coefficients for reaction CH3 + HBr → CH4 + Br (reaction R1). The lines correspond to fitted double-exponential functions whose parameters are listed in the text. The earlier experimental results are from Nicovich et al.(15) (magenta triangles), Seakins et al.(16) (blue circles), Seetula17 (green diamonds), and Krasnoperov and Mehta40 (black triangles). In ref (40), three measurements were performed at 1.05, 11.2, and 101 bar, as marked by the arrows. The pressure used in refs (15) and (16) was 0.013–0.4 bar, and in the present work, it is 0.0026 bar.
Reaction R1 is fast, and the rate coefficients are between 2.2–4.5 × 10⁻¹² cm3 molecule–1 s–1. The largest difference between the smallest and largest rate coefficients is only a factor of 2, and no pressure dependence can be observed. Spectacular is the strong tendency showing that the reaction of the CH3 radical with HBr clearly exhibits a non-Arrhenius behavior: negative temperature dependence is seen below 575 K, whereas positive temperature dependence is observed above 720 K. Thus, the experiments confirm that the activation energy is positive at high temperatures as expected based on the QCT and earlier TST-based predictions.
One can note the excellent agreement between the present data and those of Nicovich et al.15 and Seakins et al.16 The measurements of Seetula17 are also consistent with our data within the experimental uncertainties. The current experimental results have been fitted to a double exponential function (solid line in Figure 2):
k1(exp) = 1.44 × 10⁻¹² exp(219/T) + 6.18 × 10⁻¹¹ exp(−3730/T) cm3 molecule–1 s–1
This expression adequately describes all existing experimental data and is expected to be accurate within 15% between 225 and 960 K.
Remarkable is the agreement between all experimental results and the rate coefficients obtained by the QCT calculations, including the strong non-Arrhenius behavior. The optimal double-exponential fit to the QCT data is
k1(QCT) = 1.19 × 10⁻¹² exp(309/T) + 1.89 × 10⁻¹¹ exp(−2559/T) cm3 molecule–1 s–1
The location and magnitude of the minimum of the Arrhenius curve obtained experimentally and from trajectory simulations are essentially identical. Between 300 and 960 K, the data points obtained with the two methods differ only by a few percent. In the high-temperature wing, the rate of increase in both the experimental and QCT rate coefficients is very close. In the low-temperature wing, both the experiments and the QCT simulations yield negative activation energy, but in this wing, the QCT results are systematically larger than the experimental ones. The deviation is below the 10% estimated combined uncertainty of the experimental rate coefficients above about 300 K, but at lower temperatures, it exceeds it. The discrepancy of this magnitude can easily be the consequence of a slightly too strong long-range attraction between the reactants on the employed potential energy surface.
Discussion
The experiments and the QCT calculations, which are in very good agreement, suggest that the activation energy of reaction R1 changes significantly with the temperature. The Arrhenius plot is highly curved, and it goes through a minimum and is close to linear at the limits of both the high and low temperatures. The activation energy, calculated as the negative of the local slope of the Arrhenius plot, is Ea(T < 300 K, exp) = −1.82 kJ/mol according to the current experiments and Ea(T < 300 K, QCT) = −2.57 kJ/mol from the QCT calculations. At the highest temperatures covered by the current measurements and calculations, above 800 K, the Arrhenius plot is virtually a straight line, but in fact, the activation energies calculated from the double-exponential fit to the experimental results are 6.4, 10.0, and 13.5 kJ/mol at 800, 900, and 1000 K, respectively. It is worth noting that the activation energy at 1000 K is 7.5 larger than the absolute value of Ea at the low-temperature limit.
The basic reaction kinetics information utilized in the determination of the heat of formation of the methyl radical according to the second-law method is the reaction enthalpy obtained as the difference of the activation energies:
| 1 |
This relationship is valid under thermal equilibrium where the rates of the forward and reverse reactions are equal. In the derivation of the enthalpy of formation of the methyl radical, the activation energy for the reverse reaction, CH4 + Br → CH3 + HBr, was considered to be constant, 73.9 ± 2.5 kJ/mol,14,16 based on direct measurements of the rate of the (CH3)3CH + Br → (CH3)3C + HBr reaction and a series of relative rates determined earlier.41,42
Considering that the activation energy for the methyl + HBr reaction changes by about 15 kJ/mol between 200 and 1000 K, the reaction enthalpy calculated from the activation energy determined in this work and from the literature value14,16 of Ea(R-1) = 73.9 kJ/mol will vary significantly: from about −75.72 kJ/mol at temperatures below cca. 400 K to about −57.65 kJ/mol at 1000 K. The exothermicity calculated from the activation energies would decrease further above 1000 K. This significant change is hard to reconcile with the currently accepted thermochemical data. Figure 3 compares the reaction enthalpies calculated from the activation energies and from the tabulated heats of formation. One can see that the absolute value of the enthalpy of reaction R1 obtained from the activation energies increases by ∼20 kJ/mol between 200 and 1200 K, while from the tabulated heats of formation of CH4 and Br as well as CH3 and HBr, the change of ΔrH°(R1) is within a range narrower than 4.5 kJ/mol and is not monotonic.
Figure 3.
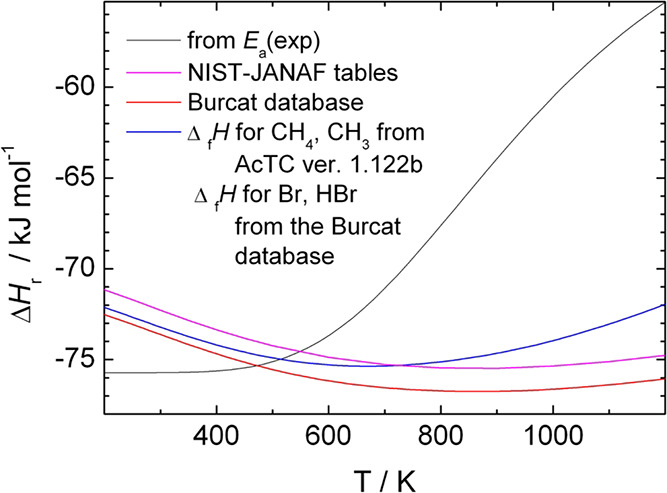
Comparison of the temperature dependence of the reaction enthalpy of reaction R1 calculated from the measured temperature-dependent forward and the constant Ea(R-1) = 73.9 kJ/mol reverse activation energies and from the heats of formation of the reactants and products of R1 (taken from various databases4,43,44).
A consequence of this deviation is that if one calculates the enthalpy of formation of CH3 from the reaction enthalpy obtained from the activation energies of R1 and R-1 as it was done in the earlier experiments,14−16 its value and its temperature dependence differ from what one derives from data in thermochemical tables. Using the enthalpies of formation of the three other species involved in the reaction taken from the 1.122b version of ATcT and the reaction enthalpy from the activation energies one obtains, ΔfH°(CH3, 298.15) = 148.9 kJ/mol instead of the 146.46 kJ/mol according the same version of ATcT. More serious deviation is that, compared with what one obtains using the NASA polynomials for CH3, the rate of increase of ΔHf°(CH3) with temperature is slightly too slow below 500 K, and much more too slow between 500 and 1000 K so that at 1000 K, the deviation from the tabulated value is as large as −16.5 kJ/mol.
The large difference appears above 500 K, which coincides with the change of sign of the activation energy. The inconsistency of the data obtained from the activation energies for the forward and reverse reaction (the former measured in the present work, the latter being the accepted constant value) can be resolved by assuming that either the measured positive activation energy at high temperatures is an artifact or that the activation energy of the reverse reaction is not constant. Now, we investigate these two options.
On the validity of the change of the activation energy of the forward reaction: It is known that the activation energy of reactions passing through submerged barriers generally does change sign.26,45 In the current case, the very good agreement between the experiments and the QCT calculations supports not only the change of sign but even the magnitude of the activation energy at high temperatures. In addition, as shown in ref (28), the rate coefficients calculated with the QCT method agree very well with the extended Arrhenius expression derived by evaluation of literature data in ref (46), which also yields positive activation energy above 500 K. Based on this, it is reasonable to assume that the temperature dependence of the rate coefficient for reaction R1 and of the activation energy is correct.
The other constituent of the reaction enthalpy, the activation energy of the reverse reaction, has not been determined in direct experiments; instead, it is based on Ea of the Br + i-butane reaction determined below 500 K and a series of relative rates.14,16 When the enthalpy of formation of the methyl radical was evaluated and the activation energy of reaction R1 measured at low temperatures was combined with the value Ea(R-1) = 73.9 kJ/mol, the obtained value proved to be consistent with that derived from other sources. The combination of low-temperature activation energies looks reasonable, considering that they are very probably close to constant in that temperature range. The large deviation between the reaction enthalpies obtained from tabulated data and those derived via the combination of the Ea(R1) determined in this work and the constant 73.9 kJ/mol for the reverse reaction suggests that at higher temperatures, the activation energy of the CH4 + Br reaction should also change. The magnitude of this change can be estimated by combining the Ea(R1) measured in this work with the ΔrH°(R1) calculated from tabulated heats of formation. We consider the tabulated values together with their temperature dependence as solidly founded, in particular in light of the consistency provided by the active thermochemical tables. The temperature dependence reported in tabulations is based on statistical mechanical calculations of the partition function, which, although are approximate, provide results that also proved to be consistent within quite an extended thermochemical network. This suggests that the only parameter whose temperature dependence can deviate from the assumed constant value is the activation energy of the CH4 + Br reaction.
When one calculates this activation energy from the Ea(R1) measured in this work and ΔrH°(R1) calculated from the tabulated heats of formation, one gets Ea(R-1) = 69.2 kJ/mol in the limit of zero kelvin. This can be compared with the reaction enthalpy for the reverse reaction because, although there is a submerged potential barrier, the activation energy (in Tolman’s sense as “the average energy of the reacted reactants”) must cover the reaction endothermicity.
The ΔrH°(R-1) is 71.5 kJ/mol according to data from Burcat’s database, 70.0 kJ/mol is obtained from heats of formation in ATcT ver. 1.122b, and a value of 70.2 kJ/mol was derived from highly accurate ab initio calculations by Czakó.23 The observation that the “reverse-engineered” zero-kelvin activation energy agrees very well with the reaction enthalpy derived from various sources suggests that the energy available for the reactants is fully utilized for climbing from the CH4 + Br to the CH3 + HBr energy level. In the temperature range where the experiments for the reaction of i-butane and Br were performed, one obtains for Ea(R-1) the values 71.2 and 72.5 kJ/mol at 298.15 and 400 K, respectively. These values are close to the 73.9 kJ/mol derived from rate measurements of other reactions. Furthermore, the ΔrH°(R1) calculated from the measured Ea(R1) and Ea(R-1) = 73.9 kJ/mol is reasonably close to that taken from the thermochemical databases. This explains the success of the earlier experiments in determining the correct enthalpy of formation for CH3 using Ea(R-1) = 73.9 kJ/mol. Different is the situation at higher temperatures.
The temperature dependence of Ea(R-1) derived for the markedly temperature-dependent of Ea(R1) measured in this work and the much less temperature-dependent ΔrH°(R1) derived from thermochemical tables is shown in Figure 4 to be as large as that of Ea(R1). While the change of the latter with the temperature can be explained by the presence of the pre-reaction complex and the submerged barrier, the reason why the activation energy of a significantly endothermic reaction should increase above the reaction enthalpy as much as we found is not obvious. In terms of transition state theory, the transition states, the “tight” one corresponding to the potential barrier, and the “loose” corresponding to the centrifugal barrier between the van der Waals well and the separated CH3 radical and HBr molecule reactants govern the rate of both the forward and the reverse reaction. However, the lifetime distribution of the reactive trajectories in the van der Waals well27 as well as the weak communication between the intra- and interfragment modes suggests that the energy redistribution is probably not very fast, i.e., there is not necessarily equilibrium between the modes. This means that one of the conditions of applicability of the RRKM theory (the version of transition state theory apt for such systems) is not fulfilled. The earlier QCT calculations27 on the CH3 + HBr reaction also indicated that a significant fraction of trajectories, at low energies up to around 50%, recross the region of the submerged potential barrier, which undermines the other basic assumption of transition state theory.
Figure 4.

Temperature dependence of Ea(R-1) calculated from the activation energy for the forward reaction and the reaction enthalpy from the heats of formation taken from databases.
It is worth mentioning that in the experimental studies of the higher alkane analogs13,21 of the CH4 + Br reaction, there is no sign of temperature dependence of the activation energy; note, however, that the temperature in those studies was well within the essentially linear high-temperature region of the presumedly curved Arrhenius plot.
A possible way of understanding the change of activation energy of reaction R-1 is dynamical simulations. QCT calculations on the CH4 + Br reaction are in progress in our laboratories.
Conclusions
The rate coefficients obtained in the current experiments for the CH3 + HBr reaction agree very well with the literature data available at temperatures below about 500 K. The activation energy in this region is negative. The QCT calculations also reproduce the experimental rate coefficients in this region and support the negative sign of the activation energy. At high temperatures, however, according to both the experiments and the simulations, the activation energy is positive and the slope of the Arrhenius plot is larger than at low temperatures. This behavior was already seen in our earlier QCT calculations and confirmed in the current ones.
The magnitude of the activation energy changes significantly, by about 15 kJ/mol between 225 and 1000 K. The reaction enthalpy calculated from the tabulated heats of formation of the four species involved in the reaction changes by at most a factor of three less than the activation energy measured/calculated for the CH3 + HBr reaction. To reconcile the two observations, one must assume that the activation energy of the reverse CH4 + Br reaction changes parallel to that of the forward reaction.
Acknowledgments
The authors gratefully acknowledge Mr. Máté Papp for his help in handling the data in the Burcat database included in the ReSpecTh database. Project no. 129140 (G.L.) has been implemented with the support provided by the Ministry of Innovation and Technology of Hungary from the National Research, Development and Innovation Fund, financed under the OTKA funding scheme. This article is based upon work from COST Action CA18212—Molecular Dynamics in the GAS phase (MD-GAS), supported by COST (European Cooperation in Science and Technology). The research was funded by the Belgian Science Policy Office (BELSPO), FED-tWIN REVOCS (P.S.). We thank the helpful discussions with Prof. Michael J. Pilling and Dr. Stephen J. Klippenstein.
Supporting Information Available
The Supporting Information is available free of charge at https://pubs.acs.org/doi/10.1021/acs.jpca.3c03685.
(Figure S1) Diagram of the high-temperature flow apparatus and (Figure S2) typical pseudo-first-order plots (PDF)
Author Contributions
Y.B. performed the experiments. P.S. participated in programming and performed the QCT calculations. G.L. evaluated the data and wrote the first version of the manuscript. All authors participated in completing the manuscript and have given approval to the final version.
The authors declare no competing financial interest.
Special Issue
Published as part of The Journal of Physical Chemistry virtual special issue “Marsha I. Lester Festschrift”.
Supplementary Material
References
- Combustion Calorimetry, Sunner S., Månsson M. Eds, Pergamon Press, Oxford, 1979. [Google Scholar]
- Benson S. W., Thermochemical Kinetics, Wiley: New York, 1976. [Google Scholar]
- Ruscic B.; Boggs J. E.; Burcat A.; Császár A. G.; Demaison J.; Janoschek R.; Martin J. M. L.; Morton M. L.; Rossi M. J.; Stanton J. F.; et al. IUPAC Critical Evaluation of Thermochemical Properties of Selected Radicals. Part I. J. Phys. Chem. Ref. Data 2005, 34, 573–656. 10.1063/1.1724828. [DOI] [Google Scholar]
- NIST-JANAF Thermochemical Tables, 4th ed.; Chase M. W., Jr., Ed.; J. Phys. Chem. Ref. Data, Monograph 9; 1998. [Google Scholar]
- Tsang W. Evidence for strongly temperature-dependent A factors in alkane decomposition and high heats of formation for alkyl radicals. Int. J. Chem. Kinet. 1978, 10, 821–837. 10.1002/kin.550100804. [DOI] [Google Scholar]
- McMillen D. F.; Golden D. M. Hydrocarbon bond dissociation energies. Annu. Rev. Phys. Chem. 1982, 33, 493–532. 10.1146/annurev.pc.33.100182.002425. [DOI] [Google Scholar]
- Golden D. M.; Benson S. W. Free-radical and molecule thermochemistry from studies of gas-phase iodine-atom reactions. Chem. Rev. 1969, 69, 125–134. 10.1021/cr60257a005. [DOI] [Google Scholar]
- Tsang W. The stability of alkyl radicals. J. Am. Chem. Soc. 1985, 107, 2872–2880. 10.1021/ja00296a007. [DOI] [Google Scholar]
- Griller D.; Ingold K. U. Rate constants for the bimolecular self-reactions of ethyl, isopropyl, and tert-butyl radicals in solution. A direct comparison. Int. J. Chem. Kin. 1974, 6, 453–456. 10.1002/kin.550060315. [DOI] [Google Scholar]
- Brouard M.; Lightfoot P. D.; Pilling M. J. Observation of equilibration in the system Hydrogen + ethylen .dbblharw. ethyl. The determination of the heat of formation of C2H5. J. Phys. Chem. 1986, 90, 445–450. 10.1021/j100275a019. [DOI] [Google Scholar]
- Doering W. V. E. Impact of upwardly revised ΔHf0 of primary, secondary, and tertiary radicals on mechanistic constructs in thermal reorganizations. Proc. Natl. Acad. Sci. USA. 1981, 78, 5279–5283. 10.1073/pnas.78.9.5279. [DOI] [PMC free article] [PubMed] [Google Scholar]
- Purnell J.Homogeneous Alkane Cracking: The Route to Quantitative Description to Very High Conversion. In: Frontiers of Free Radical Chemistry, Pryor W. A. (Ed.), Academic Press: New York, 1980, 93–116. [Google Scholar]
- Russell J. J.; Seetula J. A.; Timonen R. S.; Gutman D.; Nava D. F. Kinetics and Thermochemistry of the t-C4H9 Radical. Study of the Equilibrium t-C4H9+HBr ⇌ i-C4HI0+Br. J. Am. Chem. Soc. 1988, 110, 3084–3091. 10.1021/ja00218a016. [DOI] [Google Scholar]
- Russell J. J.; Seetula J. A.; Gutman D. Kinetics and Thermochemistry of Methyl, Ethyl, and Isopropyl. Study of the Equilibrium R + HBr ⇌ R-H + Br. J. Am. Chem. Soc. 1988, 110, 3092–3099. 10.1021/ja00218a017. [DOI] [Google Scholar]; Note that the rate coefficients reported in this paper were shown to be too low by about a factor of two in Ref (16).
- Nicovich J. M.; Van Dijk C. A.; Kreutter K. D.; Wine P. H. Kinetics of the Reactions of Alkyl Radicals with Hydrogen Bromide and Deuterium Bromide. J. Phys. Chem. 1991, 95, 9890–9896. 10.1021/j100177a051. [DOI] [Google Scholar]
- Seakins P. W.; Pilling M. J.; Niiranen J. T.; Gutman D.; Krasnoperov L. N. Kinetics and Thermochemistry of R + Hydrogen Bromide ⇌ RH + Bromine Atom Reactions: Determinations of the Heat of Formation of Ethyl, Isopropyl, sec-Butyl and tert-Butyl Radicals. J. Phys. Chem. 1992, 96, 9847–9855. 10.1021/j100203a050. [DOI] [Google Scholar]
- Seetula J. A. Kinetics of the R + HBr → RH + Br (R=CH2I or CH3) Reaction. An Ab Initio Study of the Enthalpy of Formation of the CH2I, CHI2 and CI3 Radicals. Phys. Chem. Chem. Phys. 2002, 4, 455–460. 10.1039/b107407p. [DOI] [Google Scholar]
- Chen Y.; Tschuikow-Roux E.; Rauk A. Intermediate Complexes and Transition Structures for the Reactions CH3 + HX–CH4 + X (X = I, Br): Application of G1 Theory. J. Phys. Chem. 1991, 95, 9832–9836. 10.1021/j100177a041. [DOI] [Google Scholar]
- Chen Y.; Tschuikow-Roux E. Mechanism of hydrogen abstraction reactions by free radicals: simple metathesis or involving intermediate complex?. J. Phys. Chem. 1993, 97, 3742–3749. 10.1021/j100117a019. [DOI] [Google Scholar]
- Krasnoperov L. N.; Peng J.; Marshall P. Modified Transition State Theory and Negative Apparent Activation Energies of Simple Metathesis Reactions: Application to the Reaction CH3 + HBr → CH4 + Br. J. Phys. Chem. A 2006, 110, 3110–3120. 10.1021/jp054435q. [DOI] [PubMed] [Google Scholar]
- Golden D. M.; Peng J.; Goumri A.; Yuan J.; Marshall P. Rate Constant for the Reaction C2H5 + HBr → C2H6 + Br. J. Phys. Chem. A 2012, 116, 5847–5855. 10.1021/jp209081v. [DOI] [PubMed] [Google Scholar]
- Sheng L.; Li Z.-S.; Liu J.-Y.; Xiao J.-F.; Sun C.-C. Theoretical study on the rate constants for the C2H5 + HBr → C2H6 + Br reaction. J. Comput. Chem. 2004, 25, 423–428. 10.1002/jcc.10388. [DOI] [PubMed] [Google Scholar]
- Czakó G. Accurate Ab Initio Potential Energy Surface, Thermochemistry, and Dynamics of the Br(2P, 2P3/2) + CH4 → HBr + CH3 Reaction. J. Chem. Phys. 2013, 138, 134301 10.1063/1.4797467. [DOI] [PubMed] [Google Scholar]
- Yin C.; Tajti V.; Czakó G. Full-dimensional potential energy surface development and dynamics for the HBr + C2H5 → Br(2P3/2) + C2H6 reaction. Phys. Chem. Chem. Phys. 2022, 24, 24784. 10.1039/D2CP03580D. [DOI] [PubMed] [Google Scholar]
- Chen Y.; Rauk A.; Tschuikow-Roux E. On the Question of Negative Activation Energies: Absolute Rate Constants by RRKM and G1 Theory for CH3 + HX → CH4 + X (X = Cl, Br) Reactions. J. Phys. Chem. 1991, 95, 9900–9908. 10.1021/j100177a053. [DOI] [Google Scholar]
- Mozurkewich M.; Benson S. W. Negative Activation Energies and Curved Arrhenius Plots. 1. Theory of Reactions Over Potential Wells. J. Phys. Chem. 1984, 88, 6429–6435. 10.1021/j150669a073. [DOI] [Google Scholar]
- Gao D.; Xin X.; Wang D.; Szabó P.; Lendvay G. Theoretical dynamics studies of the CH3 + HBr → CH4 + Br reaction: integral cross sections, rate constants and microscopic mechanism. Phys. Chem. Chem. Phys. 2022, 24, 10548–10560. 10.1039/D2CP00066K. [DOI] [PubMed] [Google Scholar]
- Góger S.; Szabó P.; Czakó G.; Lendvay G. Flame inhibition chemistry: rate coefficients of the reactions of HBr with CH3 and OH radicals at high temperatures determined by quasiclassical trajectory calculations. Energy Fuels 2018, 32, 10100–10105. 10.1021/acs.energyfuels.8b00989. [DOI] [Google Scholar]
- Csorba B.; Szabó P.; Góger S.; Lendvay G. Zero-point vibration is more important than reactant attraction in determining the reactivity of exothermic bimolecular reactions with submerged potential barriers: Theoretical Studies of the R + HBr → RH + Br (R = CH3, HO) Systems. J. Phys. Chem. A 2021, 125, 8386–8396. 10.1021/acs.jpca.1c05839. [DOI] [PMC free article] [PubMed] [Google Scholar]
- Bedjanian Y.; Riffault V.; Le Bras G.; Poulet G. Kinetic Study of the Reactions of OH and OD with HBr and DBr. J. Photochem. Photobiol., A 1999, 128, 15–25. 10.1016/S1010-6030(99)00159-8. [DOI] [Google Scholar]
- Bedjanian Y. Rate Constant of the Reaction of OH Radicals with HBr over the Temperature Range 235–960 K. J. Phys. Chem. A 2021, 125, 1754–1759. 10.1021/acs.jpca.1c00251. [DOI] [PubMed] [Google Scholar]
- Morin J.; Romanias M. N.; Bedjanian Y. Experimental Study of the Reactions of OH Radicals with Propane, n-Pentane, and n-Heptane over a Wide Temperature Range. Int. J. Chem. Kinet. 2015, 47, 629–637. 10.1002/kin.20936. [DOI] [Google Scholar]
- Bedjanian Y. Rate Constant of the Reaction of F Atoms with Methane over the Temperature Range 220–960 K. Chem. Phys. Lett. 2021, 770, 138458 10.1016/j.cplett.2021.138458. [DOI] [PubMed] [Google Scholar]
- Khamaganov V.; Crowley J. N. Rate Coefficients for the Reactions CH3 + Br2 (224–358 K), CH3CO + Br2 (228 and 298 K), and Cl + Br2 (228 and 298 K). Int. J. Chem. Kinet. 2010, 42, 575–585. 10.1002/kin.20505. [DOI] [Google Scholar]
- Bedjanian Y. Kinetics and Products of the Reactions of Fluorine Atoms with ClNO and Br2 from 295 to 950 K. J. Phys. Chem. A 2017, 121, 8341–8347. 10.1021/acs.jpca.7b08956. [DOI] [PubMed] [Google Scholar]
- W. L., Hase , in Encyclopedia of Computational Chemistry (John Wiley & Sons, Ltd: Chichester, UK, 2002.) [Google Scholar]
- Szabó P.; Lendvay G. A Quasiclassical Trajectory Study of the Reaction of H Atoms with O2(1Δg). J. Phys. Chem. A. 2015, 119, 7180–7189. 10.1021/jp510202r. [DOI] [PubMed] [Google Scholar]
- Lahankar S. A.; Zhang J.; Minton T. K.; Guo H.; Lendvay G. Dynamics of the O-Atom Exchange Reaction 16O(3P) + 18O18O(3Σg–) → 16O18O(3Σg–) + 18O(3P) at Hyperthermal Energies. J. Phys. Chem. A. 2016, 120, 5348–5359. 10.1021/acs.jpca.6b01855. [DOI] [PubMed] [Google Scholar]
- Hase W. L., Duchovic R. J., Lu D. H., Swamy K. N., Vande Linde S. R., Wolf R. J., VENUS: A General Chemical Dynamics Computer Program; Wayne State University: Detroit, MI, 1988. [Google Scholar]
- Krasnoperov L. N.; Mehta K. Kinetic Study of CH3 + HBr and CH3 + Br Reactions by Laser Photolysis–Transient Absorption over 1–100 Bar Pressure Range. J. Phys. Chem. A 1999, 103, 8008–8020. 10.1021/jp991183i. [DOI] [Google Scholar]
- Coomber J. W.; Whittle E. Bromination of fluoro-alkanes. Part 3.—Methane, fluoroform and fluoro-ethanes. Trans. Faraday Soc. 1966, 62, 1553. 10.1039/TF9666201553. [DOI] [Google Scholar]
- Fettis G. C.; Knox J. H. In Progress in Reaction Kinetics; Porter G., Ed.: Pergamon: New York, 1964: Chapter 1. [Google Scholar]
- Burcat A., Ruscic B., Third Millennium Ideal Gas and Condensed Phase Thermochemical Database for Combustion with Updates from Active Thermochemical Tables (Joint Report: ANL-05/20, Argonne National Laboratory, Argonne, IL, USA, and TAE 960, Technion - Israel Institute of Technology, Haifa, Israel, 2005. Available at https://burcat.technion.ac.il/, mirrored at http://garfield.chem.elte.hu/Burcat/burcat.html, .
- Standard heats of formation and NASA polynomials for CH4 and CH3 from the Active Thermochemical Tables, version 1.222b, extracted from the mechanism of methane combustion in air available in; Glarborg P.; Miller J. A.; Ruscic B.; Klippenstein S. J. Modeling nitrogen chemistry in combustion. Prog. Energy Combust. Sci. 2018, 67, 31–68. 10.1016/j.pecs.2018.01.002. [DOI] [Google Scholar]
- Troe J. The Polanyi Lecture: The Colorful World of Complex-forming Bimolecular Reactions. J. Chem. Soc., Faraday Trans. 1994, 90, 2303–2317. 10.1039/ft9949002303. [DOI] [Google Scholar]
- Burgess D. R. Jr.; Babushok V. I.; Linteris G. T.; Manion J. A. A Chemical Kinetic Mechanism for 2-Bromo-3,3,3-trifluoropropene (2-BTP) Flame Inhibition. Int. J. Chem. Kinet. 2015, 47, 533–563. 10.1002/kin.20923. [DOI] [Google Scholar]
Associated Data
This section collects any data citations, data availability statements, or supplementary materials included in this article.