

Abstract
Genetic engineering of plants is at the core of sustainability efforts, natural product synthesis and crop engineering. The plant cell wall is a barrier that limits the ease and throughput of exogenous biomolecule delivery to plants. Current delivery methods either suffer from host-range limitations, low transformation efficiencies, tissue damage or unavoidable DNA integration into the host genome. Here, we demonstrate efficient diffusion-based biomolecule delivery into intact plants of several species with pristine and chemically functionalized high aspect ratio nanomaterials. Efficient DNA delivery and strong protein expression without transgene integration is accomplished in Nicotiana benthamiana (Nb), Eruca sativa (arugula), Triticum aestivum (wheat) and Gossypium hirsutum (cotton) leaves and arugula protoplasts. We find that nanomaterials not only facilitate biomolecule transport into plant cells but also protect polynucleotides from nuclease degradation. Our work provides a tool for species-independent and passive delivery of genetic material, without transgene integration, into plant cells for diverse biotechnology applications.
Plant biotechnology is critical to address the world’s leading challenges in meeting our growing food and energy demands, and as a tool for scalable pharmaceutical manufacturing. In agriculture, genetic enhancement of plants can be employed to create crops that have higher yields and are resistant to herbicides1, insects2, diseases3 and abiotic stress4. In pharmaceuticals and therapeutics, genetically engineered plants can be used to synthesize valuable small-molecule drugs and recombinant proteins5. Furthermore, bioengineered plants may provide cleaner and more efficient biofuels6,7.
Despite several decades of advancements in biotechnology, most plant species remain difficult to transform genetically8. A bottleneck facing efficient plant genetic transformation is biomolecule delivery into plant cells through the rigid and multilayered cell wall. Currently, few well-established delivery tools exist that can transfer biomolecules into plant cells, and each has considerable limitations. Agrobacterium-mediated delivery9 is the most commonly used tool for gene delivery into plants, but this technique has limitations in that efficient delivery is limited to a narrow range of plant species and tissue types, and is unable to perform DNA- and transgene-free editing10. The one other commonly used tool for plant transformation is biolistic particle delivery (also called the gene gun)11, which can deliver biomolecules into a wider range of plant species but faces the limitations of providing only bombarded-site expression, causing plant tissue damage when high bombardment pressures are used8, being subject to possible limitations of specimen size and positioning in the biolistic chamber, and the requirement of using a substantial amount of DNA to achieve the desired delivery efficiency. For transient expression of heterologous proteins in plants, the use of plant viral vectors such as tobacco mosaic virus-based Geneware technology, potato virus X and cowpea mosaic virus12 is beneficial for large-scale production of industrially relevant proteins. However, viral vectors are only compatible with select plant species and expression cassette sizes, which limits the plant host and hinders expression of large or multiple proteins simultaneously. Additionally, the use of viral vectors, even if used for transient expression of gene editing systems, are usually subject to regulatory purview because of the pathogenic origin of viruses and because some viruses integrate portions of their genetic material into the plant host genome13.
While nanomaterials have been studied for gene delivery into animal cells14,15, their potential for plant systems remains under-studied16. Several reports describe the uptake of nanomaterials by plant cells; however, most of these foundational studies deliver only non-functional cargoes17, are carried out in protoplast cell culture18 or use mechanical aids (gene gun19 or ultrasound20) to enable nanoparticle entry into the walled plant cells. Mesoporous silica nanoparticles21 (MSNs), DNA nanostructures and DNA origami22, silicon carbide whiskers23 (SCWs) and layered double hydroxide (LDH) clay nanosheets24–26 have demonstrated the possibility of nanoscale internalization into walled plant cells without strong mechanical aid to deliver functional biological cargoes. In the MSN study, researchers demonstrated passive delivery of plasmid DNA loaded MSNs into Arabidopsis roots by co-culture, an important initial development for passive nanoparticle transport in model plant species root cells21. SCWs have enabled delivery of genes into undifferentiated plant tissues and explants suspended in solution via incubation and vortexing of whiskers together with plant cells and DNA, enabling stable transformation and selection of transgenic plants in tissue culture23. Vortexing the large and stiff SCWs (micrometre-sized) is hypothesized to pierce or rupture the cell wall and enable DNA entry into cells. In this manner, SCWs permeabilize the cell wall to enable entry of free solution-phase DNA; however, this delivery mechanism is not amenable for subcellular/tissue targeting or intact-plant testing, and may compromise transformation efficiency and cell health. Important developments with LDHs have shown effective delivery of RNAi molecules (double-stranded RNAs) for gene silencing in the model species Nicotiana tabacum24, paving the way towards future developments in plant bionanotechnology; however, to our knowledge, LDH has yet to be implemented for plasmid DNA delivery to enable gene expression studies.
So far, there has yet to be a plant transformation method that enables high-efficiency plasmid DNA delivery, without transgene integration, in a plant species-independent manner. Herein, we address the long-standing challenge of DNA delivery to mature model and non-model plants with nanomaterials, filling a key void in the plant transformation toolkit. With certain surface chemistries, high aspect ratio nanomaterials such as carbon nanotubes (CNTs) have been observed to passively traverse extracted chloroplast27 and plant membranes28 as a result of several figures of merit: high aspect ratio, exceptional tensile strength, high surface area-to-volume ratio and biocompatibility. When bound to CNTs, biomolecules are protected from cellular metabolism and degradation29, exhibiting superior biostability compared to free biomolecules. Moreover, single-walled carbon nanotubes (SWCNTs) have strong intrinsic near-infrared (NIR) fluorescence30,31 within the tissue transparency window and thus benefit from reduced photon scattering, allowing for tracking of cargo–nanoparticle complexes deep in plant tissues. However, previous incorporation of CNTs in plant systems is limited to exploratory studies of CNT biocompatibility27,32,33 and sensing of small molecules in plant tissues28,34 by introducing CNTs complexed to synthetic fluorescent dyes or polymers.
Here, we develop a CNT-based platform, which further advances the aforementioned field of nanoparticle-directed plant transformation. We generate and validate a platform that can deliver plasmid DNA into both model and crop plants with high efficiency, no toxicity, without mechanical aid and without transgene integration—a combination of features that is not attainable with existing plant transformation approaches. Covalently functionalized or pristine CNTs were used to deliver DNA into mature Nicotiana benthamiana, Eruca sativa (arugula), Triticum aestivum (wheat) and Gossypium hirsutum (cotton) leaves, generating strong protein expression. We also show CNT-based protein expression in arugula protoplasts, a common plant tissue culture, with 85% transformation efficiency. This study establishes that CNTs, which are below the size exclusion limit of the plant cell wall (at least one dimension at or below ~20 nm), could be a promising solution for overcoming plant biomolecule delivery limitations in a species-independent and non-integrating manner and could enable high-throughput plant genetic transformations for a variety of plant biotechnology applications.
Grafting DNA on CNT scaffolds
For the transgene expression study, we developed two distinct grafting methods to load green fluorescent protein (GFP)-encoding plasmids or their linear PCR amplicon fragments on SWCNTs and multi-walled carbon nanotubes (MWCNTs). The first DNA-grafting method involves direct adsorption of DNA on CNTs via dialysis. Initially, CNTs are coated with a surfactant—sodium dodecyl sulfate (SDS). During dialysis, SDS desorbs from the CNT surface and exits the dialysis membrane, while DNA adsorbs onto the surface of CNTs in a dynamic ligand exchange process (Fig. 1a). With this method, double-stranded DNA vectors graft on CNTs through π–π stacking interactions. The adsorption of DNA on CNTs is confirmed through a solvatochromic shift in the SWCNT NIR fluorescence emission spectra, which is characteristic of a DNA adsorption-induced change in the CNT dielectric environment35 (Supplementary Fig. 1). Control dialysis aliquots of SDS-coated CNTs, in the absence of DNA, show rapid CNT precipitation and lack NIR fluorescence (Supplementary Fig. 1), confirming SDS desorption and replacement by DNA in our dialysis aliquots with DNA. Additionally, at the end of the dialysis procedure, we confirmed that there is no SDS left in the cartridge by using Stains-all dye. The complete characterization (zeta potential, atomic force microscopy (AFM) height and DNA loading efficiency) of CNTs prepared via dialysis is summarized in Supplementary Fig. 1.
Fig. 1 |. Strategies for grafting DNA on CNT scaffolds and characterization of DNA–CNT conjugates.
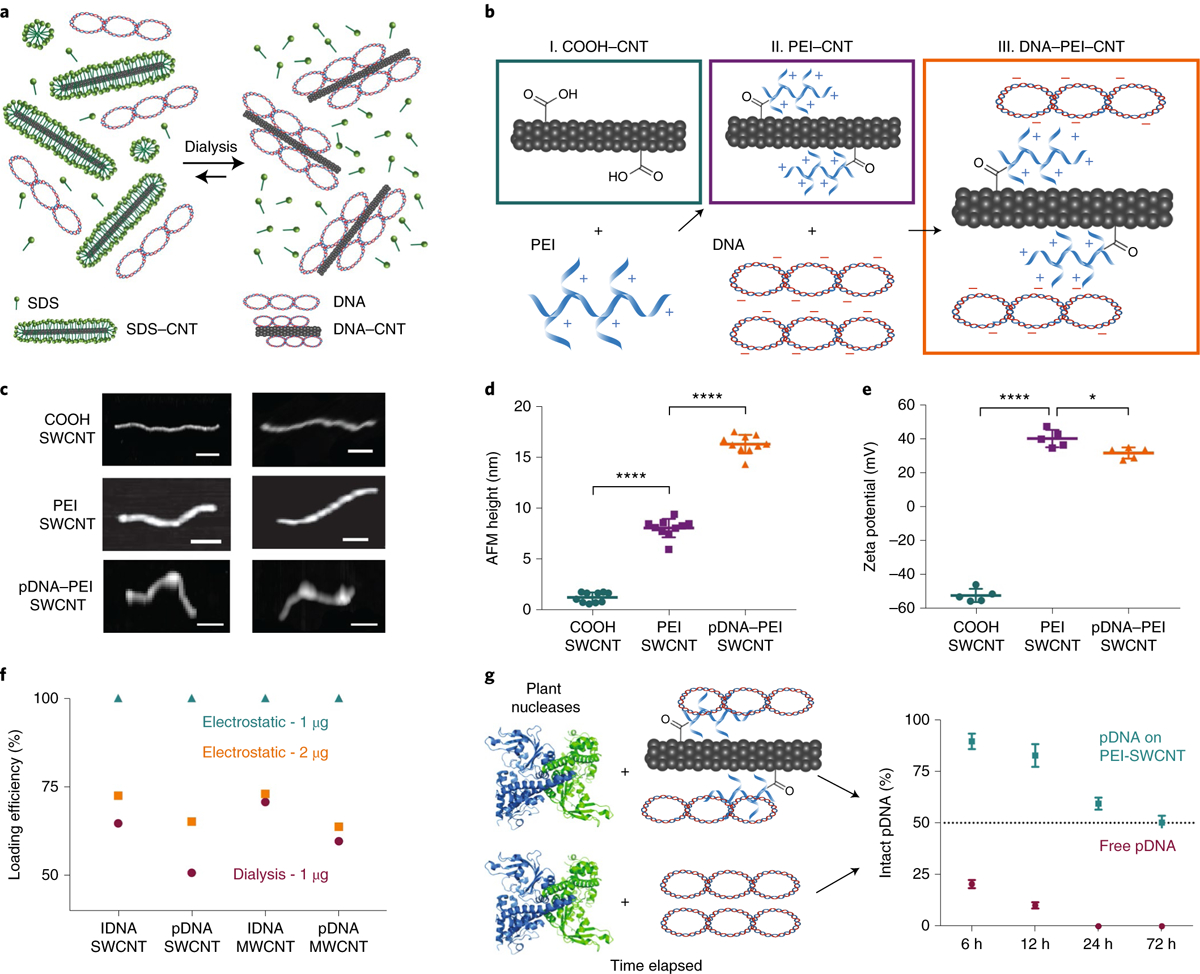
a, DNA grafting on surfactant-suspended CNTs through π–π stacking via the dialysis method. b, DNA grafting on PEI-modified carboxylated CNTs through electrostatic attachment. c, Representative AFM images of carboxylated SWCNTs, PEI-modified SWCNTs and plasmid DNA-loaded PEI-modified SWCNTs. Scale bars, 100 nm. d, Average height profile of SWCNTs before and after PEI reaction and pDNA loading measured via AFM. ****P < 0.0001 in one-way analysis of variance (ANOVA). Error bars indicate s.d. (n = 10). e, Zeta potential measurements of SWCNTs before and after PEI reaction and pDNA loading measured via dynamic light scattering (DLS). *P = 0.0191 and ****P < 0.0001 in one-way ANOVA. Error bars indicate s.d. (n = 5). f, Agarose gel electrophoresis quantification (Supplementary Figs. 1 and 2) demonstrates a loading efficiency of 1 μg DNA onto 1 μg electrostatically modified and dialysis-made CNTs, and a loading efficiency of 2 μg DNA onto 1 μg electrostatically modified CNTs. g, Degradation of free pDNA versus pDNA on PEI–CNTs by plant nucleases obtained from a leaf lysate solution suggests pDNA protection on CNT scaffolds. Error bars indicate s.d. (n = 3).
The second method developed for DNA grafting on CNTs is electrostatic grafting, in which carboxylated CNTs (COOH–CNT) are first covalently modified with a cationic polymer (poly-ethylenimine, PEI) to carry a net positive charge. Next, positively charged CNTs (PEI–CNT) are incubated with negatively charged DNA vectors (Fig. 1b). The attachment of PEI and adsorption of DNA on CNTs was verified by AFM via CNT height increases after each step (Fig. 1c). Nanoparticle heights before and after reaction with PEI are measured to be 1.3 nm and 8.1 nm for COOH– and PEI–SWCNT, respectively, confirming PEI binding. AFM also revealed that the SWCNT height increases from 8.1 nm to 16.3 nm after incubation with DNA vectors, as expected, further confirming DNA grafting on SWCNTs (Fig. 1d). AFM characterization of MWCNT conjugates is provided in Supplementary Fig. 2.
The covalent attachment of PEI and electrostatic adsorption of DNA on CNTs was also confirmed through zeta potential measurements (Fig. 1e), after extensive washing of free unreacted PEI. The initial zeta potential of −51.9 mV for COOH–SWCNT increases to +40.2 mV after reaction with positively charged PEI, and subsequently decreases to +31.7 mV when incubated with negatively charged DNA, confirming PEI attachment and DNA adsorption. The complete characterization (zeta potential, AFM height and length, DNA loading efficiency) of electrostatically prepared CNT conjugates is summarized in Supplementary Fig. 2.
We note that DNA–CNT conjugates prepared via electrostatic grafting have higher DNA loading efficiencies compared to the conjugates prepared via the dialysis method. We demonstrate that the optimum DNA amount to be loaded on PEI–CNTs has a 1:1 DNA:CNT mass ratio (Fig. 1f). Electrostatically grafted CNTs have 100% DNA loading efficiencies, whereas dialysis-loaded DNA–CNTs show 50–70% loading efficiencies when loaded with the same amount of DNA (Supplementary Fig. 2). The intracellular stability of DNA-loaded PEI–CNT conjugates was assessed by incubating conjugates with proteins at a total protein concentration similar to plant intracellular conditions. After 3 days of PEI–CNT incubation with proteins, half of the DNA remains adsorbed on the nanoparticles (Supplementary Fig. 2), suggesting a similar stability in plant tissues. We also show that DNA adsorbed on PEI–CNTs is partially protected from endonuclease degradation compared to free DNA, when incubated with total proteins extracted from plant leaves. Following a 3 day incubation with plant cell lysate, 100% of free DNA is degraded, whereas 50% of DNA on DNA–PEI–CNTs remains intact (Fig. 1g and Supplementary Fig. 2). DNA protection on CNTs was further validated via single-molecule total internal reflection fluorescence (smTIRF) microscopy: upon treatment with S1 nuclease, free DNA is degraded by 81.4%, whereas DNA on CNTs is only degraded by 49.8%, commensurate with our bulk assays (Supplementary Fig. 3).
DNA delivery into mature plants with CNTs
Functional gene expression studies were implemented with arugula and cotton plant leaves to demonstrate the applicability of our platform to transform crop plants in addition to traditional model laboratory species, such as N. benthamiana (Nb). Furthermore, gene delivery and protein expression studies were carried out with wheat plants, demonstrating that our platform is also applicable to transform monocot plant species in addition to dicot plants.
After preparation of DNA–CNT conjugates with GFP-encoding DNA plasmids or linear PCR amplicons with dialysis or electrostatic grafting, DNA–CNTs were infiltrated into the true leaves of mature plants by introducing a small puncture on the abaxial surface of the leaf lamina with a pipette tip and infiltrating the solution with a needleless syringe. Post-infiltration, we hypothesize that DNA–CNTs traverse the plant cell wall and membrane to enter the plant cell (Fig. 2a). To confirm internalization of nanoparticles into mature leaf cells, Cy3-tagged DNA–CNTs were delivered to plant leaves and the nanoparticle fate was assessed with confocal microscopy of the infiltrated leaf tissue (Fig. 2b). For this experiment, a GFP mutant Nb plant was used, which constitutively expresses GFP, so that we could co-localize the Cy3 fluorescence from the DNA–CNTs with GFP fluorescence from inside the cells. When Cy3–DNA is delivered without CNTs, we do not observe co-localization of Cy3 fluorescence with GFP (due to lack of Cy3 fluorescence), suggesting that Cy3–DNA alone does not internalize into cells. However, when Cy3–DNA–CNTs are delivered into the leaves, we observe 62% co-localization between the Cy3 and intracellular GFP channels, which suggests efficient internalization of DNA–CNTs into the plant cell cytoplasm (Fig. 2b). Internalization of nanoparticles into mature leaf cells is also shown in wild-type Nb plants via high-resolution confocal imaging, which demonstrates Cy3–DNA–CNT localization both in the cell cytosol and nucleus (Supplementary Fig. 4).
Fig. 2 |. DNA delivery into mature plant leaves with CNTs and subsequent GFP expression.
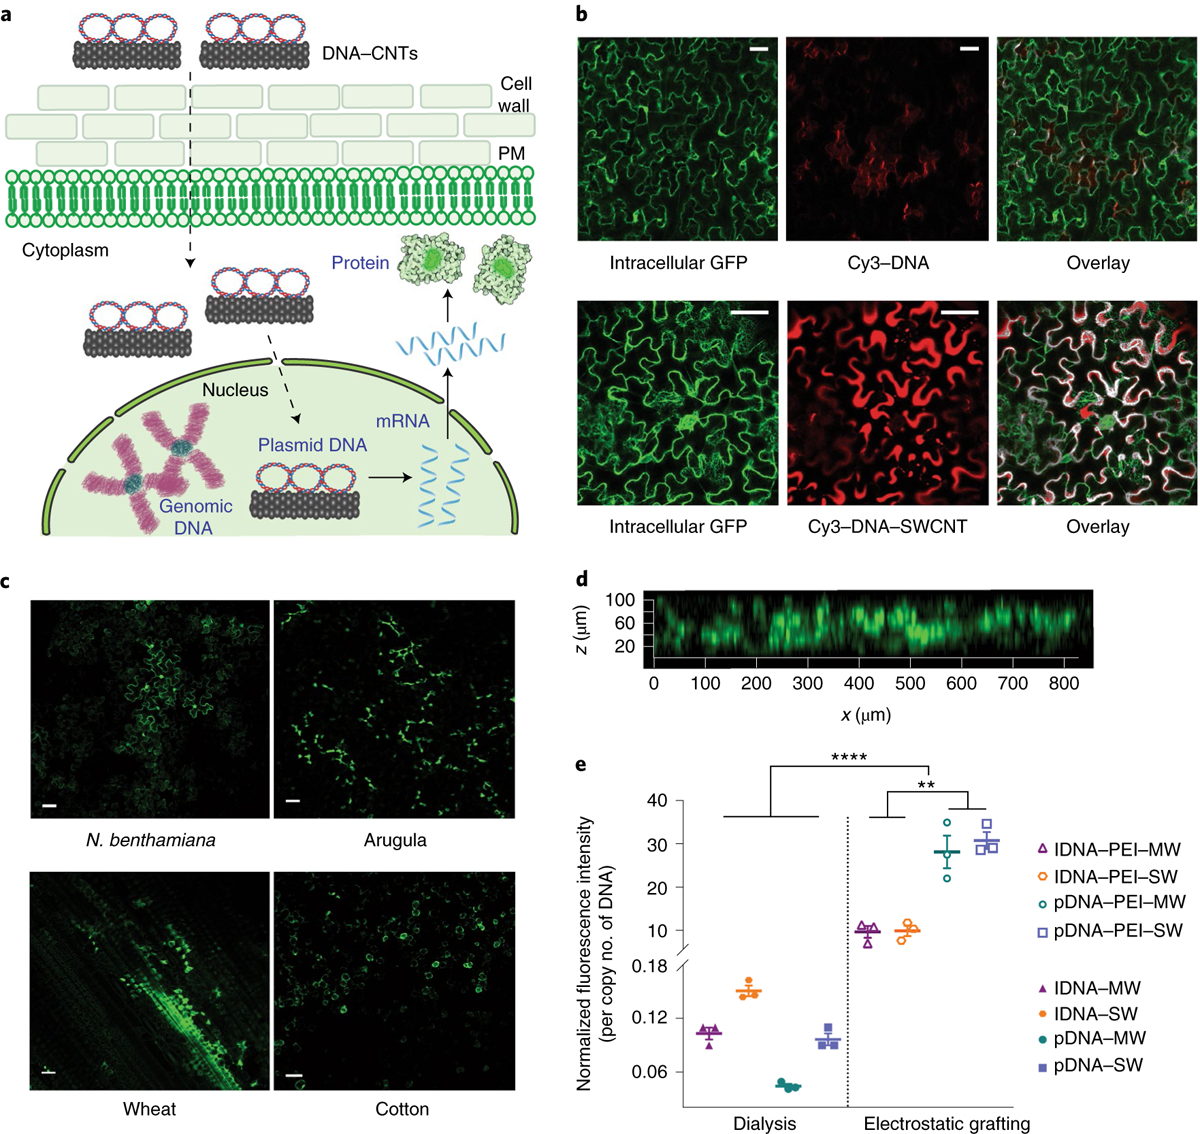
a, Schematic depicting DNA–CNT trafficking in plant cells and subsequent gene expression (dotted lines represent trafficking steps and the rigid lines represent gene expression steps). PM, plasma membrane. b, Nanoparticle internalization into mature plant cells is shown by imaging Cy3-tagged DNA–CNTs with confocal microscopy, compared to a control sample of Cy3-tagged DNA without CNTs, in a transgenic mGFP5 Nb plant. c, Wild-type Nb, arugula, wheat and cotton leaves infiltrated with DNA–CNTs are imaged with confocal microscopy to determine GFP expression levels in the leaf lamina of each plant species. d, Z-stack analysis of the fluorescence profile of the DNA–CNT-treated arugula leaf close to the infiltration area. e, Quantitative fluorescence intensity analysis of arugula confocal images for all nanomaterial formulations. **P = 0.001 and ****P < 0.0001 in one-way ANOVA. Error bars indicate s.e.m. (n = 3). Scale bars, 50 μm. All experiments were carried out with intact leaves attached to healthy plants.
Internalization of DNA–CNTs into mature leaf cells was also confirmed with transmission electron microscopy (TEM) and direct NIR imaging of CNTs inside the leaf tissue by taking advantage of the intrinsic NIR fluorescence of SWCNTs (Supplementary Fig. 5). NIR imaging of leaves infiltrated with DNA–CNTs reveals that the amount of CNTs per leaf area decreases by approximately 50% over 21 days, probably due to cell division and leaf expansion, and thus CNT dilution (Supplementary Fig. 5). We also assessed whether DNA–PEI–CNTs can internalize into chloroplasts. Interestingly, DNA–PEI–CNTs, which have a positive zeta potential (+32 mV), internalize into extracted chloroplasts (Supplementary Fig. 6). Our DNA–PEI–CNT chloroplast internalization results are in agreement with the lipid exchange envelope penetration model, which predicts internalization of nanoparticles with a smallest dimension at or below ~20 nm and with zeta potential values above or below ~+30 mV or ~−30 mV, respectively27,28.
Leaves infiltrated with DNA–CNTs for GFP expression were imaged with confocal microscopy, and expression of GFP was observed in the cells of the leaf lamina 72 h post-infiltration in all plant species tested (Nb, arugula, wheat and cotton; Fig. 2c). Z-stack analysis of the fluorescence profile of the DNA–CNT treated leaves shows that GFP fluorescence originates from the full thickness of the leaves, confirming that CNT nanocarriers diffuse and penetrate through the full leaf profile (Fig. 2d). No GFP expression is detected in the leaves when free DNA vectors, PEI–DNA complexes or PEI–CNTs are delivered in control studies (Supplementary Fig. 7). Additionally, the spatial distribution of CNTs inside a leaf is modelled with a diffusion-reaction equation using the GFP expression profile as a proxy for nanocarrier diffusivity (Supplementary Fig. 8; see Supplementary Information for model details).
The efficiency of CNT nanocarrier internalization and GFP expression varies substantially for the different nanomaterial formulations we tested. Quantitative fluorescence intensity analysis of confocal images for arugula leaves indicates that GFP expression is significantly higher for DNA–CNTs prepared through electrostatic grafting compared to GFP expression induced by DNA–CNT conjugates prepared via π–π grafting with dialysis (Fig. 2e; see Supplementary Information for a discussion of the CNT surface chemistry effect on the delivery efficiency). Our most efficient DNA–CNT formulation is plasmid DNA delivered with PEI-functionalized SWCNT (pDNA–PEI–SWCNT), which is over 700 times more efficient than plasmid DNA adsorbed on pristine MWCNT via dialysis (pDNA–MWCNT), our least-efficient DNA–CNT formulation. Based on these results, all subsequent mature leaf transformation studies were performed with pDNA–PEI–SWCNTs, unless otherwise noted.
We further demonstrate that CNT-mediated gene expression is transient in mature plant leaves, independent of the plant species. Representative confocal images of pDNA–PEI–CNT infiltrated Nb (Fig. 3a), and corresponding quantitative fluorescence intensity analysis of these images demonstrates that the highest GFP fluorescence intensity at day 3 disappears by day 10 (Fig. 3b). Similarly, quantitative PCR (qPCR) analysis of GFP mRNA corroborates our confocal imaging results. For pDNA–PEI–CNT treated Nb leaves, we observe an over 7,500-fold GFP mRNA increase at 3 days post-infiltration, which drops to an insignificant twofold mRNA change by day 10 (Fig. 3c), revealing that maximal GFP expression occurs at day 3 with transient expression that lasts through day 10. Similar GFP expression profiles at day 3 and 10 are also verified with arugula, wheat and cotton mature leaves (Fig. 3d). Compared to CNT-mediated expression, however, Agrobacterium-mediated GFP expression in mature arugula leaves did not cease at day 10, as shown by confocal imaging (Fig. 3e), GFP fluorescence intensity quantification (Fig. 3f) and qPCR analysis (Fig. 3g), supporting the established concept of plasmid DNA genomic integration with Agrobacterium-mediated delivery36.
Fig. 3 |. transient CNT-mediated GFP expression in mature plant leaves and nanoparticle toxicity assessment.
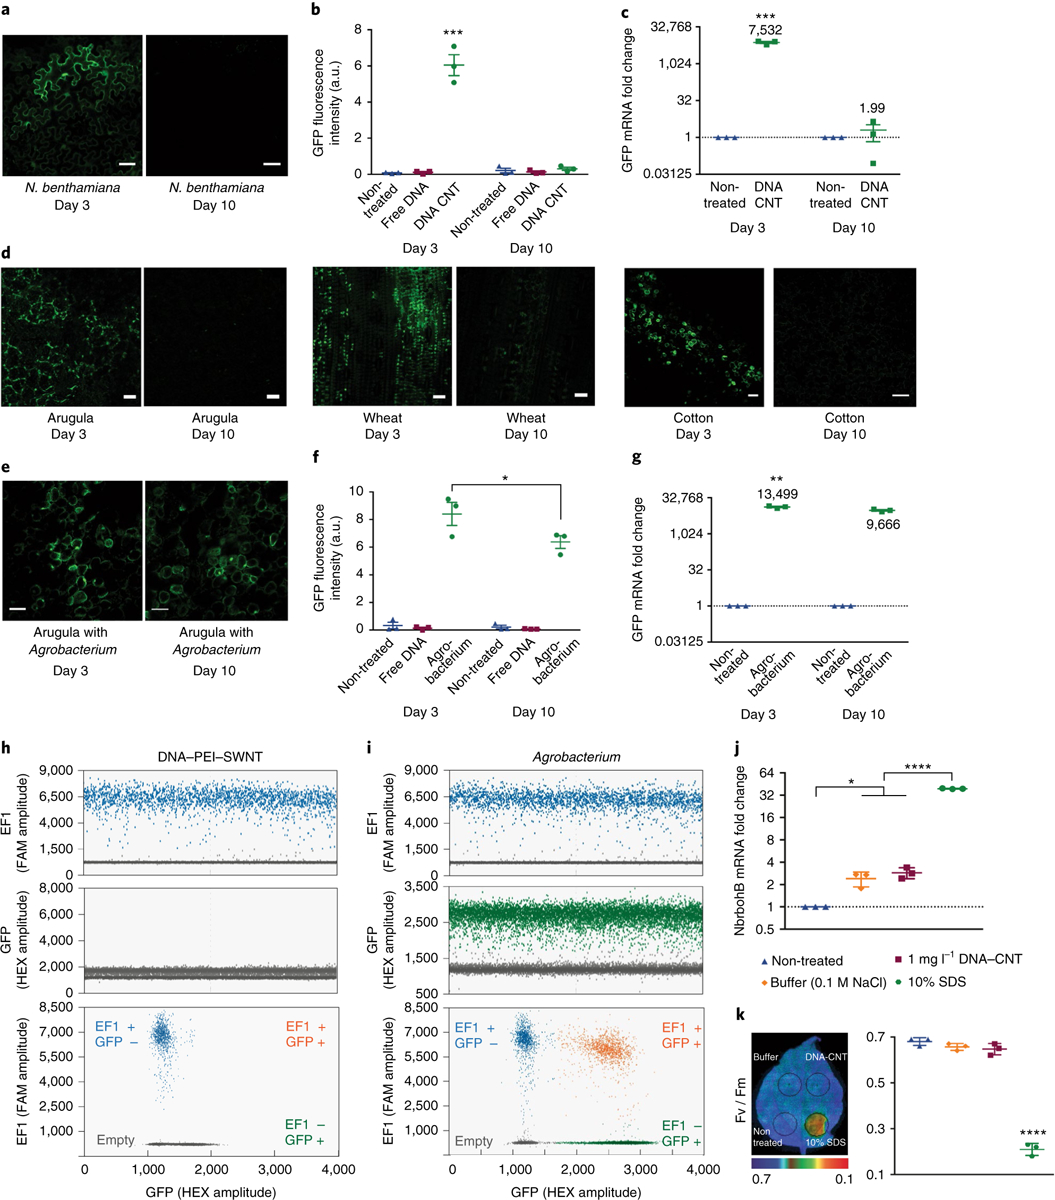
a, Representative confocal microscopy images of pDNA–PEI–CNT-infiltrated mature Nb leaves imaged at day 3 and 10. b, Quantitative fluorescence intensity analysis of confocal images at 3 and 10 days post-infiltration. ***P = 0.0001 in two-way ANOVA. c, qPCR analysis of GFP mRNA expression levels at day 3 and day 10 in pDNA–PEI–CNT-treated Nb leaves. ***P = 0.0003 in two-way ANOVA. d, Representative confocal microscopy images at day 3 and day 10 in pDNA–PEI–CNT-infiltrated mature arugula, wheat and cotton leaves. e, Representative confocal microscopy images of Agrobacterium-infiltrated mature Nb leaves imaged at day 3 and day 10. Scale bars, 50 μm. f, Quantitative fluorescence intensity analysis of Agrobacterium-transformed leaves at 3 and 10 days post-infiltration. *P = 0.012 in two-ay ANOVA. g, qPCR analysis of Agrobacterium-transformed leaf at day 3 and day 10. **P = 0.0028 in two-way ANOVA. h, Droplet digital PCR (ddPCR) with fluorescein (FAM) and hexachlorofluorescein (HEX) probes of DNA–PEI–CNT-infiltrated Nb leaves i, ddPCR results of Agrobacterium-infiltrated Nb leaves. j, qPCR analysis of NbrbohB, a known stress gene in Nb plants, relative to the housekeeping gene Elongation Factor 1 (EF1), to test CNT toxicity. *P = 0.0169 and ****P < 0.0001 in one-way ANOVA. k, Quantum yield measurements of photosystem II to test whether CNT-infiltrated leaves have similar photosynthesis quantum yield as control leaves without CNT infiltration. Fv/Fm ratio represents the variable/maximum fluorescence measurement of the Photosystem II quantum efficiency. ****P < 0.0001 in one-way ANOVA. All error bars indicate s.e.m. (n = 3). All experiments are done with intact leaves attached to healthy plants.
Our results, both at the mRNA transcript and fluorescent protein levels, demonstrate that GFP expression is transient and suggest that genes delivered into plant cells via CNT nanocarriers do not integrate into the plant nuclear genome. We tested the non-integration of plasmid DNA into the plant nuclear genome via droplet digital PCR (ddPCR). ddPCR is a recently developed method that allows high-precision and absolute quantification of nucleic acid target sequences37–41. Here, we used ddPCR to determine whether DNA delivered with CNTs integrates into plant genomic DNA, and compared the genomic DNA integration rates of CNT nanocarriers and Agrobacterium-mediated delivery methods. Our ddPCR experiments reveal that there is no transgene integration when DNA is delivered via CNTs (Fig. 3h), whereas high-frequency GFP transgene integration events are shown when Agrobacterium-mediated delivery is performed (Fig. 3i). We performed experiments with additional ddPCR control samples such as no template control (NTC), non-treated leaf and free DNA infiltrated leaf. As expected, amplification of neither EF1 nor GFP genes is observed in the NTC (as there is no genomic DNA added), and amplification of only the EF1 gene is observed in non-treated or free DNA infiltrated leaves (Supplementary Fig. 9). The transient production of GFP in leaves induced by DNA–PEI–CNT and Agrobacterium-mediated delivery was quantified 3 days after infiltration. We find that PEI–CNTs and Agrobacterium-mediated DNA delivery produce 13.6 μg and 21.9 μg GFP per gram of fresh weight of leaves, respectively. A comparison between CNT-mediated delivery and the gene gun is provided in the Supplementary Information and Supplementary Fig. 10.
Testing CNT toxicity and damage in plant leaves
To test CNT nanocarrier biocompatibility, we undertook plant toxicity and tissue damage tests. Specifically, for toxicity analyses, we performed qPCR analysis of respiratory burst oxidase homologue B (NbrbohB) upregulation, a known stress gene representing many different types of stress conditions in Nb plants42. Quantification of NbrbohB expression shows that DNA–CNT-treated areas do not upregulate NbrbohB compared to adjacent areas within the same leaves treated only with buffer (Fig. 3j). qPCR analysis of NbrbohB expression was also performed for PEI-functionalized CNT-infiltrated leaves at short time points (3, 6 and 12 h) and a long time point (14 days). qPCR results show that PEI–CNTs exhibit a twofold upregulation of NbrbohB at 3 h, which returns to non-treated levels by 6 h, and show that there is no long-term toxicity caused by PEI–CNTs as assessed at a longer 14 day time point (Supplementary Fig. 11).
Additionally, quantum yield measurements of photosystem II43 show that DNA–CNT-infiltrated areas in Nb leaves have similar photosynthesis quantum yields as control areas within the same leaves that are infiltrated only with buffer (Fig. 3k). Positive controls to induce plant stress for both NbrbohB qPCR and photosystem II quantum yield measurements show clear upregulation of NbrbohB and a significant decrease in photosystem II quantum yield in Nb. We also analysed leaf tissue damage visually and via confocal microscopy, which again show no sign of tissue damage in CNT-infiltrated leaves (Supplementary Fig. 11). Our results suggest that the CNT-based delivery platform is biocompatible and does not induce toxicity or tissue damage to mature plants with the conditions used in the present study. See Supplementary Information for the stability and storage of PEI–CNT nanoparticles.
DNA delivery into isolated protoplasts with CNTs
We further investigated the ability of CNT nanocarriers to deliver plasmid DNA and trigger functional gene expression in a different plant system—isolated protoplasts—which are cultured plant cells without cell walls that are used extensively in plant biotechnology. Recently, it has been shown that certain CNT formulations can internalize into plant mesophyll protoplasts44. Protoplasts are used to increase the throughput of plant genetic screens and for the synthesis of recombinant proteins, thus benefiting from a facile, passive, high-efficiency and species-independent transformation platform45. For this purpose, intact and healthy protoplasts were extracted from arugula leaves through enzymatic cell wall degradation (Fig. 4a) with high efficiency and high yield (107 total protoplasts per 10 leaves). Isolated protoplasts were incubated with Cy3–DNA–CNTs and subsequently stained with a nuclear marker, DAPI. Imaging of protoplasts incubated with Cy3–DNA–CNTs confirmed nanomaterial internalization into the protoplast cytoplasm and nucleus, which is absent when Cy3–DNA is delivered without CNTs (Fig. 4b). Nanoparticle internalization into isolated protoplasts was also confirmed through direct NIR imaging of DNA–CNTs. When DNA–CNTs are co-incubated with a protoplast solution, we observe near-infrared (NIR) CNT fluorescence that co-localizes with the bright-field image of the protoplast, confirming internalization. Conversely, without DNA–CNT addition, no NIR fluorescence is observed (Supplementary Fig. 12).
Fig. 4 |. DNA delivery into isolated protoplasts with CNTs and subsequent GFP expression.
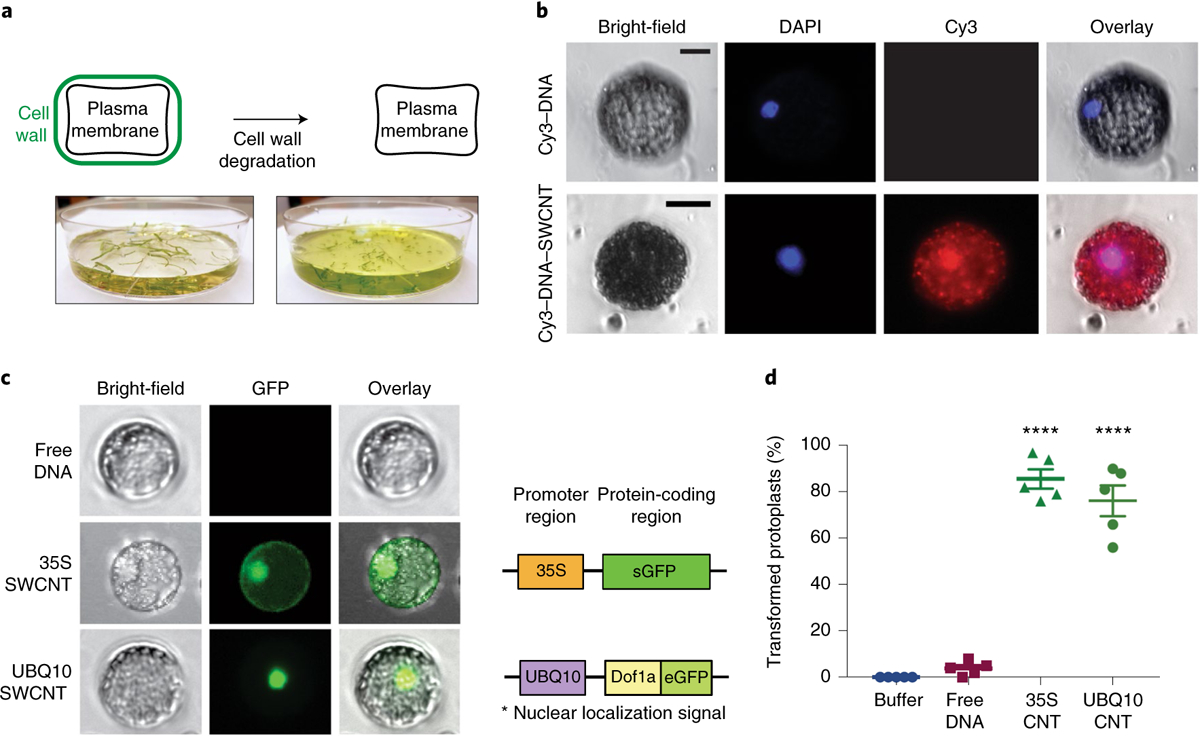
a, Intact and healthy protoplast extraction from arugula leaves (intact leaves attached to plants) through enzymatic cell wall degradation. b, Verification of nanoparticle internalization into isolated protoplast cytosol and nucleus by imaging the Cy3–DNA–CNTs after incubation with DAPI-stained protoplasts. Scale bars, 20 μm. c, GFP expression imaging of protoplasts incubated with 35S and UBQ10 plasmids carrying DNA–CNTs via fluorescence microscopy. Protoplast diameters are ~20 μm. d, Percentage of the total isolated protoplasts transformed with 35S–CNTs and UBQ10–CNT after 24 h incubation with plasmid DNA–CNTs. ****P < 0.0001 in one-way ANOVA. Error bars indicate s.e.m. (n = 5).
For gene expression studies, isolated protoplasts were incubated with plasmid DNA–CNTs prepared via dialysis, and subsequently imaged with fluorescence microscopy. In addition to the plasmid used in leaf studies (35S–GFP), for protoplast experiments we also used a plasmid that encodes a nuclear localization signal (UBQ10–GFP, Supplementary Fig. 13), which transports the expressed GFP protein from the cytosol into the nucleus. Protoplasts incubated with both types of DNA–CNT show GFP expression correctly localized in cells, whereas protoplasts incubated with free plasmids without CNTs do not show GFP expression (Fig. 4c). CNT-mediated protoplast transformation efficiencies are 76% and 86% with UBQ10–CNTs and 35S–CNTs, respectively (Fig. 4d and Supplementary Fig. 12). Our earlier work on CNT internalization into extracted chloroplasts suggests that nanoparticle internalization through the lipid bilayer occurs within seconds of CNT exposure27. Thus, our CNT-based plasmid DNA delivery platform enables rapid and passive delivery of DNA into protoplasts and transgene expression with high efficiency and no observable adverse effects on protoplast viability.
Conclusions
Genetic engineering of plants may address the crucial challenge of cultivating sufficient food, natural product therapeutics and bio-energy for an increasing global population living under changing climatic conditions. Despite advances in genetic engineering across many biological species, the transport of biomolecules into plant cells remains one of the major limitations for rapid, broad-scale and high-throughput implementation of plant genetic engineering, particularly for intact plant tissues and organs. We thus present a nanomaterial-based delivery platform that permits diverse conjugation chemistries to achieve DNA delivery without transgene integration in both model and crop plants, and in both dicot and monocot plants, with high efficiency and without toxicity or tissue damage. In this study, we show the development and optimization of dialysis and electrostatic grafting methods for loading DNA plasmids or linear amplicons onto high aspect ratio CNTs. We confirm the feasibility and test the efficacy of this platform by delivering reporter GFP DNA constructs into mature N. benthamiana, arugula, wheat and cotton leaves, and arugula protoplasts, and obtain strong expression of a functional transgenic protein.
The nanomaterial-based transient plant transformation approach demonstrated herein is beneficial for plant biotechnology applications where gene expression without transgene integration is desired, and is amenable to multiplexing, whereby multiple gene vectors are to be delivered and tested rapidly in a combinatorial manner and in parallel46. This approach may aid high-throughput screening in mature plants so as to rapidly identify genotypes that result in desired phenotypes, mapping and optimization of plant biosynthetic pathways, and maximization of plant-mediated natural product synthesis, most of which currently rely on Agrobacterium-mediated transformation47. CNT-mediated delivery is well suited for such transient applications as it is easy, cost-effective, non-destructive, fast, species-independent and scalable.
Additionally, global regulatory oversight for genetically modified organisms (GMOs) is motivating the future development of non-integrative and/or DNA-free plant genetic transformation approaches in which the delivered gene expression is transient and foreign DNA is not integrated into the plant genome48. However, the most commonly used tool today for plant genetic transformations—Agrobacterium-mediated transformation technology—is unable to perform DNA- and transgene-free editing, and yields random DNA integration. Similarly, DNA delivery methods that utilize a gene gun or other external forces such as vortexing can cause cell damage, which leads to increased rates of transgene integration, possibly due to the over-activation of the endogenous cellular DNA repair mechanisms commonly induced by stress and cell/DNA damage.
Notably, when combined with nuclease-based genome editing cargoes such as zinc finger nucleases (ZFNs), transcription activator-like effector nucleases (TALENs), clustered regularly inter-spaced short palindromic repeats (CRISPR) from Prevotella and Francisella 1 (Cpf1), and CRISPR associated protein 9, CNTs could enable transient expression of these tools for the production of permanent (stable) edits. As such, CNT-based delivery of these biomolecular cargoes could enable high-efficiency genome modification without transgene integration, thus circumventing strict GMO regulations. This latter application of the presented technology could be particularly beneficial for heterogeneous plant species such as cassava, cacao and sugarcane, in which crossing cannot be used to remove transgenes. Furthermore, CNTs are shown herein to protect DNA cargo against nuclease degradation, a feature of CNT-based delivery that may be extended to the protection of other biological cargoes of interest.
In this study we have thus developed nanoparticle-based plant transformation biotechnologies that show high-efficiency and species-independent delivery of plasmid DNA and linear amplicons, and transient expression of encoded proteins, which can potentially be used as a transgene-free plant genetic engineering approach when combined with nuclease-based genome editing tools. As such, CNT-based plant transformations are a useful addition to the plant biotechnology toolkit.
Methods
Procurement and preparation of chemicals and nanomaterials.
Super-purified HiPCO SWCNTs (lot no. HS28–037) were purchased from NanoIntegris, MWCNTs (lot no. R0112) were purchased from NanoLab and both CNT samples were extensively purified before use49. Carboxylic acid-functionalized SWCNTs (lot no. MKBX0303V) and MWCNTs (lot no. BCBR9248V) were purchased from Sigma-Aldrich. GFP-encoding dicot plasmids (35S–GFP–NOS and UBQ10–GFP–NOS) were obtained from the Sheen Lab, Harvard Medical School50. GFP-encoding monocot plasmid (osACTIN–GFP–NOS) was obtained from the Staskawicz Lab, UC Berkeley. The 35S–GFP–NOS plasmid expresses sGFP–S65T with a 35S promoter, has no subcellular localization signals and is around 4.2 kbp in length. The UBQ10–GFP–NOS plasmid expresses eGFP with a UBQ10 promoter, has a subcellular localization signal for GFP to the nucleus (Dof1a) and is around 5.4 kbp in length. The osACTIN–GFP–NOS plasmid expresses eGFP with an osACTIN monocot promoter, has no subcellular localization signals, and is around 5.2 kbp in length. 20K MWCO dialysis cassettes were purchased from Thermo Scientific. The following chemicals were purchased from Sigma-Aldrich: stains-all dye (95%), SDS (molecular biology grade), sodium chloride, MES hydrate, d-mannitol, calcium chloride dihydrate (suitable for plant cell culture), potassium chloride, magnesium chloride hexahydrate, bovine serum albumin (heat shock fraction), polyethylene glycol (4K) and polyethylenimine (branched, 25K). Cellulase R10 and macerozyme R10 enzymes were purchased from Grainger. Single-stranded DNA (ssDNA) polymers were purchased from IDT and dissolved in 0.1 M NaCl before use. All ddPCR reagents and materials were purchased from Bio-Rad. BSA–biotin and NeutrAvidin were purchased from Sigma-Aldrich and S1 nuclease was purchased from Promega. UltraPure DNase/RNase-free distilled water from Invitrogen was used for qPCR and ddPCR experiments, and EMD Millipore Milli-Q water was used for all other experiments.
Plant growth.
See Supplementary Information for details.
SDS–CNT, ssDNA–CNT and Cy3–DNA–CNT preparation.
HiPCO SWCNTs (3 mg) were added to 3 ml 2 wt% SDS in water and bath sonicated for 10 min, followed by probe-tip sonication with a 6 mm sonicator tip at 10% amplitude for 30 min in an ice bath (pulse 1 s on/1 s off). The resulting solution was allowed to rest at room temperature for 30 min before centrifugation at 16,100g for 1 h to remove unsuspended SWCNT aggregates and metal catalyst precursor. The concentration of SDS–SWCNTs (supernatant) was measured by recording the SWCNT absorption spectrum with a UV–vis–NIR spectrometer and calculating the SWCNT concentration in mg l−1 (absorbance at 632 nm/extinction coefficient of 0.036). The same suspension protocol was applied for MWCNTs, but their concentration was measured using a standard curve as obtained in ref.51.
For toxicity, tissue damage and internalization assays, SWCNTs were suspended in ssDNA polymers with (GT)15 or Cy3-tagged (GT)15 sequences through probe-tip sonication as previously described52. Briefly, ssDNA was dissolved at a concentration of 100 mg ml−1 in 0.1 M NaCl. A 20 μl volume of this ssDNA solution was aliquoted into 980 μl 0.1 M NaCl, and 1 mg HiPCO SWCNTs were added. The mixture was bath sonicated for 10 min, followed by probe-tip sonication with a 3 mm tip at 50% amplitude (~7 W) for 30 min in an ice bath. The resulting solution was rested at room temperature for 30 min before centrifugation at 16,100g for 1 h to remove unsuspended SWCNT aggregates and metal catalyst precursor. Unbound (free) ssDNA was removed by spin-filtering (Amicon, 100K) 10–15 times and the concentration of ssDNA–SWCNTs was determined by measuring the SWCNT absorbance at 632 nm.
Linear DNA vector preparation from plasmid DNA.
The promoter, GFP gene and terminator regions of the 35S–GFP–NOS plasmid were amplified with PCR over 35 cycles, with the following modified M13 forward and M13 reverse primers: 5′-GTAAAACGACGGCCAGT-3′ and 5′-AGCGGATAACAATTTCACACAGG-3′, respectively. Following PCR, pure DNA vector was obtained by using a PureLink PCR purification kit (Invitrogen) to eliminate primers, unreacted nucleotides and enzymes. To check the amplification quality, the resulting amplicon was sent for Sanger sequencing, and was also run with agarose gel electrophoresis (see Supplementary Fig. 11 for plasmid maps and linearization results).
Direct adsorption of DNA onto CNTs via dialysis.
SDS–CNT solution containing 1 μg of CNTs, and 10 μg of free plasmid DNA were placed into an accurate pore-sized dialysis cartridge (20 kDa molecular weight cutoff (MWCO), 0.5 ml), that allowed the exit of SDS monomers that desorbed from the CNT surface, while free plasmid DNA suspended the CNTs, which remained inside the dialysis cartridge. If necessary due to volume considerations, 2 wt% SDS was used to fill the additional volume of dialysis cartridge to ensure there was no free air space in the cartridge. After 4 days of dialysis with continuous stirring at room temperature and changing the dialysis buffer (0.1 M NaCl) daily, we obtained a stable suspension of plasmid DNA-conjugated CNTs. The preparation protocol was same for both plasmids and linearized DNA vectors, and for both types of CNT (SWCNTs and MWCNTs). The NIR fluorescence spectra of dialysis-suspended CNTs were obtained through NIR fluorescence microscopy using 721 nm laser excitation and an inverted microscope outfitted with an InGaAs sensor array for imaging4.
Control studies for dialysis.
A control cartridge consisting of an SDS–CNT solution containing 1 μg of CNTs in 2 wt% SDS, but lacking DNA, was dialysed in parallel under the same conditions to ensure that CNTs did not suspend in solution in the absence of plasmid DNA, confirming plasmid DNA adsorption to CNTs in the main sample. Stains-all dye, which changes colour in the presence of SDS, was used to determine %SDS in the dialysis cartridge. A standard curve with the range of 0–0.016% SDS was created at the absorbance wavelength, 453 nm. Five dialysis formulations, as described above, were prepared, and they were stopped at different time points along the duration of dialysis (days 0, 1, 2, 3 and 4). A 10 μl volume of dialysis solution was mixed with 1 ml 0.1% stains-all (wt:vol in formamide), and the absorbance at 453 nm was measured. By using the standard curve, the precise SDS% value in the cartridge was calculated at each day point.
Electrostatic grafting of DNA onto CNTs.
Chemical modification of CNTs to carry positive charge is described elsewhere53 and was applied here with some modifications. COOH–CNT powder (10 mg) was added to 10 ml water (this could be scaled up or down as desired at 1 mg ml−1 concentration). The solution was bath sonicated for 5 min and probe-tip sonicated with a 6 mm tip at 10% amplitude for 30 min on ice. It was rested for 30 min at room temperature and centrifuged at 16,000g for 1 h. Supernatant was taken and the SWCNT concentration was measured via absorbance at 632 nm with an extinction coefficient of 0.036 to convert to mg l−1. MWCNT concentration was measured using a standard curve as obtained in ref.3. The prepared COOH–CNT solution was mixed with PEI at a mass ratio of 1:10 CNT:PEI. The solution was bath sonicated for several minutes, and subsequently heated at 84 °C with stirring for 16 h (the reaction could be scaled up or down as desired by keeping the PEI-to-CNT mass ratio constant). The reaction mixture was subsequently cooled to room temperature and filtered with 0.4 μm and 1 μm Whatman Nucleopore membranes to filter SWCNTs and MWCNTs, respectively. The filtered product was washed vigorously with water 10 times to remove unreacted PEI from the reaction mixture, then dried and collected. Dried product (PEI–CNT) (3 mg) was subsequently suspended in 3 ml water by probe-tip sonication with a 6 mm tip at 10% amplitude for 30 min in an ice bath. The resulting solution was rested at room temperature for 30 min before centrifugation at 16,100g for 1 h to remove unsuspended CNT aggregates. The PEI–CNT solution containing 1 μg of CNTs was added into 1 μg of DNA dropwise, pipetted in and out 10 times, and incubated at room temperature for 30 min (DNA incubation could be scaled up or down by keeping the DNA-to-PEI–CNT mass ratio constant).
AFM characterization.
A 3 μl volume of sample was deposited on a freshly cleaved mica surface and left to adsorb on the surface for 5 min. The mica surface was then slowly rinsed with water three times (each time with 10 μl water) to remove the salt. The mica surface was then dried with a mild air stream using an ear-washing bulb and imaged with a MultiMode 8 AFM with NanoScope V Controller (Bruker) in tapping mode in air. All AFM images were analysed by NanoScope Analysis v1.50.
Plasmid DNA protection assay.
Total proteins (including nucleases) were extracted from wild-type Nb leaves by grinding in liquid nitrogen to obtain dry frozen powders. The frozen powders were transferred to a microcentrifuge tube with pre-prepared lysis buffer containing 400 μl of 10 mM Tris/HCl (pH 7.5), 150 mM NaCl, 1 mM EDTA, 0.1% NP-40, 5% glycerol and 1% Cocktail and vortexed briefly to mix well. After lysis at 50 °C for 5 min, the tube was centrifuged at 10,000 r.p.m. for 30 min and the supernatant containing whole proteins was collected in a new tube. Total protein extract was quantified by a Pierce 660 nm protein assay (Thermo, product no. 22660). Free pDNA (5 μg) and 5 μg pDNA on PEI–SWCNTs were each incubated with cell lysate proteins obtained from one Nb leaf to mimic the intracellular degradation conditions for 6, 12, 24 and 72 h.
After incubation, all pDNA was desorbed from SWCNTs at 95 °C for 1 h in the presence of 2% SDS and 1.5 M NaCl. Desorbed pDNA and cell lysate-treated free pDNA were run on a 1% agarose gel with pDNA standards of known quantity to measure the intact versus degraded DNA in each sample. DNA amounts on the agarose gel were quantified by using band intensity as a proxy (ImageJ Gel Analyzer) and normalized with the lanes containing known DNA quantities (all agarose gel DNA quantifications were conducted as described here).
Infiltration of leaves with CNTs.
Healthy and fully developed leaves from arugula (3–4 weeks old), N. benthamiana (4 weeks old), wheat (4 weeks old) and cotton (4 weeks old) plants were selected for experiments. A small puncture on the abaxial surface of the arugula and cotton leaf lamina was introduced with a pipette tip, and 100–200 μl of the plasmid DNA–CNT solution (or of any control solution) was infiltrated from the hole with a 1 ml needleless syringe by applying gentle pressure, with caution so as not to damage the leaf. For Nb infiltration, a tiny puncture on the abaxial surface of the leaf lamina was introduced with a sharp razor, and 100–200 μl of DNA–CNT solution (or of any control solution) was infiltrated through the puncture with a 1 ml needleless syringe by applying gentle pressure.
TEM sample preparation and imaging.
An FEI Tecnai 12 transmission electron microscope with acceleration voltage of 120 kV was used for imaging DNA–SWCNT-infiltrated and non-treated mature plant leaves. Small pieces of leaf were directly cut from the whole leaf. Samples were fixed by 2% glutaraldehyde in 0.1 M sodium cacodylate buffer at pH 7.2, followed by vacuum microwaving to remove air in the vacuoles. Samples were post-fixed with 1% osmium tetroxide in 0.1 M sodium cacodylate buffer at pH 7.2, dehydrated with acetone and transferred to epoxy resin. Finally, epoxy resin-embedded samples were cut with a diamond knife into 70-nm-thin cross-sectioned films using a Reichert-Jung Ultracut E, then transferred onto bare Cu TEM grids for imaging.
Imaging of infiltrated leaves for internalization and GFP expression.
After infiltration, plants with attached infiltrated leaves were left in the plant growth chamber to allow for internalization for 6 h, and imaged with either a NIR microscope to track SWCNTs or with a confocal microscope to track Cy3-tagged DNA–SWCNTs in the leaves. For GFP expression and transience studies, infiltrated leaves were imaged after 3 and 10 days with a confocal microscope. For wheat leaf infiltrations, a sharp razor blade was used to produce a small puncture on the abaxial surface of 3- to 4-week-old plant leaves, and 100–200 μl of the plasmid DNA–CNT solution (or of any control solution) was infiltrated with a 1 ml needless syringe. Plants were returned to the growth chamber and imaged with a confocal microscope after 3 and 10 days post infiltration.
Quantitative fluorescence intensity analysis of GFP gene expression.
DNA–CNT-infiltrated plant leaves were prepared for confocal imaging 72 h post infiltration by cutting a small leaf section of the infiltrated leaf tissue, and inserting the tissue section between a glass slide and coverslip of #1 thickness. A 100 μl volume of water was added between the glass slide and coverslip to keep the leaves hydrated during imaging. A Zeiss LSM 710 confocal microscope was used to image the plant tissue with 488 nm laser excitation and with a GFP filter cube. GFP gene expression images were obtained at ×10 and ×20 magnification. Confocal image data were analysed to quantify GFP expression across samples. For each sample, three biological replicates (three infiltrations into three different plants) were performed, and for each biological replicate, 15 technical replicates (15 non-overlapping confocal fields of view from each leaf) were collected. Each field of view was analysed with custom ImageJ analysis to quantify the GFP fluorescence intensity value for that field of view, and all 15 fields of view were then averaged to obtain a mean fluorescence intensity value for that sample. The same protocol was repeated for all three biological replicates per sample, and averaged again for a final fluorescence intensity value, which correlates with the GFP expression produced by that sample.
qPCR experiments for gene expression.
Two-step qPCR was performed to quantify GFP gene expression in wild-type Nb plants with the following commercially available kits: RNeasy plant mini kit (QIAGEN) for total RNA extraction from leaves, iScript cDNA synthesis kit (Bio-Rad) to reverse transcribe total RNA into cDNA, and PowerUp SYBR green master mix (Applied Biosystems) for qPCR. The target gene in our qPCR was GFP, and the reference gene was elongation factor 1 (EF1). Primers for these genes were ordered from IDT. The GFP primers used are: forward 5′-CGCCGAGGTGAAGTT-3′; reverse 5′-GTGGCTGTTGTAGTTGTAC-3′. Primers for EF1 are: forward 5′-TGGTGTCCTCAAGCCTGGTATGGTTGT-3′; reverse 5′- ACGC TTGAGATCCTTAACCGCAACATTCTT-3′. An annealing temperature of 60 °C was used for qPCR, which we ran for 40 cycles. qPCR data were analysed by the ddCt method54 to obtain the normalized GFP gene expression fold change with respect to the EF1 housekeeping gene and control sample. For each sample, qPCR was performed as three technical replicates (three reactions from the same isolated RNA batch), and the entire experiment consisting of independent infiltrations and RNA extractions from different plants was repeated three times (three biological replicates).
Agrobacterium-mediated transformation.
See Supplementary Information for details.
Biolistic delivery of plasmid DNA.
See Supplementary Information for details.
ddPCR experiments.
See Supplementary Information for details.
Quantification of GFP protein amount in leaves.
See Supplementary Information for details.
Plant toxicity analysis.
To test for plant stress and toxicity, the expression level of an oxidative stress gene (NbRbohB)42 in Nb leaves was measured through qPCR with the following primers: forward 5′-TTTCTCTGAGGTTTGCCAGCCACCACCTAA-3′; reverse 5′-GCCTTCATGTTGTTGACAATGTCTTTAACA-3′. EF1 was again measured as a housekeeping gene with the same primer set as described above. An annealing temperature of 60 °C was used for qPCR, which was run for 40 cycles, and the ddCt method was used to obtain the normalized NbRbohB expression fold change with respect to the EF1 housekeeping gene and control sample. This toxicity qPCR assay was carried out both for ssDNA–SWCNTs and pDNA–PEI–SWCNTs in triplicate independent experiments.
As an additional toxicity assay, the Fv/Fm ratio, representing the variable/maximum fluorescence measurement of the photosystem II quantum efficiency43, of infiltrated Nb leaves were measured with an Imaging-PAM Maxi fluorimeter (Walz). A singular leaf was infiltrated from the abaxial surface, in three distinct locations within the same leaf, with buffer (0.1 M NaCl), 1 mg l−1 DNA–SWCNTs or 10% SDS (positive control for toxicity). The fourth quadrant of the leaf was left unperturbed. The triply infiltrated leaf was subsequently incubated for 24 h without further perturbation. Subsequently, the infiltrated leaf was dark-adapted for 15–30 min and chlorophyll fluorescence-related parameters were measured with the Imaging-PAM Maxi fluorimeter to calculate the Fv/Fm ratio, which is commonly used to test for plant stress.
Protoplast isolation from E. sativa leaves.
Protoplasts were isolated from arugula and Nb leaves as described in ref.50 with some modifications. Briefly, thinly cut leaf strips were immersed in 20 ml of enzyme solution (consisting of cellulase and macerozyme), vacuum infiltrated for an hour in the dark using a desiccator, and further incubated at 37 °C for 3 h in the dark without stirring. Undigested leaf tissue was removed by filtration with a 75 μm nylon mesh, and the flow-through was centrifuged at 200g for 3 min to pellet the protoplasts in a round-bottomed tube. Pelleted protoplasts were resuspended in 0.4 M mannitol solution (containing 15 mM MgCl2 and 4 mM MES) with a pH of 5.7, which has similar osmolarity and pH to the protoplasts. Isolated protoplasts can be kept viable on ice for over 24 h. However, we used only freshly isolated protoplasts for all internalization and gene expression studies.
Cy3–DNA–SWCNT and ssDNA–SWCNT internalization by protoplasts.
A 200 μl volume of the 3 × 10⁵ cells ml−1 protoplast solution was mixed with Cy3–DNA–SWCNT solution containing 200 nM DNA and incubated at room temperature for 4 h. The supernatant containing excess free Cy3–DNA–SWCNT was removed without disturbing the protoplast pellet. The protoplasts were immediately resuspended in 200 μl of MMg solution (0.4 M mannitol, 15 mM MgCl2, and 4 mM MES, pH 5.7). A 200 μl volume of the protoplast solution was transferred to a poly-l-lysine-coated microwell dish and the protoplasts were allowed to settle at room temperature for 1 h. Immediately before imaging, 150 μl of the sample was removed from the microwell dish and DAPI was added at a final concentration of 2 μg ml−1 to stain protoplast nuclei for 5–10 min. Cy3 and DAPI fluorescence were imaged with a fluorescence microscope, and images were overlaid in ImageJ for co-localization analysis.
Similarly, 200 μl of the 3 × 10⁵ cells ml−1 protoplast suspension was mixed with 48 μl of 15.5 mg l−1 ssDNA–SWCNT. The samples were tapped lightly every 15 min to encourage mixing and prevent protoplasts from settling at the bottom of the tube. Samples were incubated for 9 h at room temperature. The same sample preparation steps for imaging as used in “Cy3–DNA–SWCNT and ssDNA–SWCNT internalization by protoplasts” were followed, and all NIR images were captured using a custom-built near-infrared inverted microscope equipped with a Raptor Ninox VIS-SWIR 640 camera. Bright-field images were captured with a 100 ms exposure time. Near-infrared images were captured using a 720 nm excitation laser with a 200 ms exposure time and with a 1,070 nm long-pass filter to avoid chlorophyll autofluorescence.
Protoplast transformation with DNA–SWCNTs prepared via dialysis.
A 100 μl volume (~2 × 10⁴) of isolated protoplasts in mannitol solution was added to 10 μg DNA containing DNA–SWCNT dialysis solution, or for the control sample only 10 μg plasmid DNA, and mixed well by gently tapping the tube. The mixture was incubated at room temperature for 1 h, and subsequently centrifuged at 200g for 3 min to pellet protoplasts. Protoplasts were resuspended in 1 ml of 0.5 M mannitol solution (containing 4 mM MES and 20 mM KCl at pH 5.7) in a non-culture treated 6-well plate (Corning) for 24 h in the dark. Protoplasts settled at the bottom of the well plate. Fluorescence microscopy was performed through the well plate to image the protoplasts and to measure GFP expression for quantification of transformation efficiency.
Single-molecule TIRF to image DNA protection by SWCNTs.
See Supplementary Information for details.
Statistics and data analysis.
AFM height data.
In Fig. 1d, the N = 10 replicates are measurements of heights of different SWCNTs within the same SWCNT suspension. Data are expressed as each measurement together with error bars indicating standard deviation. Significance was measured with one-way ANOVA with Tukey’s multiple comparisons test; F = 885.9. In Fig. 1d, the P-value for comparing COOH–SWCNT with PEI–SWCNT sample is **** P < 0.0001. In Fig. 1d, the P-value for comparing PEI–SWCNT with DNA–PEI–SWCNT is **** P < 0.0001.
Zeta potential data.
In Fig. 1e, the N = 5 replicates are zeta potential measurements of the same SWCNT suspension. Data are expressed as each measurement together with error bars indicating standard deviation. Significance was measured with one-way ANOVA with Tukey’s multiple comparisons test; F = 753.2. In Fig. 1e, the P-value for comparing COOH–SWCNT with PEI–SWCNT sample is **** P < 0.0001. In Fig. 1e, the P-value for comparing PEI–SWCNT with DNA–PEI–SWCNT sample is * P = 0.0191.
Leaf GFP expression data.
In Fig. 2, the N = 3 replicates are independent experiments: three separate leaves infiltrated per sample and imaged. Each independent sample replicate contains 15 technical replicates (15 measurement from the same leaf). The confocal images reported in Fig. 2b,c and 3a,d,e are representative images chosen from the results obtained in three independent experiments. Data are expressed as each mean from the three independent experiments together with error bars indicating standard error of the mean. Significance was measured with one-way ANOVA with Tukey’s multiple comparisons test. In Fig. 2e, F = 22.33. The P-value for comparing the dialysis with electrostatic grafting samples is **** P < 0.0001, and the P-value for comparing lDNA–PEI–SW with pDNA–PEI–SW sample is ** P = 0.001. In Fig. 3b, significance was measured with two-way ANOVA with Sidak’s multiple comparisons test. The P-value for comparing DNA–CNT day 3 with day 10 sample is *** P = 0.0001. For the qPCR results reported in Fig. 3c, the N = 3 replicates are independent experiments: three separate leaves infiltrated per sample and measured with qPCR. Each sample in each independent experiment consisted of three technical replicates of the qPCR reaction. Data are expressed as each mean from the three independent experiments together with error bars indicating standard error of the mean. Significance was measured with two-way ANOVA with Sidak’s multiple comparisons test. The P-value for comparing DNA–CNT day 3 with day 10 sample is *** P = 0.0003. In Fig. 3f, significance was measured with two-way ANOVA with Sidak’s multiple comparisons test. The P-value for comparing Agrobacterium day 3 with day 10 sample is * P = 0.012. For the qPCR results reported in Fig. 3g, the N = 3 replicates are independent experiments: three separate leaves were infiltrated per sample and measured with qPCR. Each sample in each independent experiment consisted of three technical replicates of the qPCR reaction. Data are expressed as each mean from the three independent experiments together with error bars indicating standard error of the mean. Significance was measured with two-way ANOVA with Sidak’s multiple comparisons test. The P-value for comparing Agrobacterium day 3 with day 10 sample is ** P = 0.0028.
Toxicity qPCR data.
The N = 3 replicates are independent experiments with separate infiltrations of CNT solutions for each replicate. For the toxicity plot in Fig. 3j, the P-value for comparing no manipulation with buffer sample is * P = 0.0169, and the P-value for comparing buffer with DNA–CNT sample is P = 0.5609; the results were non-significant, and the P-value for comparing 10% SDS with all other samples is **** P < 0.0001, in one-way ANOVA with Tukey’s multiple comparisons test, F = 55.19. For the toxicity plot in Supplementary Fig. 11, the P-value for comparing buffer with PEI–SWCNT at 3 h is *** P = 0.0009, the P-value for comparing buffer with all other SWCNT samples is greater than 0.7863; the results were non-significant, and the P-value for comparing buffer with 10% SDS sample is **** P < 0.0001 in one-way ANOVA with Tukey’s multiple comparisons test, F = 33.01.
Protoplast GFP expression data.
The N = 5 replicates are independent experiments: five separate protoplast solutions were incubated with samples and imaged with fluorescence microscopy. The images reported in Fig. 4b,c are representative images chosen from the results obtained in five independent experiments. Percent transformation efficiency data are expressed as each mean from the five independent experiments together with error bars indicating standard error of the mean. Significance was measured with one-way ANOVA with Tukey’s multiple comparisons test: F = 123.5. The P-value for comparing buffer with DNA–CNT sample is **** P < 0.0001, and the P-value for comparing free DNA with DNA–CNT sample is **** P < 0.0001.
smTIRF microscopy data.
For each sample, the N = 3 replicates are three channels on a microscopy slide, prepared independently. Each channel was used to obtain 30 fields of view (technical replicates). In Supplementary Fig. 3b and c, data are expressed as each mean from the three independent channels together with error bars indicating standard error of the mean. Significance was measured with two-tailed unpaired t-test (F = 303.7 and **** P < 0.0001 for comparing free RNA with the RNA–SWCNT sample).
Supplementary Material
Acknowledgements
The authors acknowledge support from a Burroughs Wellcome Fund Career Award at the Scientific Interface (CASI), a Stanley Fahn PDF Junior Faculty Grant under award no. PF-JFA-1760, a Beckman Foundation Young Investigator Award, a USDA AFRI award, a grant from the Gordon and Betty Moore Foundation, a USDA NIFA award, support from the Chan-Zuckerberg foundation and an FFAR New Innovator Award (to M.P.L). G.S.D. is supported by a Schlumberger Foundation Faculty for the Future Fellowship. L.C. is supported by National Defense Science and Engineering Graduate (NDSEG) Fellowship and by the LAM Foundation. The authors thank C. Gee for assisting with the Imaging-PAM Maxi fluorimeter, A. Schultink and A. Ortega for helpful discussions and C. Jakobson and D. Tullman-Ercek for generously sharing their laboratory resources. The authors also acknowledge support from UC Berkeley Molecular Imaging Center (supported by the Gordon and Betty Moore Foundation), the UC Berkeley Biological Imaging Facility (supported in part by the National Institutes of Health S10 program under award no. 1S10OD018136-01), the QB3 Shared Stem Cell Facility, the Innovative Genomics Institute (IGI), and R. Zalpuri at the Electron Microscopy Lab at UC Berkeley for TEM sample preparation and imaging.
Footnotes
Competing interests
The authors declare no competing interests.
Supplementary information is available for this paper at https://doi.org/10.1038/s41565-019-0382-5.
Online content
Any methods, additional references, Nature Research reporting summaries, source data, statements of data availability and associated accession codes are available at https://doi.org/10.1038/s41565-019-0382-5.
Data availability
The data that support the plots within this paper and other findings of this study are available from the corresponding author upon reasonable request.
References
- 1.Daniell H, Datta R, Varma S, Gray S & Lee S-B Containment of herbicide resistance through genetic engineering of the chloroplast genome. Nat. Biotechnol 16, 345–348 (1998). [DOI] [PMC free article] [PubMed] [Google Scholar]
- 2.Liu Y et al. A gene cluster encoding lectin receptor kinases confers broad-spectrum and durable insect resistance in rice. Nat. Biotechnol 33, 301–305 (2015). [DOI] [PubMed] [Google Scholar]
- 3.Li T, Liu B, Spalding MH, Weeks DP & Yang B High-efficiency TALEN-based gene editing produces disease-resistant rice. Nat. Biotechnol 30, 390–392 (2012). [DOI] [PubMed] [Google Scholar]
- 4.Zhang G et al. Overexpression of the soybean GmERF3 gene, an AP2/ERF type transcription factor for increased tolerances to salt, drought, and diseases in transgenic tobacco. J. Exp. Bot 60, 3781–3796 (2009). [DOI] [PMC free article] [PubMed] [Google Scholar]
- 5.Chen Q & Lai H Gene delivery into plant cells for recombinant protein production. Biomed. Res. Int 2015, 932161 (2015). [DOI] [PMC free article] [PubMed] [Google Scholar]
- 6.Himmel ME et al. Biomass recalcitrance: engineering plants and enzymes for biofuels production. Science 315, 804 (2007). [DOI] [PubMed] [Google Scholar]
- 7.Tufekcioglu A, Raich J, Isenhart T & Schultz R Biomass, carbon and nitrogen dynamics of multi-species riparian buffers within an agricultural watershed in Iowa, USA. Agroforest. Syst 57, 187–198 (2003). [Google Scholar]
- 8.Altpeter F et al. Advancing crop transformation in the era of genome editing. Plant Cell 28, 1510–1520 (2016). [DOI] [PMC free article] [PubMed] [Google Scholar]
- 9.Herrera-Estrella L, Depicker A, Van Montagu M & Schell J Expression of chimaeric genes transferred into plant cells using a Ti-plasmid-derived vector. Nature 303, 209–213 (1983). [PubMed] [Google Scholar]
- 10.Baltes NJ, Gil-Humanes J & Voytas DF Genome engineering and agriculture: opportunities and challenges. Prog. Mol. Biol. Transl. Sci 149, 1–26 (2017). [DOI] [PMC free article] [PubMed] [Google Scholar]
- 11.Klein TM, Wolf E, Wu R & Sanford J High-velocity microprojectiles for delivering nucleic acids into living cells. Nature 327, 70–73 (1987). [PubMed] [Google Scholar]
- 12.Caranta C, Aranda MA, Tepfer M & Lopez-Moya JJ Recent Advances in Plant Virology (Horizon Scientific, Poole, 2011). [Google Scholar]
- 13.Gleba Y, Klimyuk V & Marillonnet S Viral vectors for the expression of proteins in plants. Curr. Opin. Biotechnol 18, 134–141 (2007). [DOI] [PubMed] [Google Scholar]
- 14.Song S, Hao Y, Yang X, Patra P & Chen J Using gold nanoparticles as delivery vehicles for targeted delivery of chemotherapy drug fludarabine phosphate to treat hematological cancers. J. Nanosci. Nanotechnol 16, 2582–2586 (2016). [DOI] [PubMed] [Google Scholar]
- 15.Mizrachi A et al. Tumour-specific PI3K inhibition via nanoparticle-targeted delivery in head and neck squamous cell carcinoma. Nat. Commun 8, 14292 (2017). [DOI] [PMC free article] [PubMed] [Google Scholar]
- 16.Demirer GS & Landry MP Delivering genes to plants. Chem. Eng. Progr 113, 40–45 (2017). [Google Scholar]
- 17.Hussain HI, Yi Z, Rookes JE, Kong LX & Cahill DM Mesoporous silica nanoparticles as a biomolecule delivery vehicle in plants. J. Nanoparticle Res 15, 1676 (2013). [Google Scholar]
- 18.Silva AT, Nguyen A, Ye C, Verchot J & Moon JH Conjugated polymer nanoparticles for effective siRNA delivery to tobacco BY-2 protoplasts. BMC Plant Biol. 10, 291 (2010). [DOI] [PMC free article] [PubMed] [Google Scholar]
- 19.Martin-Ortigosa S et al. Parameters affecting the efficient delivery of mesoporous silica nanoparticle materials and gold nanorods into plant tissues by the biolistic method. Small 8, 413–422 (2012). [DOI] [PubMed] [Google Scholar]
- 20.Liu J et al. Preparation of fluorescence starch-nanoparticle and its application as plant transgenic vehicle. J. Cent. South Univ. Technol 15, 768–773 (2008). [Google Scholar]
- 21.Chang F-P et al. A simple plant gene delivery system using mesoporous silica nanoparticles as carriers. J. Mater. Chem. B 1, 5279–5287 (2013). [DOI] [PubMed] [Google Scholar]
- 22.Zhang H et al. DNA nanostructures coordinate gene silencing in mature plants. 10.1101/538678 (2019). [DOI] [PMC free article] [PubMed] [Google Scholar]
- 23.Asad S & Arshad M in Properties and Applications of Silicon Carbide (ed. Gerhardt R) Ch. 15 (InTech, London, 2011). [Google Scholar]
- 24.Mitter N et al. Clay nanosheets for topical delivery of RNAi for sustained protection against plant viruses. Nat. Plants 3, 16207 (2017). [DOI] [PubMed] [Google Scholar]
- 25.Bao W, Wan Y & Baluška F Nanosheets for delivery of biomolecules into plant cells. Trends Plant Sci. 22, 445–447 (2017). [DOI] [PubMed] [Google Scholar]
- 26.Bao W, Wang J, Wang Q, O’Hare D & Wan Y Layered double hydroxide nanotransporter for molecule delivery to intact plant cells. Sci. Rep 6, 26738 (2016). [DOI] [PMC free article] [PubMed] [Google Scholar]
- 27.Wong MH et al. Lipid exchange envelope penetration (LEEP) of nanoparticles for plant engineering: a universal localization mechanism. Nano Lett. 16, 1161–1172 (2016). [DOI] [PubMed] [Google Scholar]
- 28.Giraldo JP et al. Plant nanobionics approach to augment photosynthesis and biochemical sensing. Nat. Mater 13, 400–408 (2014). [DOI] [PubMed] [Google Scholar]
- 29.Wu Y, Phillips JA, Liu H, Yang R & Tan W Carbon nanotubes protect DNA strands during cellular delivery. ACS Nano 2, 2023–2028 (2008). [DOI] [PMC free article] [PubMed] [Google Scholar]
- 30.Zheng M et al. DNA-assisted dispersion and separation of carbon nanotubes. Nat. Mater 2, 338–342 (2003). [DOI] [PubMed] [Google Scholar]
- 31.Wang H et al. High-yield sorting of small-diameter carbon nanotubes for solar cells and transistors. ACS Nano 8, 2609–2617 (2014). [DOI] [PubMed] [Google Scholar]
- 32.Liu Q et al. Carbon nanotubes as molecular transporters for walled plant cells. Nano Lett. 9, 1007–1010 (2009). [DOI] [PubMed] [Google Scholar]
- 33.Serag MF et al. Trafficking and subcellular localization of multiwalled carbon nanotubes in plant cells. ACS Nano 5, 493–499 (2010). [DOI] [PubMed] [Google Scholar]
- 34.Wong MH et al. Nitroaromatic detection and infrared communication from wild-type plants using plant nanobionics. Nat. Mater 16, 264–272 (2017). [DOI] [PubMed] [Google Scholar]
- 35.Choi JH & Strano MS Solvatochromism in single-walled carbon nanotubes. Appl. Phys. Lett 90, 223114 (2007). [Google Scholar]
- 36.Tinland B The integration of T-DNA into plant genomes. Trends Plant Sci. 1, 178–184 (1996). [Google Scholar]
- 37.McDermott GP et al. Multiplexed target detection using DNA-binding dye chemistry in droplet digital PCR. Anal. Chem 85, 11619–11627 (2013). [DOI] [PubMed] [Google Scholar]
- 38.Collier R et al. Accurate measurement of transgene copy number in crop plants using droplet digital PCR. Plant J. 90, 1014–1025 (2017). [DOI] [PubMed] [Google Scholar]
- 39.Miyaoka Y, Mayerl SJ, Chan AH & Conklin BR Detection and quantification of HDR and NHEJ induced by genome editing at endogenous gene loci using droplet digital PCR. Methods Mol. Biol 1768, 349–362 (2018). [DOI] [PMC free article] [PubMed] [Google Scholar]
- 40.Glowacka K et al. An evaluation of new and established methods to determine T-DNA copy number and homozygosity in transgenic plants. Plant Cell Environ. 39, 908–917 (2016). [DOI] [PMC free article] [PubMed] [Google Scholar]
- 41.Dobnik D, Stebih D, Blejec A, Morisset D & Zel J Multiplex quantification of four DNA targets in one reaction with Bio-Rad droplet digital PCR system for GMO detection. Sci. Rep 6, 35451 (2016). [DOI] [PMC free article] [PubMed] [Google Scholar]
- 42.Yoshioka H et al. Nicotiana benthamiana gp91phox homologs NbrbohA and NbrbohB participate in H2O2 accumulation and resistance to Phytophthora infestans. Plant Cell 15, 706–718 (2003). [DOI] [PMC free article] [PubMed] [Google Scholar]
- 43.Van Kooten O & Snel JF The use of chlorophyll fluorescence nomenclature in plant stress physiology. Photosynth. Res 25, 147–150 (1990). [DOI] [PubMed] [Google Scholar]
- 44.Lew TTS et al. Rational design principles for the transport and subcellular distribution of nanomaterials into plant protoplasts. Small 14, e1802086 (2018). [DOI] [PubMed] [Google Scholar]
- 45.Schaumberg KA et al. Quantitative characterization of genetic parts and circuits for plant synthetic biology. Nat. Methods 13, 94 (2016). [DOI] [PubMed] [Google Scholar]
- 46.Sullivan AM et al. Mapping and dynamics of regulatory DNA and transcription factor networks in A. thaliana. Cell Rep. 8, 2015–2030 (2014). [DOI] [PubMed] [Google Scholar]
- 47.Lau W & Sattely ES Six enzymes from mayapple that complete the biosynthetic pathway to the etoposide aglycone. Science 349, 1224–1228 (2015). [DOI] [PMC free article] [PubMed] [Google Scholar]
- 48.Cunningham FJ, Goh NS, Demirer GS, Matos JL & Landry MP Nanoparticle-mediated delivery towards advancing plant genetic engineering. Trends Biotechnol. 36, 882–897 (2018). [DOI] [PMC free article] [PubMed] [Google Scholar]
- 49.Del Bonis-O’Donnell JT et al. Engineering molecular recognition with bio-mimetic polymers on single walled carbon nanotubes. J. Visual. Exp 119, e55030 (2017). [DOI] [PMC free article] [PubMed] [Google Scholar]
- 50.Yoo S-D, Cho Y-H & Sheen J Arabidopsis mesophyll protoplasts: a versatile cell system for transient gene expression analysis. Nat. Protoc 2, 1565 (2007). [DOI] [PubMed] [Google Scholar]
- 51.Yang M, Gao Y, Li H & Adronov A Functionalization of multiwalled carbon nanotubes with polyamide 6 by anionic ring-opening polymerization. Carbon 45, 2327–2333 (2007). [Google Scholar]
- 52.Beyene AG, Demirer GS & Landry MP Nanoparticle-templated molecular recognition platforms for detection of biological analytes. Curr. Protoc. Chem. Biol 8, 197–223 (2016). [DOI] [PMC free article] [PubMed] [Google Scholar]
- 53.Ma L et al. Enhanced Li–S batteries using amine-functionalized carbon nanotubes in the cathode. ACS Nano 10, 1050–1059 (2015). [DOI] [PubMed] [Google Scholar]
- 54.Schmittgen TD & Livak KJ Analyzing real-time PCR data by the comparative CT method. Nat. Protoc 3, 1101 (2008). [DOI] [PubMed] [Google Scholar]
Associated Data
This section collects any data citations, data availability statements, or supplementary materials included in this article.
Supplementary Materials
Data Availability Statement
The data that support the plots within this paper and other findings of this study are available from the corresponding author upon reasonable request.