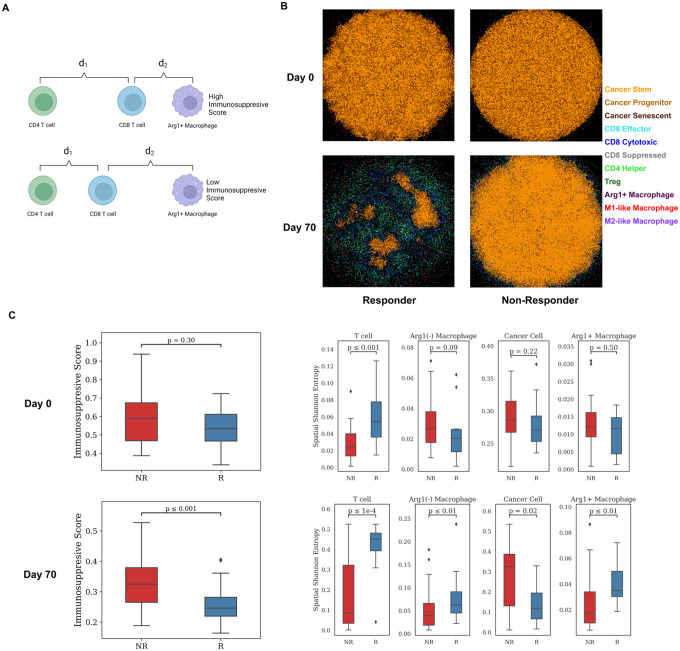
Fig 4. Spatial metrics summarized from model outputs.
A) Schematic illustrates the definition of an Immunosuppressive Score. For each CD8+ T cell, d1 is defined as the distance to its closest CD4+ T cell, and d2 is denoted as the distance to its closest Arg1+ Macrophage. The Immunosuppressive Score is defined as . B) Simulated multiplexed imaging data used for calculating spatial metrics for responder and non-responder, respectively. Each sample is taken at y = 100μm. C) Spatial metric calculations based on simulated multiplexed imaging data of 60 virtual patients’ simulation. Left: Immunosuppressive Score calculated on per-cell basis, grouped by treatment outcome. Right: Spatial Shannon’s Entropy calculated for T cell, Macrophage, Cancer cell, and Arg1+ Macrophage in the simulated data at Day 0 and Day 70.

